echarts共享X轴案例:
<!DOCTYPE html>
<html lang="en">
<head>
<meta charset="UTF-8" />
<meta name="viewport" content="width=device-width, initial-scale=1.0" />
<title>Document</title>
<style>
.wrap {
width: 100%;
height: 400px;
overflow: hidden;
}
/* #lineChart {
width: 100%;
height: 100%;
} */
</style>
</head>
<body>
<script src="https://cdn.jsdelivr.net/npm/echarts@5.4.3/dist/echarts.min.js"></script>
<div id="lineChart" style="width: 800px; height: 600px"></div>
<script>
myChart = null; // 定义变量用来存放echarts实例
xData = ['周一', '周二', '周三', '周四', '周五', '周六', '周日']; // 两个echarts公用的x轴的数据
y1Data = [8888, 9999, 7777, 10000, 3334, 7878, 6543]; // 小件货物
y2Data = [56, 64, 32, 58, 64, 76, 81]; // 网点负荷
y3Data = [88, 99, 77, 100, 21, 66, 95]; // 大件货物
// 画图方法
let drawEcharts = function () {
myChart = echarts.init(document.getElementById('lineChart'));
let options = {
color: ['#bfa', '#baf', 'pink', '#baf'], // 配置数据颜色
grid: [
// 配置第一个折线图的位置
{
left: '14.5%',
right: '12%',
top: '10%',
height: '32%',
},
// 配置第二个折线图位置
{
left: '14.5%',
right: '12%',
top: '50%',
height: '32%',
},
],
tooltip: {
trigger: 'axis', //axis /item
// formatter函数动态修改tooltip样式
formatter: function (params) {
if (params) {
var htmlStr = '';
htmlStr += params[0].name.replace(/\-/g, '/') + '<br/>'; //x轴的名称
for (var i = 0; i < params.length; i++) {
var param = params[i]; // 存一份item项
var seriesName = param.seriesName; //图例名称
var value = param.value; //y轴值
var color = param.color; //图例颜色
htmlStr += '<div>';
htmlStr += '<span style="margin-right:5px;display:inline-block;width:10px;height:10px;border-radius:5px;background-color:' + color + ';"></span>';
//圆点后面显示的文本
htmlStr += seriesName + ':' + value;
switch (seriesName) {
case '小件货物':
htmlStr += ' ' + '件';
break;
case '网点负荷':
htmlStr += ' ' + '%';
break;
case '大件货物':
htmlStr += ' ' + '件';
break;
default:
htmlStr += ' ';
}
htmlStr += '</div>';
}
return htmlStr;
} else {
return;
}
},
backgroundColor: '#ccc',
borderWidth: 1,
borderColor: '#ccc',
padding: 10,
textStyle: {
color: '#000',
fontSize: 12,
align: 'left',
},
hideDelay: 10000, //延时消失时间
},
legend: {
show: true,
x: 'center',
y: '0',
data: ['小件货物', '网点负荷', '大件货物', '网点负荷'],
textStyle: {
fontSize: 12,
},
},
// 将上下两个tootip合成一个
axisPointer: {
link: { xAxisIndex: 'all' },
},
xAxis: [
{
type: 'category',
scale: true,
axisLabel: {
show: false,
},
axisTick: {
alignWithLabel: true,
},
splitLine: {
show: false,
},
data: xData, //x轴时间的数据
},
{
gridIndex: 1,
type: 'category',
scale: true,
axisLabel: {
fontSize: 10,
},
axisTick: {
alignWithLabel: true,
},
splitLine: {
show: false,
},
data: xData, //x轴时间的数据
},
],
yAxis: [
{
type: 'value',
name: '件数',
nameLocation: 'center',
nameGap: 50,
nameTextStyle: {
fontSize: 12,
fontWeight: '500',
},
axisLabel: {
fontSize: 12,
},
min: function (value) {
return parseInt(value.min);
},
max: function (value) {
return parseInt(value.max * 1.05);
},
scale: false,
boundaryGap: [0, '100%'],
splitLine: {
show: false,
},
splitNumber: 4, //设置坐标轴的分割段数
},
{
type: 'value',
name: '负荷/百分比',
nameLocation: 'center',
nameGap: 42,
nameTextStyle: {
fontSize: 12,
},
axisLabel: {
fontSize: 12,
},
// min: function (value) {
// return parseInt(value.min);
// },
// max: function (value) {
// return parseInt(value.max * 1.05);
// },
scale: true,
boundaryGap: [0, '100%'],
splitLine: {
show: false,
},
splitNumber: 4, //设置坐标轴的分割段数
},
{
type: 'value',
name: '件数',
nameLocation: 'center',
gridIndex: 1,
nameGap: 30,
nameTextStyle: {
fontSize: 12,
},
axisLabel: {
fontSize: 12,
},
min: function (value) {
return parseInt(value.min);
},
max: function (value) {
return parseInt(value.max * 1.05);
},
scale: true,
boundaryGap: [0, '100%'],
splitLine: {
show: false,
},
splitNumber: 4, //设置坐标轴的分割段数
},
{
type: 'value',
name: '负荷/百分比',
nameLocation: 'center',
gridIndex: 1,
nameGap: 42,
nameTextStyle: {
fontSize: 12,
},
axisLabel: {
fontSize: 12,
},
// min: function (value) {
// return parseInt(value.min);
// },
// max: function (value) {
// return parseInt(value.max * 1.05);
// },
scale: true,
boundaryGap: [0, '100%'],
splitLine: {
show: false,
},
splitNumber: 4, //设置坐标轴的分割段数
},
],
dataZoom: [
{
type: 'inside',
startValue: y1Data.length - 4, // 放置最后4个数组
endValue: y1Data.length - 1,
xAxisIndex: [0, 1], // 显示 0 1 的数据,这个要加,不加的话,悬浮提示就会出问题
},
],
series: [
{
name: '小件货物',
type: 'line',
xAxisIndex: 0,
yAxisIndex: 0,
hoverAnimation: true, // 悬浮的动画加上
data: y1Data, //小件货物
itemStyle: { normal: { label: { show: true } } },
},
{
name: '网点负荷',
type: 'line',
xAxisIndex: 0,
yAxisIndex: 1,
hoverAnimation: true, // 悬浮的动画加上
data: y2Data, //网点负荷
},
{
name: '大件货物',
type: 'line',
xAxisIndex: 1,
yAxisIndex: 2,
hoverAnimation: true, // 悬浮的动画加上
data: y3Data, //大件货物
},
{
name: '网点负荷',
type: 'line',
xAxisIndex: 1,
yAxisIndex: 3,
hoverAnimation: true, // 悬浮的动画加上
data: y2Data, //网点负荷
},
],
};
myChart.setOption(options);
// function autoTip() {
// timer = setTimeout(function () {
// //3.0以上版本的showTip使用方式
// //如何让三个点同时显示?
// myChart.dispatchAction({ type: 'showTip', seriesIndex: 0, dataIndex: 0 });
// myChart.dispatchAction({ type: 'showTip', seriesIndex: 1, dataIndex: 1 });
// myChart.dispatchAction({ type: 'showTip', seriesIndex: 2, dataIndex: 2 });
// }, 1000);
// }
// autoTip();
// myChart1.group = "group1";
// myChart2.group = "group1";
// echarts.connect("group1");
};
drawEcharts();
</script>
</body>
</html>
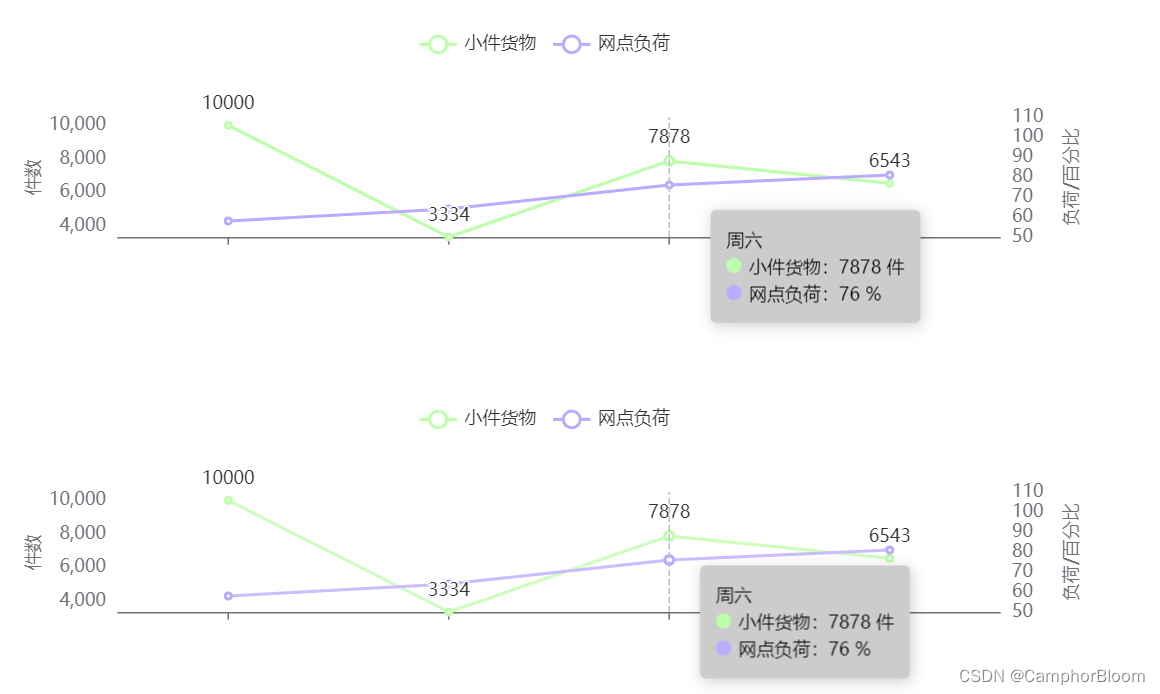
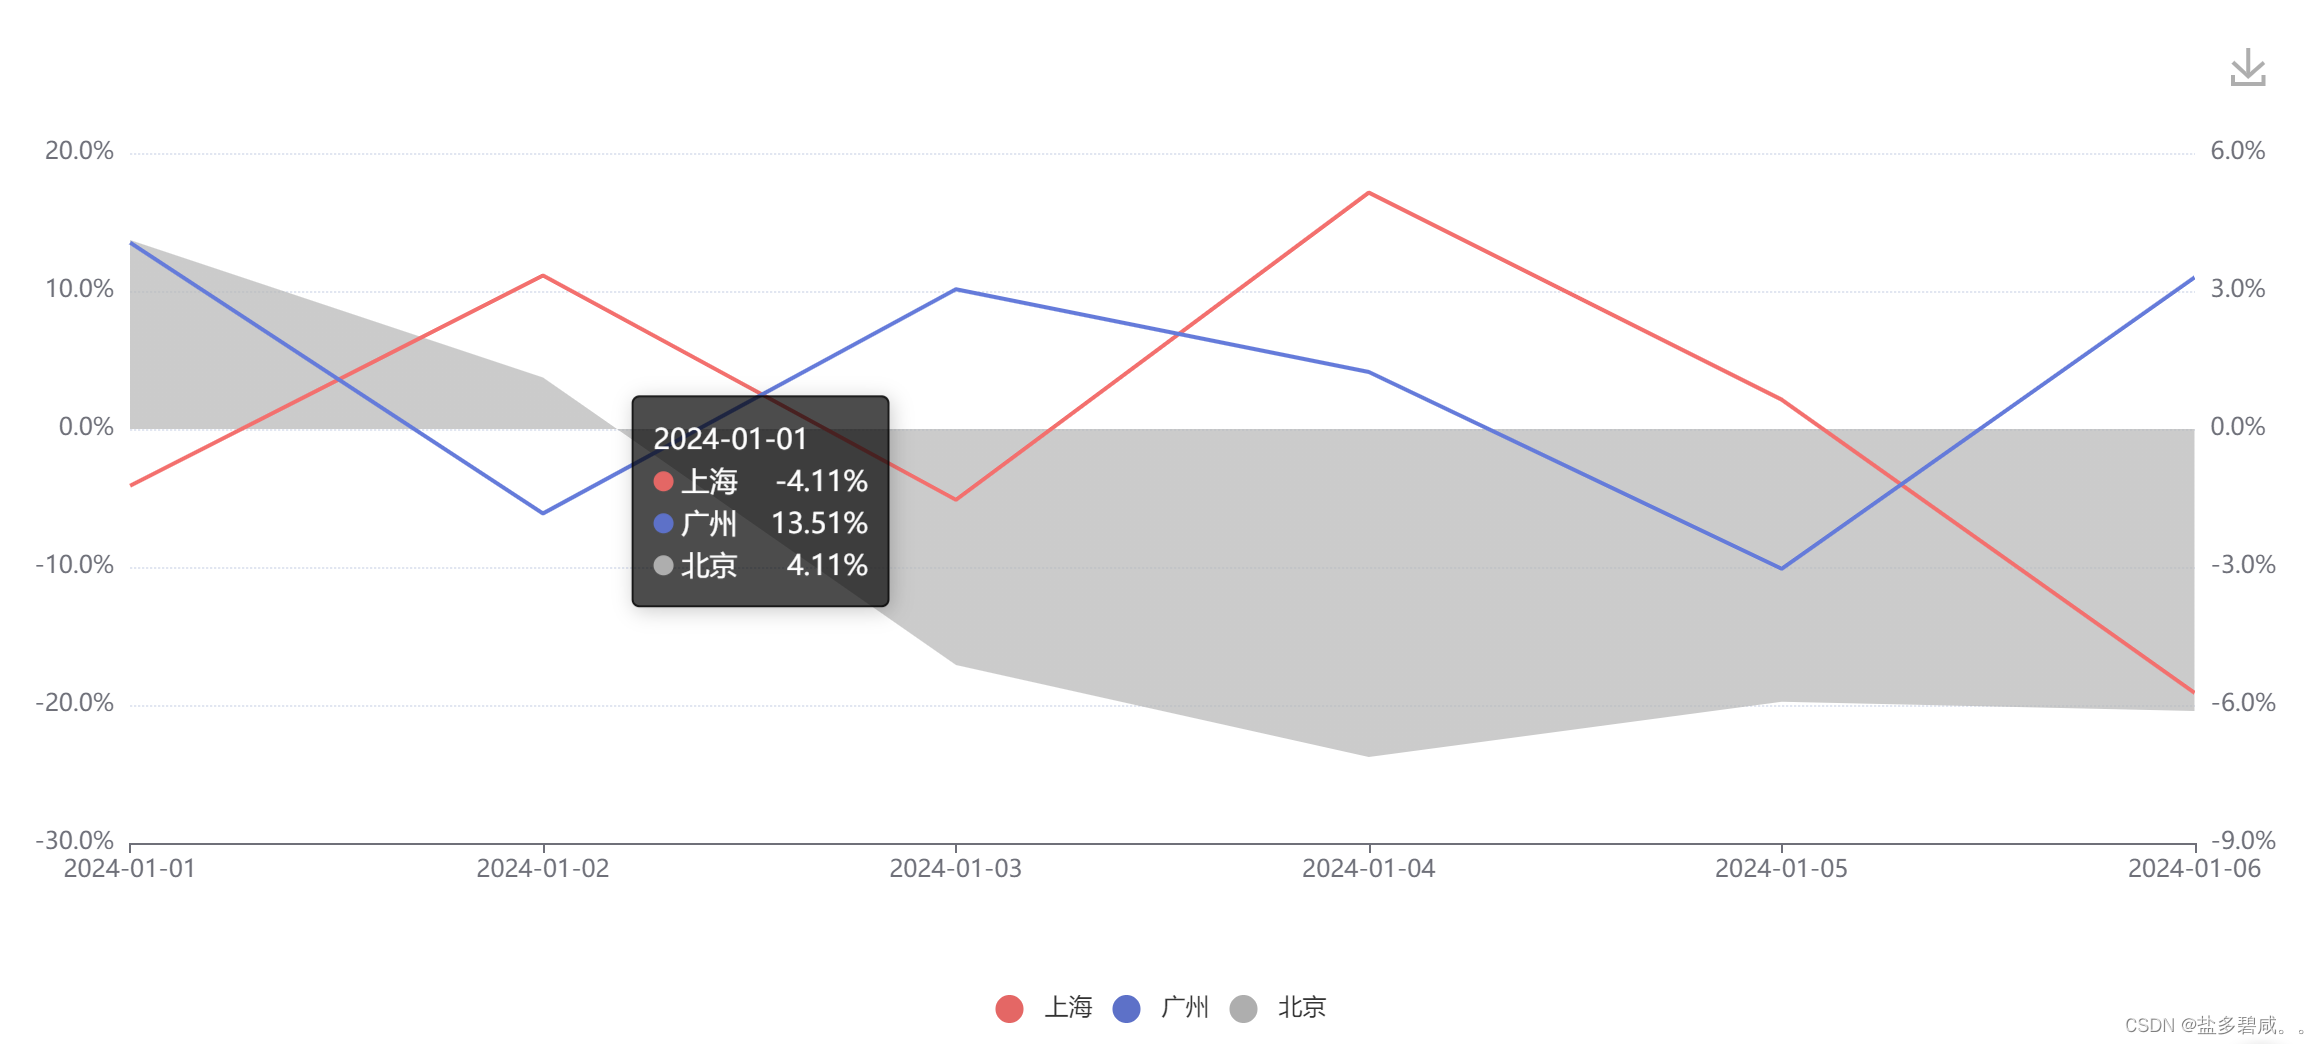
效果图:
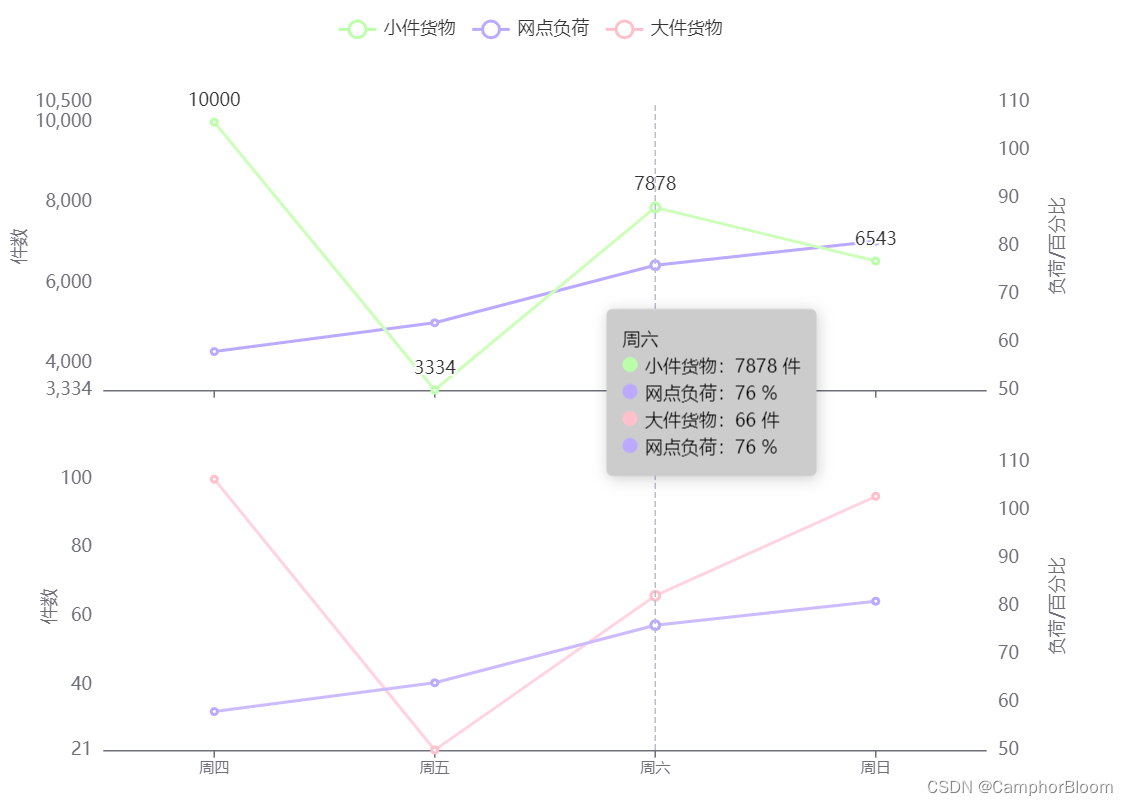
在此基础上,实现tooltip分别显示在各自grid中:
<!DOCTYPE html>
<html lang="en">
<head>
<meta charset="UTF-8" />
<meta name="viewport" content="width=device-width, initial-scale=1.0" />
<title>Document</title>
<style>
* {
margin: 0;
padding: 0;
}
.main {
width: 100vw;
margin-top: 20px;
}
#lineChart {
position: relative;
height: 50vh;
overflow: hidden;
}
#lineChart2 {
position: relative;
height: 50vh;
overflow: hidden;
}
</style>
</head>
<body>
<script src="https://cdn.jsdelivr.net/npm/echarts@5.4.3/dist/echarts.min.js"></script>
<div class="main">
<div id="lineChart" style="width: 800px; height: 250px"></div>
<div id="lineChart2" style="width: 800px; height: 250px"></div>
</div>
<script>
myChart = null; // 定义变量用来存放echarts实例
xData = ['周一', '周二', '周三', '周四', '周五', '周六', '周日']; // 两个echarts公用的x轴的数据
y1Data = [8888, 9999, 7777, 10000, 3334, 7878, 6543]; // 小件货物
y2Data = [56, 64, 32, 58, 64, 76, 81]; // 网点负荷
y3Data = [88, 99, 77, 100, 21, 66, 95]; // 大件货物
// 画图方法
let drawEcharts = function () {
myChart1 = echarts.init(document.getElementById('lineChart'));
myChart2 = echarts.init(document.getElementById('lineChart2'));
let options = {
color: ['#bfa', '#baf', 'pink', '#baf'], // 配置数据颜色
grid: [
// 配置第一个折线图的位置
{
left: '14.5%',
right: '12%',
// top: '10%',
height: '32%',
},
],
tooltip: {
trigger: 'axis', //axis /item
// formatter函数动态修改tooltip样式
formatter: function (params) {
if (params) {
var htmlStr = '';
htmlStr += params[0].name.replace(/\-/g, '/') + '<br/>'; //x轴的名称
for (var i = 0; i < params.length; i++) {
var param = params[i]; // 存一份item项
var seriesName = param.seriesName; //图例名称
var value = param.value; //y轴值
var color = param.color; //图例颜色
htmlStr += '<div>';
htmlStr += '<span style="margin-right:5px;display:inline-block;width:10px;height:10px;border-radius:5px;background-color:' + color + ';"></span>';
//圆点后面显示的文本
htmlStr += seriesName + ':' + value;
switch (seriesName) {
case '小件货物':
htmlStr += ' ' + '件';
break;
case '网点负荷':
htmlStr += ' ' + '%';
break;
case '大件货物':
htmlStr += ' ' + '件';
break;
default:
htmlStr += ' ';
}
htmlStr += '</div>';
}
return htmlStr;
} else {
return;
}
},
backgroundColor: '#ccc',
borderWidth: 1,
borderColor: '#ccc',
padding: 10,
textStyle: {
color: '#000',
fontSize: 12,
align: 'left',
},
// hideDelay: 10000, //延时消失时间
},
legend: {
show: true,
x: 'center',
y: '0',
data: ['小件货物', '网点负荷'],
textStyle: {
fontSize: 12,
},
},
xAxis: [
{
type: 'category',
scale: true,
axisLabel: {
show: false,
},
axisTick: {
alignWithLabel: true,
},
splitLine: {
show: false,
},
data: xData, //x轴时间的数据
},
],
yAxis: [
{
type: 'value',
name: '件数',
nameLocation: 'center',
nameGap: 50,
nameTextStyle: {
fontSize: 12,
fontWeight: '500',
},
axisLabel: {
fontSize: 12,
},
min: function (value) {
return parseInt(value.min);
},
max: function (value) {
return parseInt(value.max * 1.05);
},
scale: false,
boundaryGap: [0, '100%'],
splitLine: {
show: false,
},
splitNumber: 4, //设置坐标轴的分割段数
},
{
type: 'value',
name: '负荷/百分比',
nameLocation: 'center',
nameGap: 42,
nameTextStyle: {
fontSize: 12,
},
axisLabel: {
fontSize: 12,
},
// min: function (value) {
// return parseInt(value.min);
// },
// max: function (value) {
// return parseInt(value.max * 1.05);
// },
scale: true,
boundaryGap: [0, '100%'],
splitLine: {
show: false,
},
splitNumber: 4, //设置坐标轴的分割段数
},
],
dataZoom: [
{
type: 'inside',
startValue: y1Data.length - 4, // 放置最后4个数组
endValue: y1Data.length - 1,
xAxisIndex: [0, 1], // 显示 0 1 的数据,这个要加,不加的话,悬浮提示就会出问题
},
],
series: [
{
name: '小件货物',
type: 'line',
xAxisIndex: 0,
yAxisIndex: 0,
hoverAnimation: true, // 悬浮的动画加上
data: y1Data, //小件货物
itemStyle: { normal: { label: { show: true } } },
},
{
name: '网点负荷',
type: 'line',
xAxisIndex: 0,
yAxisIndex: 1,
hoverAnimation: true, // 悬浮的动画加上
data: y2Data, //网点负荷
},
],
};
myChart1.setOption(options);
myChart2.setOption(options);
// function autoTip() {
// timer = setTimeout(function () {
// //3.0以上版本的showTip使用方式
// //如何让三个点同时显示?
// myChart.dispatchAction({ type: 'showTip', seriesIndex: 0, dataIndex: 0 });
// myChart.dispatchAction({ type: 'showTip', seriesIndex: 1, dataIndex: 1 });
// myChart.dispatchAction({ type: 'showTip', seriesIndex: 2, dataIndex: 2 });
// }, 1000);
// }
// autoTip();
myChart1.group = 'group1';
myChart2.group = 'group1';
echarts.connect('group1');
};
drawEcharts();
</script>
</body>
</html>
效果图: