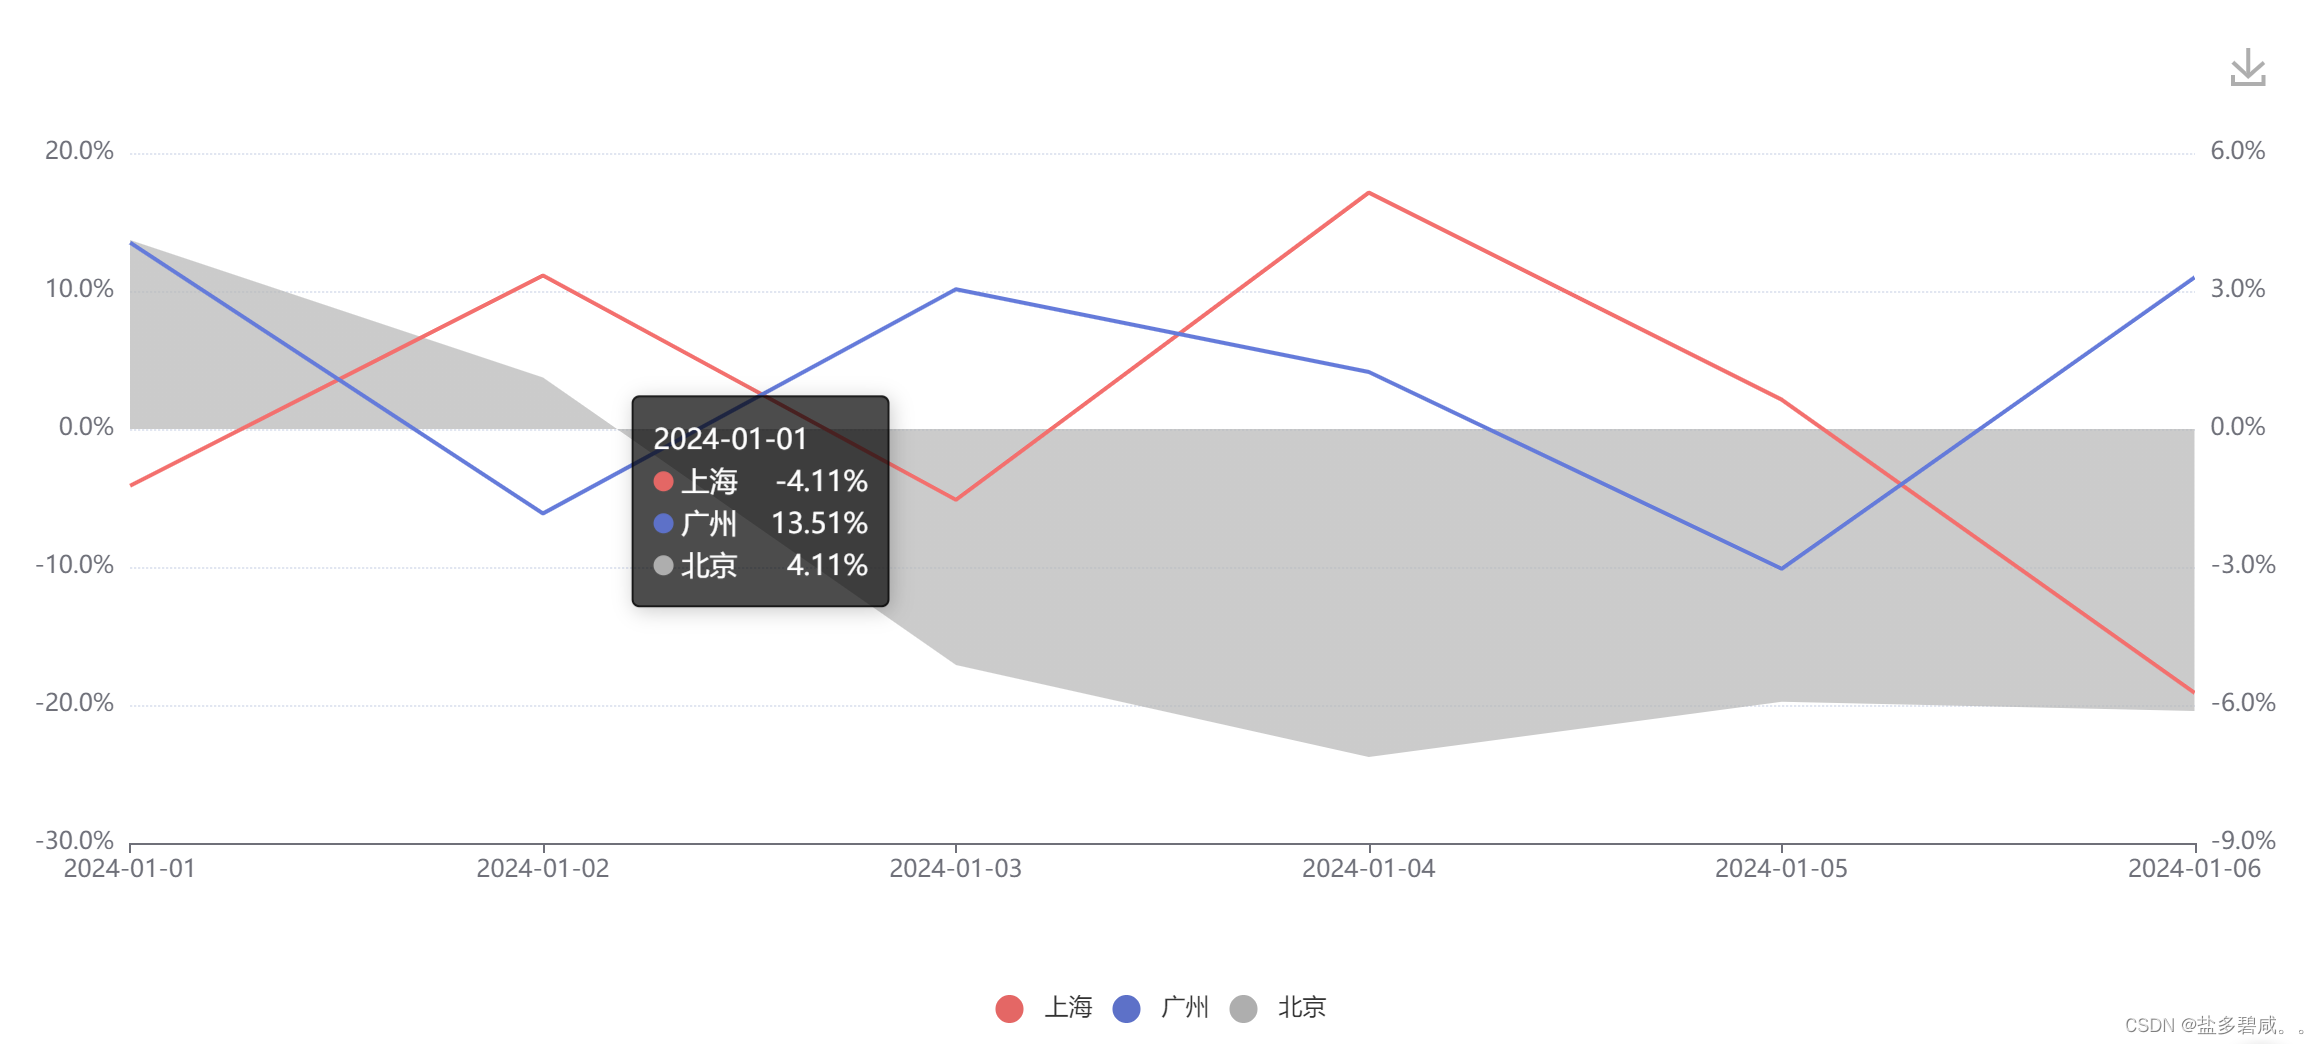
vue echarts折线图 折线堆积图和折线面积图
1、折线堆积图和折线面积图的结合;
上代码
<template>
<section>
<div
id="performaceLineChart"
ref="performaceLineChartRef"
style="width: 100%; height: 500px"
></div>
</section>
</template>
<script>
import * as echarts from "echarts";
export default {
name: "",
components: {},
props: {
},
data() {
return {
chart: null,
_thisForChart: null,
_thisForWindow: null,
};
},
watch: {},
mounted() {
this.$nextTick(() => {
this.initLineChart();
this.addEventListenerToSidebarContainer(this)
this.addEventListenerToWindowResize(this)
});
},
beforeDestroy() {
if (!this.chart) {
return;
}
this.removeEventListenerToSidebarContainer()
this.removeEventListenerToWindowResize()
this.chart.dispose();
this.chart = null;
},
methods: {
initLineChart() {
var chartDom = document.getElementById("performaceLineChart");
this.chart = echarts.init(chartDom);
this.setOptions();
},
setOptions(option) {
this.chart.setOption({
color: ["#ee6666", "#5470c6", "#aeaeae", "#f9c858",],
toolbox: {
top: "0",
right: "10",
itemSize: 18,
iconStyle: {
borderColor: "#aeaeae",
borderWidth: 2,
},
feature: {
saveAsImage: {
title: "导出图片",
name: '导出图片名称'
},
},
},
tooltip: {
trigger: "axis",
backgroundColor: 'rgba( 0, 0, 0,0.7)',
borderColor: 'rgba( 0, 0, 0,0.7)',
formatter: function (params) {
var str = params[0].name + "</br>";
for (let item of params) {
str =`<span style='color: #fff;'>${str}</span><div style='display:flex;align-items:center;justify-content:space-between;'><span>${item.marker}<span style='color: #fff;'>${item.seriesName}</span></span> <span style='color: #fff;'>${item.value}%</span></div>`;
}
return str;
},
},
legend: {
x: "center",
y: "bottom",
icon: "circle",
textStyle: {},
data: ['上海','广州','北京']
},
grid: {
left: "0.5%",
right: "1%",
bottom: "15%",
containLabel: true,
},
xAxis: {
type: "category",
boundaryGap: false,
axisLabel: {},
axisLine: {
show: true,
lineStyle: {},
onZero: false, // X轴线始终位于底部
},
splitLine: {
show: false,
},
data: ['2024-01-01','2024-01-02','2024-01-03','2024-01-04','2024-01-05','2024-01-06']
},
yAxis:[
{
type: "value",
scale: true,
// interval: 5,
splitNumber: 5,
// min: 'dataMin',
// max: 'dataMax',
// min: function(value) {
// return value.min
// },
// max: function(value) {
// return value.max
// },
alignTicks: true,
// max: function (val) {
// if (Math.abs(val.max)>Math.abs(val.min)) {
// return (Math.abs(val.max)*1.2).toFixed(0);}
// else {
// return (Math.abs(val.min)*1.2).toFixed(1);}},
// min: function (val) {
// if(Math.abs(val.max)>Math.abs(val.min)){
// return-(Math.abs(val.max)*1.2).toFixed(0);}
// else {
// return -(Math.abs(val.min)*1.2).toFixed(1);}},
axisLabel: {
show: true,
formatter: (value) => {
return `${value.toFixed(1)}%`
}
},
axisLine: {
show: false,
},
splitLine: {
show: true,
lineStyle: {
type: "dotted",
},
},
},
{
type: "value",
// interval: 5,
splitNumber: 5,
// min: 'dataMin',
// max: 'dataMax',
// min: function(value) {
// return value.min
// },
// max: function(value) {
// return value.max
// },
// alignTicks: true,
// max: function (val) {
// if (Math.abs(val.max)>Math.abs(val.min)) {
// return (Math.abs(val.max)*1.2).toFixed(0);}
// else {
// return (Math.abs(val.min)*1.2).toFixed(1);}},
// min: function (val) {
// if(Math.abs(val.max)>Math.abs(val.min)){
// return-(Math.abs(val.max)*1.2).toFixed(0);}
// else {
// return -(Math.abs(val.min)*1.2).toFixed(1);}},
axisLabel: {
show: true,
formatter: (value) => {
return `${value}%`
}
},
axisLine: {
show: false,
},
splitLine: {
show: true,
lineStyle: {
type: "dotted",
},
},
},
{
type: "value",
// interval: 5,
splitNumber: 5,
// min: 'dataMin',
// max: 'dataMax',
// min: function(value) {
// return value.min
// },
// max: function(value) {
// return value.max
// },
alignTicks: true,
// max: function (val) {
// if (Math.abs(val.max)>Math.abs(val.min)) {
// return (Math.abs(val.max)*1.2).toFixed(0);}
// else {
// return (Math.abs(val.min)*1.2).toFixed(1);}},
// min: function (val) {
// if(Math.abs(val.max)>Math.abs(val.min)){
// return-(Math.abs(val.max)*1.2).toFixed(0);}
// else {
// return -(Math.abs(val.min)*1.2).toFixed(1);}},
axisLabel: {
show: true,
formatter: (value) => {
return `${value.toFixed(1)}%`
}
},
axisLine: {
show: false,
},
splitLine: {
show: true,
lineStyle: {
type: "dotted",
},
},
},
{
type: "value",
// interval: 5,
splitNumber: 5,
// min: 'dataMin',
// max: 'dataMax',
// min: function(value) {
// return value.min
// },
// max: function(value) {
// return value.max
// },
// alignTicks: true,
// max: function (val) {
// if (Math.abs(val.max)>Math.abs(val.min)) {
// return (Math.abs(val.max)*1.2).toFixed(0);}
// else {
// return (Math.abs(val.min)*1.2).toFixed(1);}},
// min: function (val) {
// if(Math.abs(val.max)>Math.abs(val.min)){
// return-(Math.abs(val.max)*1.2).toFixed(0);}
// else {
// return -(Math.abs(val.min)*1.2).toFixed(1);}},
axisLabel: {
show: true,
formatter: (value) => {
return `${value}%`
}
},
axisLine: {
show: false,
},
splitLine: {
show: true,
lineStyle: {
type: "dotted",
},
},
},
],
series: [
{
name: '上海',
type: "line",
// stack: "total",
yAxisIndex: null,
// smooth: true,
showSymbol: false,
lineStyle: { width: 2 },
itemStyle: {
normal: {
label: {
show: false,
},
},
},
areaStyle: null,
data: ["-4.11", "11.12", "-5.13", "17.13", "2.13", "-19.13",],
},
{
name: '广州',
type: "line",
// stack: "total",
yAxisIndex: null,
// smooth: true,
showSymbol: false,
lineStyle: { width: 2 },
itemStyle: {
normal: {
label: {
show: false,
},
},
},
areaStyle: null,
data: ["13.51", "-6.12", "10.13", "4.13", "-10.13", "10.99",],
},
{
name: '北京',
type: "line",
// stack: "total",
yAxisIndex: 2,
// smooth: true,
showSymbol: false,
lineStyle: { width: 0 },
itemStyle: {
normal: {
label: {
show: false,
},
},
},
areaStyle: {
color: new echarts.graphic.LinearGradient(
0,
0,
0,
1,
[
{
offset: 0,
color: "rgb(174,174,174)",
},
{
offset: 1,
color: "rgb(174,174,174)",
},
],
),
},
data: ["4.11", "1.12", "-5.13", "-7.13", "-5.93", "-6.13",],
}
]
});
},
// 监听侧边栏导航的宽度发生变化
addEventListenerToSidebarContainer(_this) {
let sidebarContainer = document.getElementsByClassName("sidebar-container")[0];
this._thisForChart = _this;
sidebarContainer &&
sidebarContainer.addEventListener("transitionend", this.sidebarResizeHandler);
},
removeEventListenerToSidebarContainer() {
let sidebarContainer = document.getElementsByClassName("sidebar-container")[0];
this._thisForChart = null
sidebarContainer &&
sidebarContainer.removeEventListener("transitionend", this.sidebarResizeHandler);
},
sidebarResizeHandler(e) {
if (e.propertyName === "width") {
this._thisForChart.chart.resize();
}
},
// window 的尺寸发生变化的时候 会执行图表的resize
addEventListenerToWindowResize(_this) {
this._thisForWindow = _this;
window.addEventListener("resize", this.windowResizeHandler);
},
removeEventListenerToWindowResize(_this) {
this. _thisForWindow = null
window.removeEventListener("resize", this.windowResizeHandler);
},
windowResizeHandler(e) {
this._thisForWindow.chart.resize();
},
},
};
</script>
<style lang="scss" scoped>
</style>
展示效果图