Echarts 利用多X轴实现未来15天天气预报
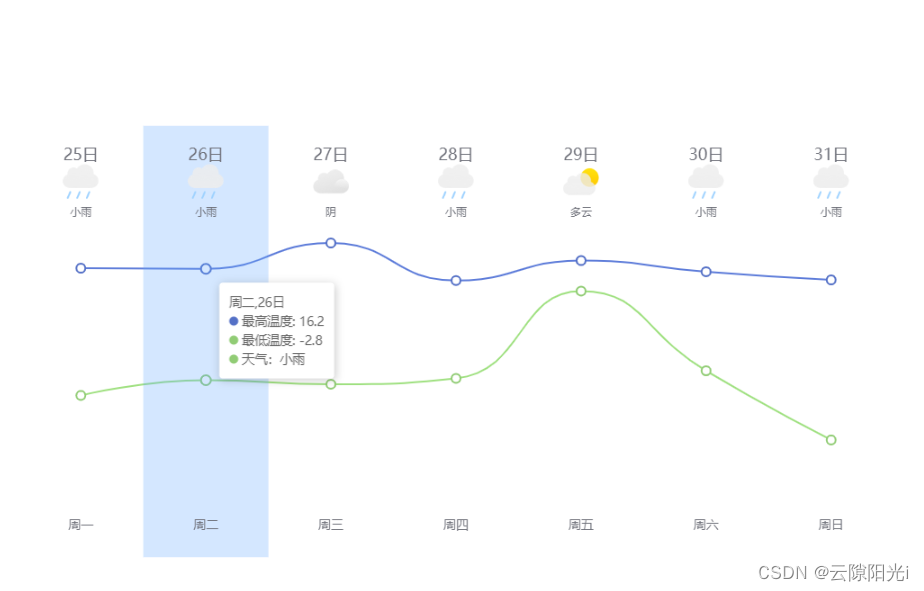
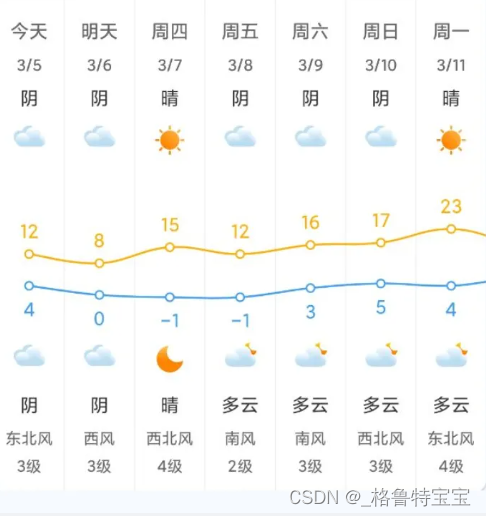
UI 设计图
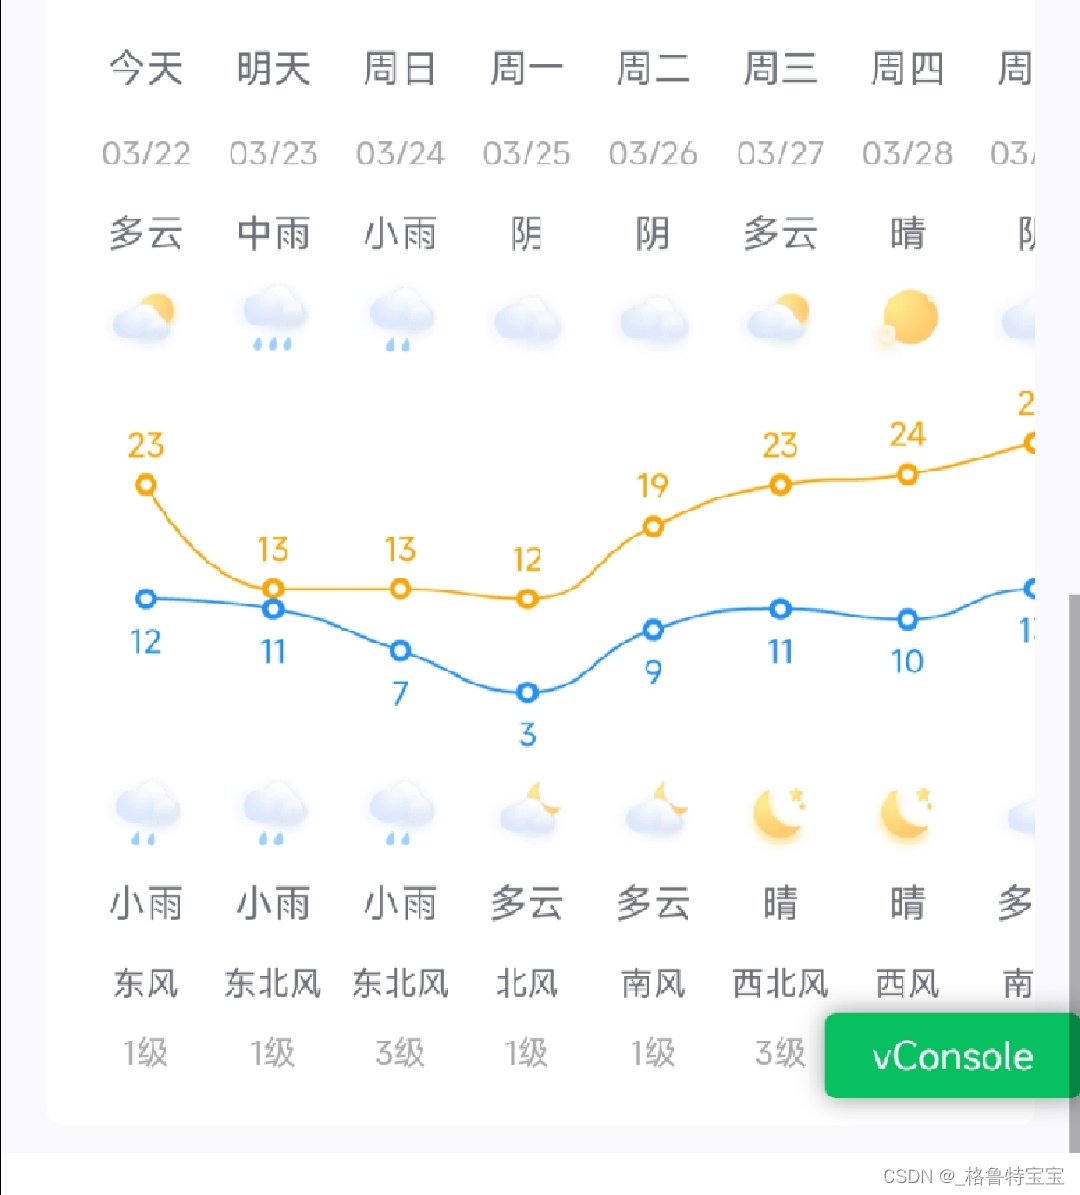
Echarts 实现效果
代码实现
代码分解
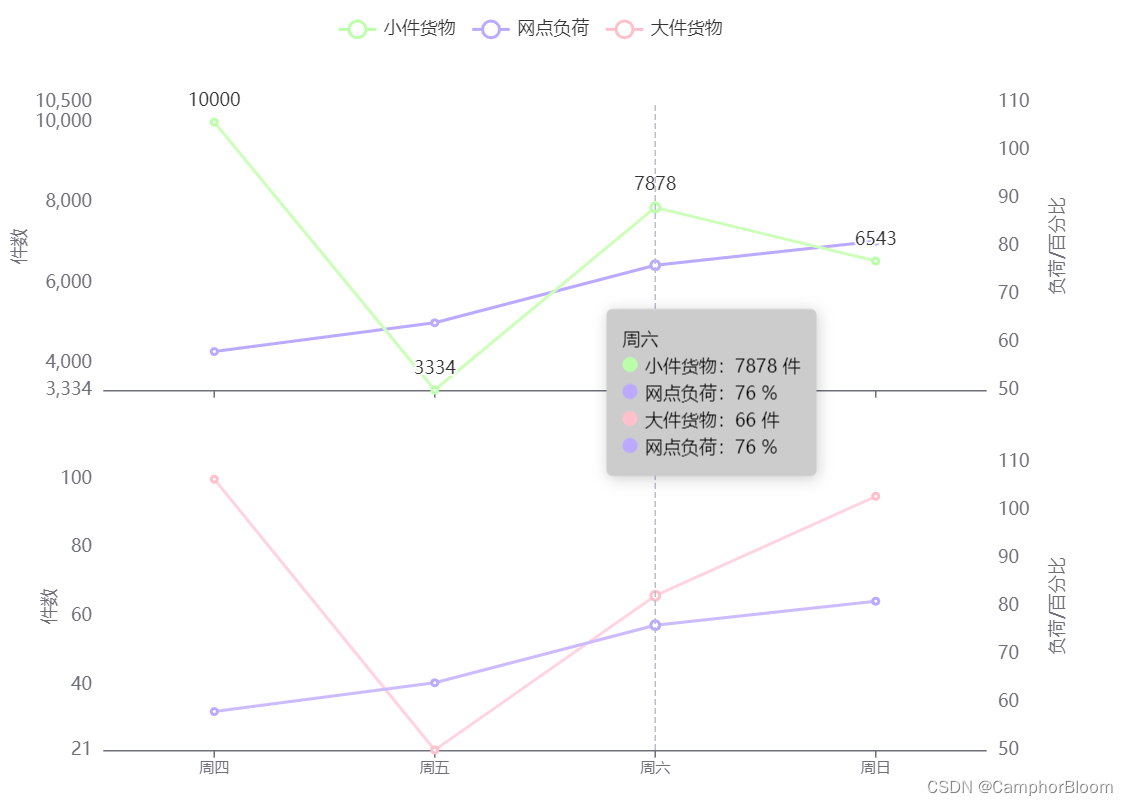
echarts 图表上下均显示数据
通过设置 grid.top 和 grid.bottom 设置白天和夜间天气展示区域
    grid: {
      top: '36%',
      bottom: '36%',
      left: '5%',
      right: '5%'
    },
天气图标的设置
由于 axisLabel 的 formatter 方法中的 value 值没法在富文本中使用,所以这里在formatter方法中将 value 的下标设置成了富文本中的 css 名,然后在设置天气图标时使用下标获取需要显示的图标名称。
    axisLabel: {
      interval: 0,
      formatter: function (value) {
        return `{icon${value}|}`
      },
      //预留rich对象
      rich: {}
    },
for (let i = 0; i < globalData.option.xAxis[xIndex].data.length; i++) {
const element = globalData.option.xAxis[xIndex].data[i];
globalData.option.xAxis[xIndex].axisLabel.rich[`icon${element}`] = {
backgroundColor: {
// image: `/assets/images/weather/W${element}.png`
image: getWeatherIcon(element)
},
width: 30,
align: 'center',
height: 30
}
}注: image: `/assets/images/weather/W${element}.png`
此链接也可以实现图片展示,但是Vite 打包之后会提示找不到图片资源,所以需要配合以下代码实现图片动态对应展示
天气图标动态导入
const getWeatherIcon = (iconId) => {
  return new URL(`/assets/images/weather/W${iconId}@3x.png`, import.meta.url).href;
}
图表数据置空
      for (let i = 0; i < globalData.option.xAxis.length; i++) {
        globalData.option.xAxis[i].data.length = 0
      }
      for (let i = 0; i < globalData.option.series.length; i++) {
        globalData.option.series[i].data.length = 0
      }
全量代码
以下代码可以贴入 Echarts 直接运行:
  option: {
    grid: {
      show: true,
      backgroundColor: 'transparent',
      opacity: 0.3,
      borderWidth: '0',
      top: '36%',
      bottom: '36%',
      left: '5%',
      right: '5%'
    },
    tooltip: {
      trigger: 'axis'
    },
    legend: {
      show: false
    },
    xAxis: [
      // 星期
      {
        name: '星期',
        nameTextStyle: {
          fontSize: 0,
        },
        type: 'category',
        boundaryGap: false,
        position: 'top',
        offset: 110,
        zlevel: 100,
        axisLine: {
          show: false
        },
        axisTick: {
          show: false
        },
        axisLabel: {
          interval: 0,
          formatter: [
            '{a|{value}}'
          ].join('\n'),
          rich: {
            a: {
              // color: 'white',
              fontSize: 14
            }
          }
        },
        data: new Array(15).fill(null)
      },
      // 日期
      {
        name: '日期',
        nameTextStyle: {
          fontSize: 0,
        },
        type: 'category',
        boundaryGap: false,
        position: 'top',
        offset: 80,
        zlevel: 100,
        axisLine: {
          show: false
        },
        axisTick: {
          show: false
        },
        axisLabel: {
          interval: 0,
          formatter: [
            '{a|{value}}'
          ].join('\n'),
          rich: {
            a: {
              color: '#aaa',
              fontSize: 12
            }
          }
        },
        data: new Array(15).fill(null)
      },
      // 白天天气
      {
        name: '白天天气',
        nameTextStyle: {
          fontSize: 0,
        },
        type: 'category',
        boundaryGap: false,
        position: 'top',
        offset: 50,
        zlevel: 100,
        axisLine: {
          show: false
        },
        axisTick: {
          show: false
        },
        axisLabel: {
          interval: 0,
          formatter: [
            '{a|{value}}'
          ].join('\n'),
          rich: {
            a: {
              // color: 'white',
              fontSize: 14
            }
          }
        },
        data: new Array(15).fill(null)
      },
      // 白天图标
      {
        name: '白天图标',
        nameTextStyle: {
          fontSize: 0,
        },
        type: 'category',
        boundaryGap: false,
        position: 'top',
        offset: 10,
        zlevel: 100,
        axisLine: {
          show: false
        },
        axisTick: {
          show: false
        },
        axisLabel: {
          interval: 0,
          formatter: function (value) {
            return `{icon${value}|}`
          },
          //预留rich对象
          rich: {}
        },
        // data: this.weatherdata.weather
        data: new Array(15).fill(null)
      },
      // 夜间图标
      {
        name: '夜间图标',
        nameTextStyle: {
          fontSize: 0,
        },
        type: 'category',
        boundaryGap: false,
        position: 'bottom',
        offset: 10,
        zlevel: 100,
        axisLine: {
          show: false
        },
        axisTick: {
          show: false
        },
        axisLabel: {
          interval: 0,
          formatter: function (value) {
            return `{icon${value}|}`
          },
          //预留rich对象
          rich: {}
        },
        // data: this.weatherdata.weather
        data: new Array(15).fill(null)
      },
      // 夜间天气
      {
        name: '夜间天气',
        nameTextStyle: {
          fontSize: 0,
        },
        type: 'category',
        boundaryGap: false,
        position: 'bottom',
        offset: 50,
        zlevel: 100,
        axisLine: {
          show: false
        },
        axisTick: {
          show: false
        },
        axisLabel: {
          interval: 0,
          formatter: [
            '{a|{value}}'
          ].join('\n'),
          rich: {
            a: {
              // color: 'white',
              fontSize: 14
            }
          }
        },
        data: new Array(15).fill(null)
      },
      // 风向
      {
        name: '风向',
        nameTextStyle: {
          fontSize: 0,
        },
        type: 'category',
        boundaryGap: false,
        position: 'bottom',
        offset: 80,
        zlevel: 100,
        axisLine: {
          show: false
        },
        axisTick: {
          show: false
        },
        axisLabel: {
          interval: 0,
          formatter: [
            '{a|{value}}'
          ].join('\n'),
          rich: {
            a: {
              // color: 'white',
              fontSize: 12
            }
          }
        },
        data: new Array(15).fill(null)
      },
      // 风级
      {
        name: '风级',
        nameTextStyle: {
          fontSize: 0,
        },
        type: 'category',
        boundaryGap: false,
        position: 'bottom',
        offset: 105,
        zlevel: 100,
        axisLine: {
          show: false
        },
        axisTick: {
          show: false
        },
        axisLabel: {
          interval: 0,
          formatter: [
            '{a|{value}级}'
          ].join('\n'),
          rich: {
            a: {
              color: '#aaa',
              fontSize: 12
            }
          }
        },
        data: new Array(15).fill(null)
      },
    ],
    yAxis: {
      type: 'value',
      show: false,
      axisLabel: {
        formatter: '{value} °C',
        color: 'white'
      }
    },
    series: [
      {
        name: '最高气温',
        type: 'line',
        data: new Array(15).fill(0),
        symbol: 'emptyCircle',
        symbolSize: 6,
        showSymbol: true,
        smooth: true,
        itemStyle: {
          color: 'orange'
        },
        label: {
          show: true,
          position: 'top',
          color: 'orange',
          formatter: '{c}'
        },
        lineStyle: {
          width: 1,
        },
        areaStyle: {
          opacity: 1,
          color: 'transparent'
        }
      },
      {
        name: '最低气温',
        type: 'line',
        data: new Array(15).fill(0),
        symbol: 'emptyCircle',
        symbolSize: 6,
        showSymbol: true,
        smooth: true,
        itemStyle: {
          color: 'dodgerblue'
        },
        label: {
          show: true,
          position: 'bottom',
          color: 'dodgerblue',
          formatter: '{c}'
        },
        lineStyle: {
          width: 1,
        },
        areaStyle: {
          opacity: 1,
          color: 'transparent'
        }
      },
    ]
  },