GPT-4 Vision 系列:
- 翻译: GPT-4 with Vision 升级 Streamlit 应用程序的 7 种方式一
- 翻译: GPT-4 with Vision 升级 Streamlit 应用程序的 7 种方式二
- 翻译: GPT-4 Vision静态图表转换为动态数据可视化 升级Streamlit 三
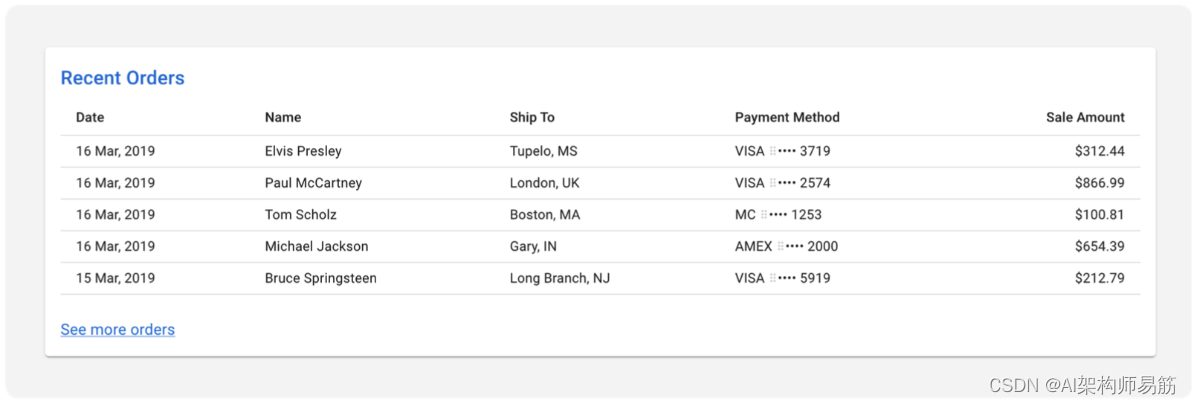
当您需要从不可复制或不可下载的表中提取数据时,ChatGPT Vision 也非常有用。
在此示例中,我们将要求 Vision 使用 Streamlit 的数据编辑器使此表格数据图像完全可编辑。
将 ReactJS 表的这张图片粘贴 到 ChatGPT 中:
包括以下提示prompt:
Code this table in Streamlit. We want the tabular data fully editable via Streamlit’s data editor.
在 Streamlit 中对此表进行编码。我们希望表格数据可以通过 Streamlit 的数据编辑器完全编辑。
将代码粘贴到编辑器中并查看结果:

GPT-4 Vision 碾压了它!该表功能齐全,标题正确,每一行都完美复制,数据完全可编辑。作为额外的奖励,ChatGPT 包括一个功能,可以找到最高销售金额并显示相关订单!
2. GPT-4生成表格
要在Streamlit中创建一个可编辑的表格,您可以使用st.dataframe,这样用户就可以直接编辑表格中呈现的数据。以下是一个示例代码片段,根据您上传的图像信息在Streamlit中创建一个可编辑的表格:
import streamlit as st
import pandas as pd

# Sample data to populate the table.
# In a real application, this data might come from a database or user input.
data = {

    "Date": ["16 Mar, 2019", "16 Mar, 2019", "16 Mar, 2019", "16 Mar, 2019", "15 Mar, 2019"],
    "Name": ["Elvis Presley", "Paul McCartney", "Tom Scholz", "Michael Jackson", "Bruce Springsteen"],
    "Ship To": ["Tupelo, MS", "London, UK", "Boston, MA", "Gary, IN", "Long Branch, NJ"],
    "Payment Method": ["VISA **** 3719", "VISA **** 2574", "MC **** 1253", "AMEX **** 2000", "VISA **** 5919"],
    "Sale Amount": [312.44, 866.99, 100.81, 654.39, 212.79]
}

# Convert the data to a pandas DataFrame
df = pd.DataFrame(data)

# Title for the orders table
st.header("Recent Orders")

# Display the editable dataframe
df = st.dataframe(df)

# You can add functionality to update the DataFrame here
# For example, if you want to save the changes made by the user to the DataFrame, you can do so.
# This will typically involve writing the updated DataFrame back to a file or database.

# Button to see more orders
if st.button('See more orders'):
    # Here you can add logic to load or display more orders.
    st.write("More orders to be implemented...")
当您运行这个Streamlit应用程序时,它会显示一个包含提供的数据的表格。用户可以点击单元格并编辑内容。st.dataframe函数会自动允许这种交互。请注意,默认情况下,除非您添加后端逻辑将更新的数据存储在持久存储中,比如数据库或文件,否则这些更改在重新运行或刷新应用程序后不会持久保存。

要保存对数据框所做的更改,您需要捕获编辑后的数据框并将其写入您的存储系统。上面的示例不包括持久存储集成,这对于完全功能的数据编辑应用程序是必要的。
要运行此应用程序,请将代码保存在一个Python文件中(例如editable_table.py),然后使用Streamlit执行它:
streamlit run Vision/editable_table.py
记得调整按钮功能,以适应您的应用程序应该加载或显示更多订单的方式。
3. GPT-4 基于上面的表格,完善成可以编辑的表格
prompt
表格是出来了,但是表格不可以在线编辑,请完善代码
截至我在2023年4月的最后更新,Streamlit的内置st.dataframe函数提供了一种不是固有可编辑的数据显示。要在Streamlit中创建可编辑表格,通常需要使用诸如st.text_input之类的输入元素的组合,对于大型表格来说可能会很麻烦,或者使用streamlit-aggrid之类的第三方组件,该组件提供了增强功能,包括可编辑表格。
以下是一个使用streamlit-aggrid在Streamlit中创建可编辑表格的示例,它提供了更类似于Excel的界面:
首先,您需要安装streamlit-aggrid包:
pip install streamlit-aggrid
然后,这是您可能如何设置您的Streamlit应用程序:
import streamlit as st
from st_aggrid import AgGrid, GridOptionsBuilder, GridUpdateMode, DataReturnMode
import pandas as pd

# Sample data for the table
data = {

    "Date": ["16 Mar, 2019", "16 Mar, 2019", "16 Mar, 2019", "16 Mar, 2019", "15 Mar, 2019"],
    "Name": ["Elvis Presley", "Paul McCartney", "Tom Scholz", "Michael Jackson", "Bruce Springsteen"],
    "Ship To": ["Tupelo, MS", "London, UK", "Boston, MA", "Gary, IN", "Long Branch, NJ"],
    "Payment Method": ["VISA **** 3719", "VISA **** 2574", "MC **** 1253", "AMEX **** 2000", "VISA **** 5919"],
    "Sale Amount": [312.44, 866.99, 100.81, 654.39, 212.79]
}
df = pd.DataFrame(data)

# Ag-Grid options
gb = GridOptionsBuilder.from_dataframe(df)
gb.configure_grid_options(enableRangeSelection=True)
grid_options = gb.build()

# Enable various features like adding, deleting, and editing rows.
gb.configure_default_column(editable=True, groupable=True)

# Create Ag-Grid component
response = AgGrid(
    df,
    gridOptions=grid_options,
    height=200,
    width='100%',
    data_return_mode=DataReturnMode.AS_INPUT,  # Return data as input (for edits)
    update_mode=GridUpdateMode.MODEL_CHANGED,  # Update mode for cell edits
    editable=True,  # Enable editing
)

# The response['data'] will hold the dataframe with the edited values.
updated_df = response['data']

# Display the updated DataFrame
st.write('Updated Dataframe:')
st.dataframe(updated_df)

# Button to see more orders
if st.button('See more orders'):
    # Here you can add logic to load or display more orders.
    st.write("More orders to be implemented...")
这段代码将使用AgGrid组件将DataFrame显示为可编辑表格。用户可以直接在表格中编辑数值。一旦他们这样做了,response['data']将保存更新后的DataFrame,然后您可以根据需要处理或存储它。
请记住,对更改的持久存储需要与后端服务或数据库集成,这不包括在上面的示例中。另外,“查看更多订单”按钮是一个占位符,应该链接到实际逻辑以加载更多数据。
要运行此应用程序,请将代码保存在Python文件中(例如,editable_aggrid.py),并使用Streamlit执行它:
streamlit run editable_aggrid.py
代码
https://github.com/zgpeace/pets-name-langchain/tree/develop
参考
https://blog.streamlit.io/7-ways-gpt-4-vision-can-uplevel-your-streamlit-apps/


![如何用一根网线和51单片机做简单门禁[带破解器]](https://img-blog.csdnimg.cn/img_convert/7546d738ed329e018cd87fd287559f11.jpeg)