GPT-4 Vision 系列:
GPT-4 Vision 的 7 个实际用例
Pre-requisites:先决条件:
- 订阅 ChatGPT Plus 以访问 GPT-4 Vision。
- 如果您不熟悉 Streamlit,请按照安装步骤操作。
1. 绘制您的应用程序并观看它栩栩如生
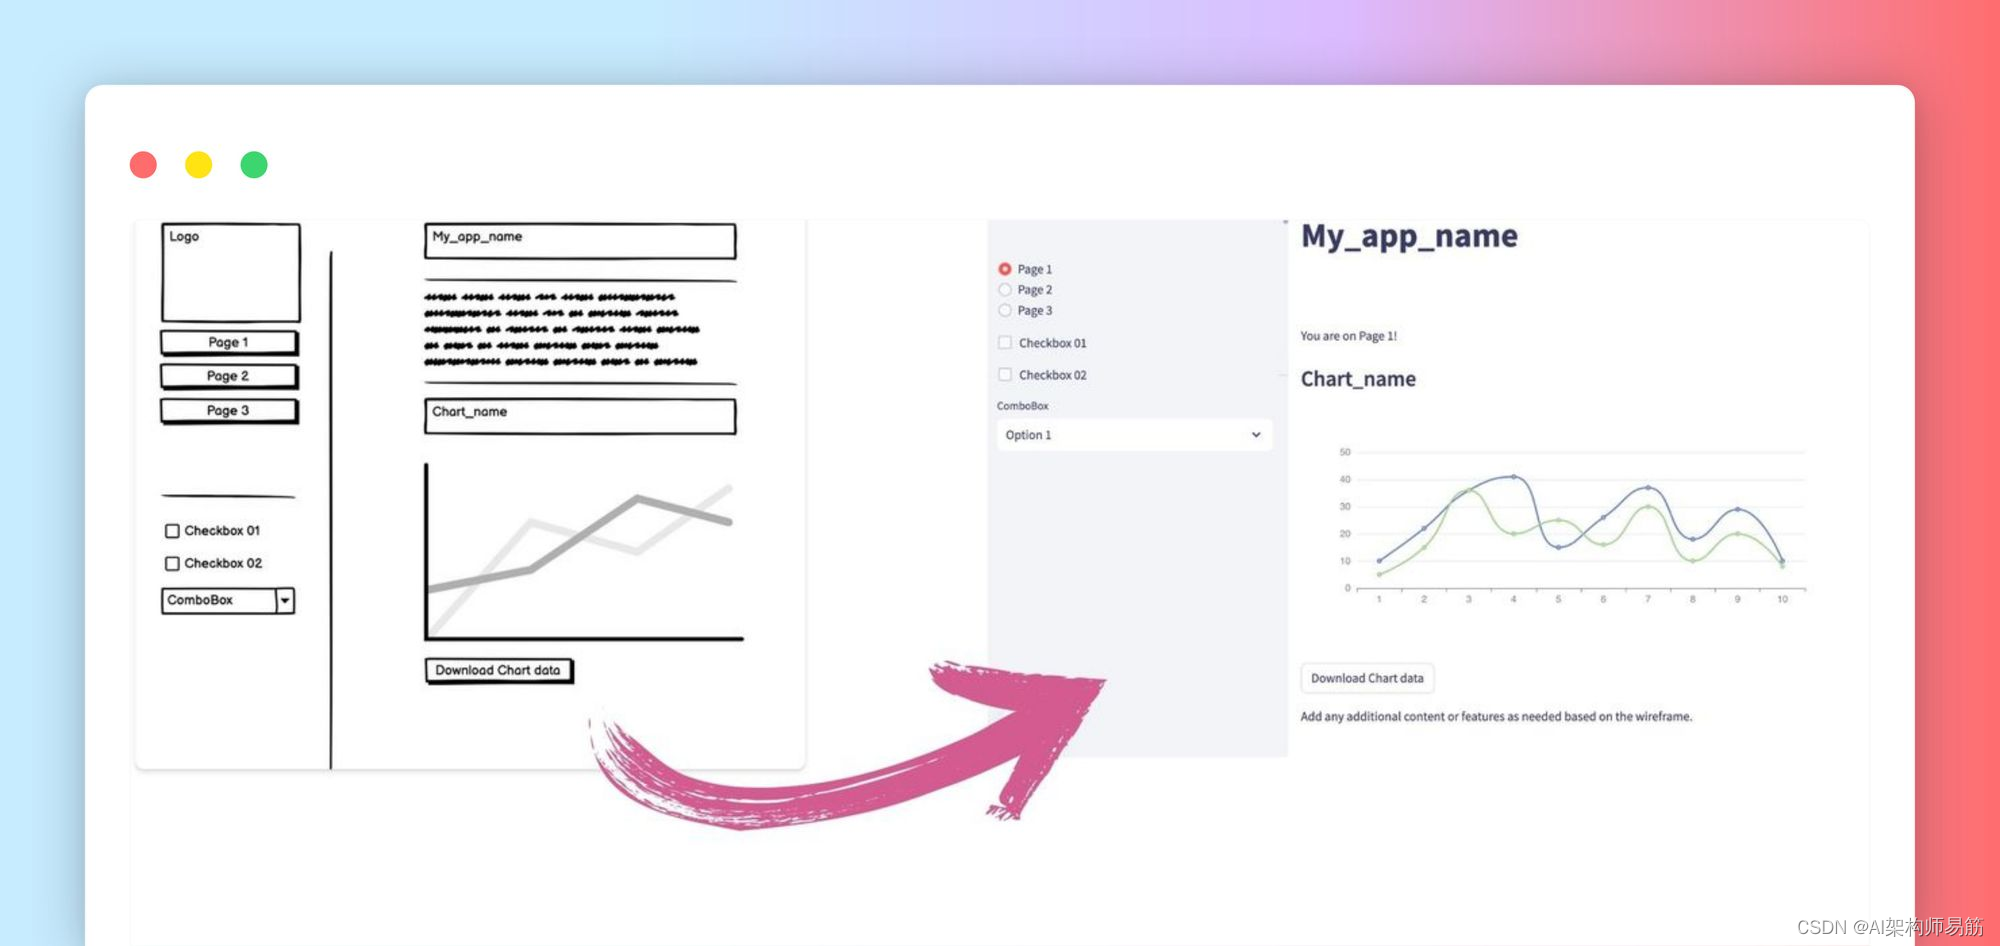
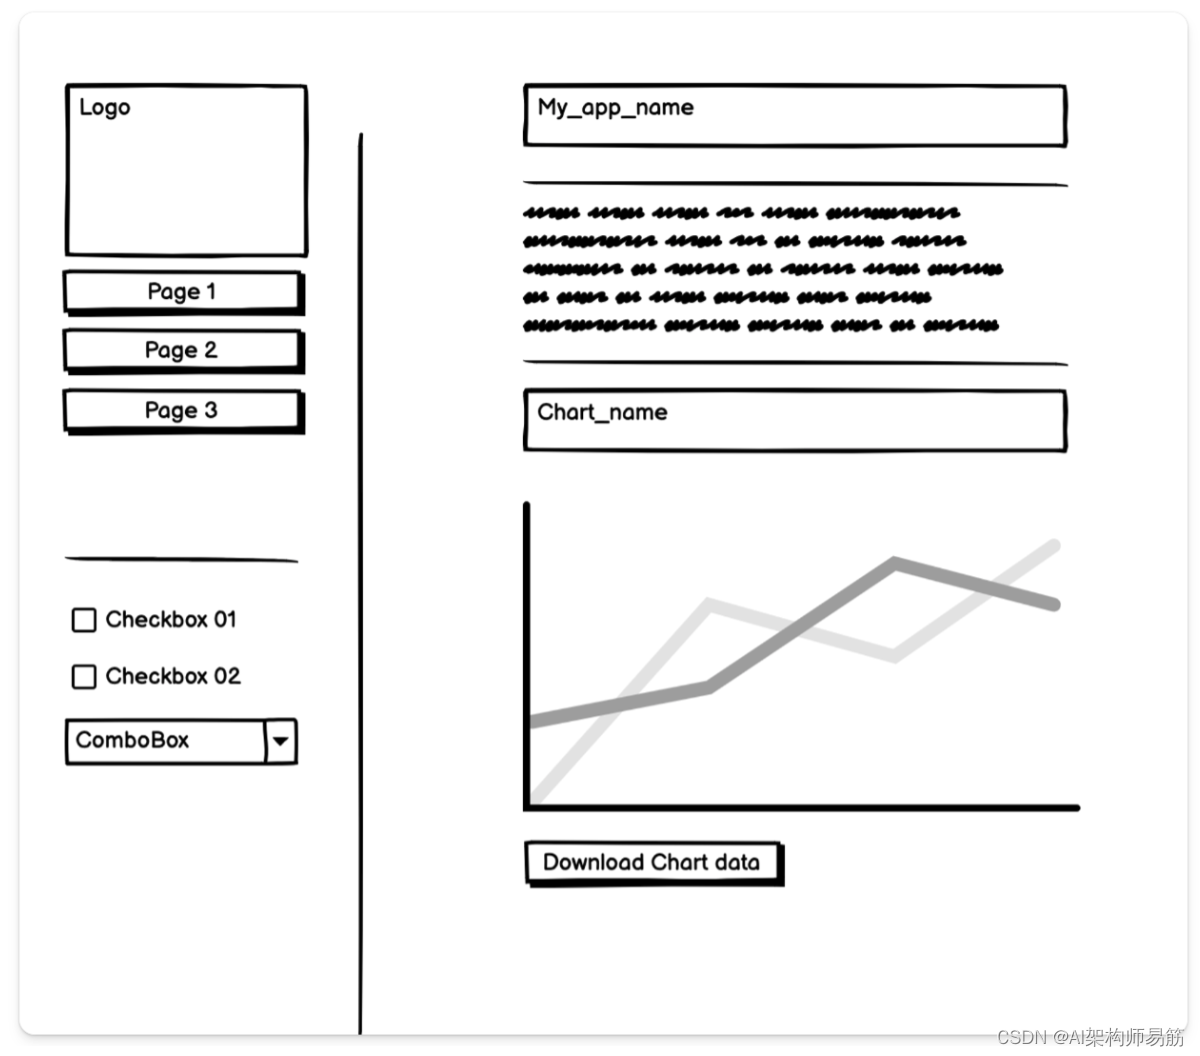
…由于我的绘画技巧堪比追逐激光笔的猫,我将使用 Balsamiq 来实现手绘模型的感觉。
此模型由一个双面板 UI 组成。左侧面板包括一个徽标、三个导航链接、两个复选框和一个下拉列表。右侧面板显示应用名称、文本区域、两个折线图和一个“下载图表数据”按钮:
将此模型图像粘贴到 ChatGPT 界面中:
包括以下提示词prompt:
Create a Streamlit app from this mock-up. You will use the Echarts library.
翻译 prompt:
从此模型创建 Streamlit 应用程序。您将使用 Echarts 库。
提示
最好指定要使用的数据可视化效果。如果未指定,则默认值为 matplotlib。
每个数据可视化库都必须通过以下方式安装pip install到您的虚拟环境中即可工作。
检查结果:
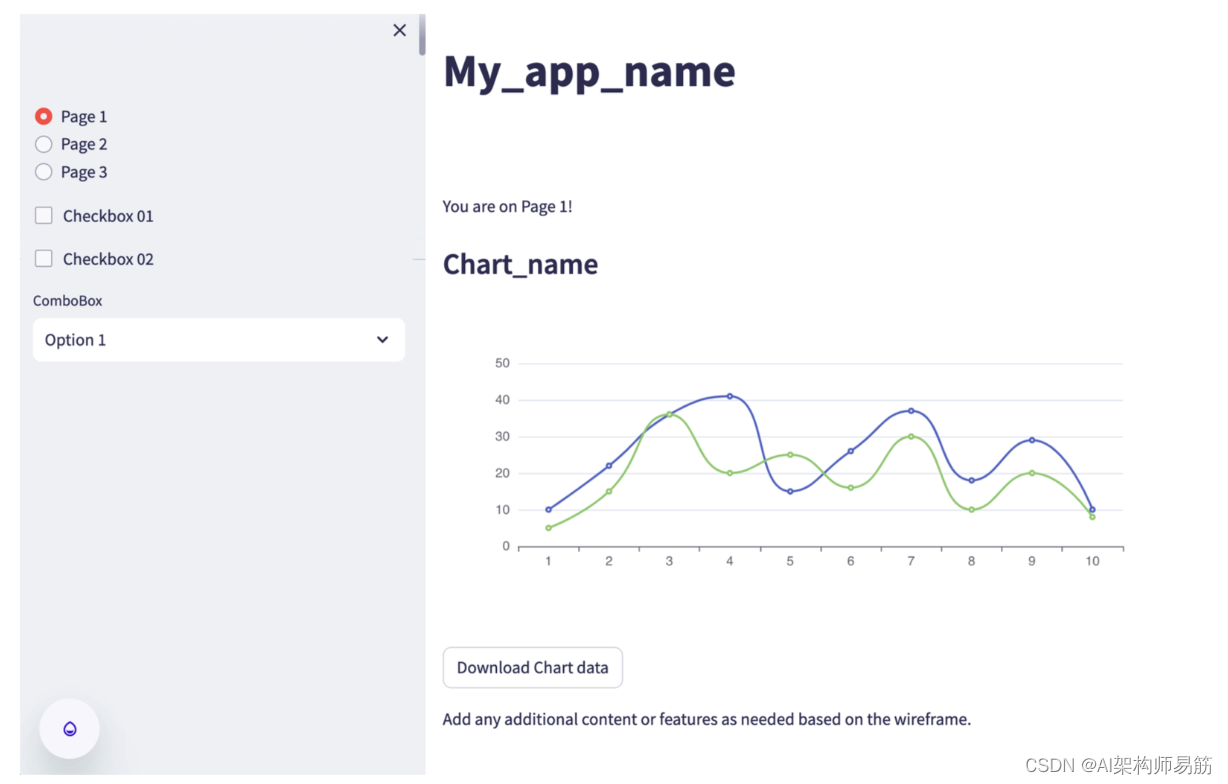
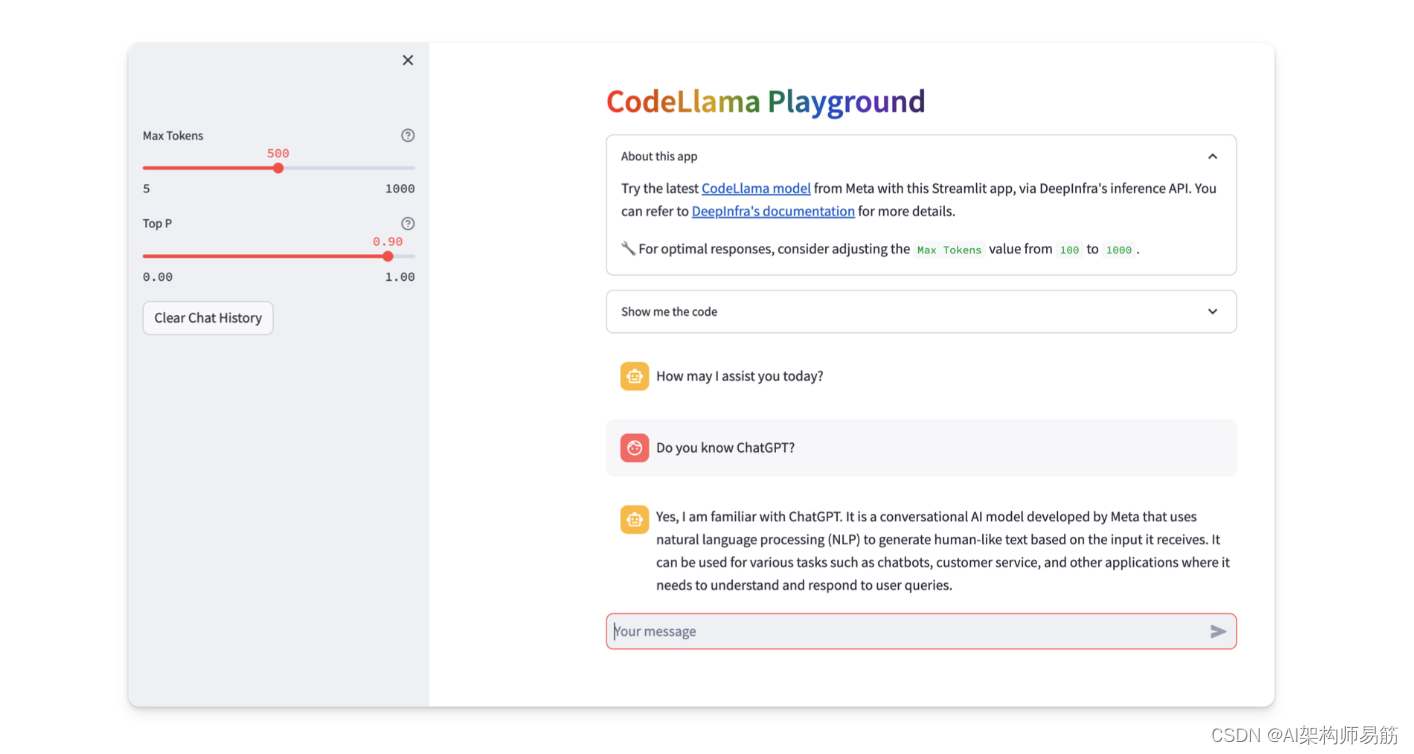
通过简单地上传一个模型,Vision 生成了一个功能齐全的 Streamlit 原型:一个带有徽标占位符、导航链接、复选框、组合框、一些文本、图表和下载按钮的应用程序。🙌
GPT-4 生成代码如下
使用Echarts库基于提供的草图创建一个Streamlit应用程序,您需要设置布局和组件以匹配设计。以下是与草图对应的Streamlit代码的概念大纲:
首先,确保您已安装必要的库:
pip install streamlit streamlit_echarts pandas
然后,你可以这样编写Streamlit应用程序:
import streamlit as st
from streamlit_echarts import st_echarts
import pandas as pd
import numpy as np

# Set up the page layout
st.set_page_config(layout="wide")

# Assuming logo.png is the logo file in the same directory as the script
logo = './logo.png'

# Sidebar with logo and navigation
# st.sidebar.image(logo, use_column_width=True)
st.sidebar.button('Page 1')
st.sidebar.button('Page 2')
st.sidebar.button('Page 3')
st.sidebar.checkbox('Checkbox 01')
st.sidebar.checkbox('Checkbox 02')
st.sidebar.selectbox('ComboBox', ['Option 1', 'Option 2', 'Option 3'])

# Main page layout
col1, col2 = st.columns([1, 3])

# Dummy data for the chart
data = pd.DataFrame({

    'Series 1': np.random.rand(10),
    'Series 2': np.random.rand(10)
})

# Echart line chart
options = {

    "xAxis": {

        "type": 'category',
        "data": list(data.index)
    },
    "yAxis": {

        "type": 'value'
    },
    "series": [{

        "data": list(data['Series 1']),
        "type": 'line',
        "smooth": True
    },{

        "data": list(data['Series 2']),
        "type": 'line',
        "smooth": True
    }]
}

# Render the Echarts line chart in the main column
with col2:
    st.markdown("### Chart_name")
    st_echarts(options=options, height="400px")

    # Button to download data
    if st.button('Download Chart Data'):
        # This will download the data as a CSV file
        st.download_button(
            label="Download data as CSV",
            data=data.to_csv().encode('utf-8'),
            file_name='chart_data.csv',
            mime='text/csv',
        )

# Text and other elements would go here
with col1:
    st.markdown("## My_app_name")
    st.markdown("""
        Lorem ipsum dolor sit amet, consectetur adipiscing elit.
        Quisque varius eros ac purus dignissim.
    """)
要运行这个应用程序,将代码保存在一个Python文件中(例如,sketch_app.py),然后使用Streamlit执行它:
streamlit run Vision/sketch_app.py
这段代码将创建一个具有以下功能的Streamlit应用程序:
- 侧边栏带有用于logo、导航按钮、复选框和组合框的占位符。
- 主区域带有标题、一些占位文本和Echarts折线图。
- 一个按钮,用于将图表数据下载为CSV文件。
请用实际内容替换占位数据、图表选项和文本。如果需要进一步自定义外观和感觉或添加额外功能,您可以相应地修改代码。
代码
https://github.com/zgpeace/pets-name-langchain/tree/develop
参考
https://blog.streamlit.io/7-ways-gpt-4-vision-can-uplevel-your-streamlit-apps/