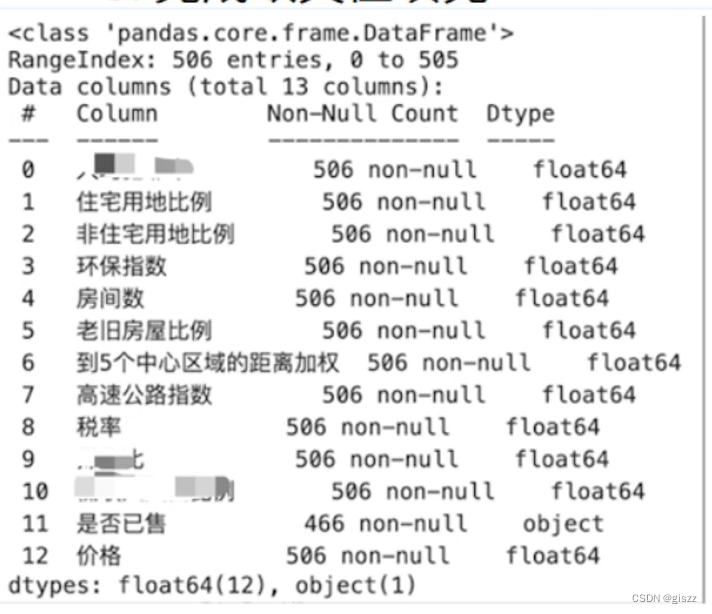
“Data” in machine learning can be almost anything you can imagine. A table of big Excel spreadsheet, images, videos, audio files, text and more.
机器学习其实可以分为两部分
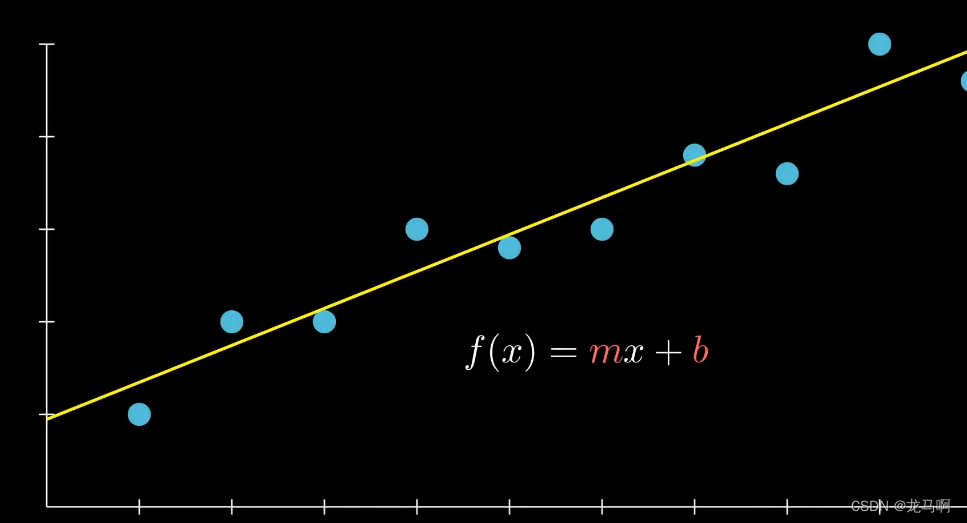
- 将不管是什么data,都转成numbers.
- 挑选或者建立一个模型来学习这些numbers as best as possible.
下面是代码展示,创建一个straight line data
import torch
from torch import nn  # nn: neural networks. This package contains the building blocks for creating neural networks
import matplotlib.pyplot as plt

# Create linear regression parameters
weight = 0.7
bias = 0.3

# Create data
start = 0
end = 1
step = 0.02
X = torch.arange(start, end, step).unsqueeze(dim=1)  # X is features
y = weight * X + bias   # y is labels
print(X[:10])
print(y[:10])

# 结果如下
tensor([[0.0000],
        [0.0200],
        [0.0400],
        [0.0600],
        [0.0800],
        [0.1000],
        [0.1200],
        [0.1400],
        [0.1600],
        [0.1800]])
tensor([[0.3000],
        [0.3140],
        [0.3280],
        [0.3420],
        [0.3560],
        [0.3700],
        [0.3840],
        [0.3980],
        [0.4120],
        [0.4260]])
将上面获取到的数据进行拆分,每部分数据带有不同的意思。
| Split | Purpose | Amount of total data | How often is it used? |
|---|---|---|---|
| Training set | The model learns from this data (like the course materials you study during the semester) | ~60-80% | Always |
| Validation set | The model gets tuned on this data (like the practice exam you take before the final exam). | ~10-20% | Often but not always |
| Testing set | The model gets evaluated on this data to test what it has leanred (like the final exam you take at the end of the semester). | ~10-20% | Always |
When dealing with real-world data, this step is typically done right at the start of a project (the test set should always be kept separate from all other data). Let the model learn on training data and then evaluate the model on test data to get an indication of how well it generalizes to unseen examples.
下面是代码。
# Create train/test split
train_split = int(0.8 * len(X))
X_train, y_train = X[:train_split], y[:train_split]
X_test, y_test = X[train_split:], y[train_split:]

# Learn the relationship between X_train and y_train
print(f"X_train length: {len(X_train)}")
print(f"y_train length: {len(y_train)}")
# Learn the relationship between X_test and y_test
print(f"X_test length: {len(X_test)}")
print(f"y_test length: {len(y_test)}")

# 输出如下
X_train length: 40
y_train length: 40
X_test length: 10
y_test length: 10
通过将各个数字显示出来,更直观
plt.figure(figsize=(10, 7))

# s 代表是散点的大小
plt.scatter(X_train, y_train, c="b", s=4, label="Training data")
plt.scatter(X_test, y_test, c="r", s=4, label="Testing data")

plt.legend(prop={"size": 14})
plt.show()

都看到这了,给个赞呗~


![[spring] Spring MVC - security(下)](https://img-blog.csdnimg.cn/direct/b434e2bc3c554e179c23e3e1ffbe3bd3.png)