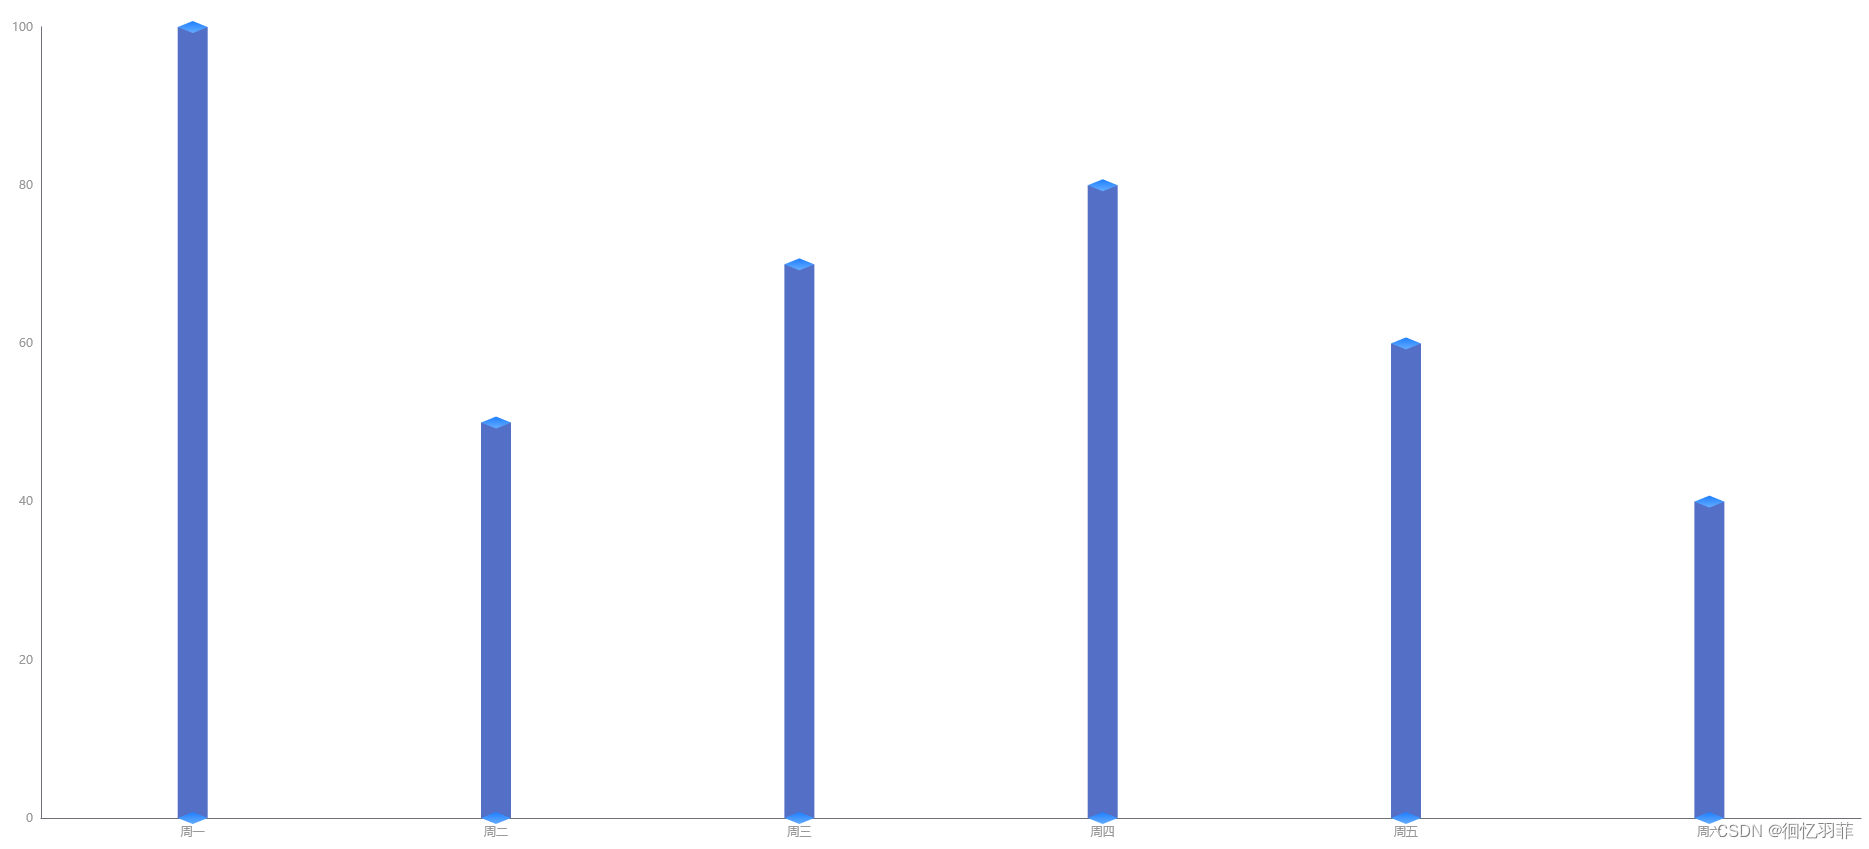
echarts使用自定义图形实现3D柱状图

先看下效果吧

custom3dBar

实现思路

  1. 使用graphic创建并注册自定义图形。根据每组的数据值,得到一个对应的点,从点出发用canvas绘制一组图形,分别为
    顶部的菱形
    top
    const CubeTop = echarts.graphic.extendShape({
      buildPath: function (ctx, shape) {
         const c1 = [shape.x, shape.y]; // 下
         const c2 = [shape.x + 9, shape.y - 7]; // 右
         const c3 = [shape.x, shape.y - 12]; // 上
         const c4 = [shape.x - 9, shape.y - 7]; // 左
         ctx
            .moveTo(c1[0], c1[1])
            .lineTo(c2[0], c2[1])
            .lineTo(c3[0], c3[1])
            .lineTo(c4[0], c4[1])
            .closePath();
      }
    });
    
    左侧的四边形 left
    const CubeLeft = echarts.graphic.extendShape({
       buildPath: function (ctx, shape) {
          const xAxisPoint = shape.xAxisPoint;
          const c0 = [shape.x, shape.y]; // 右上
          const c1 = [shape.x - 9, shape.y - 7]; //左上
          const c2 = [xAxisPoint[0] - 9, xAxisPoint[1] - 6]; // 左下
          const c3 = [xAxisPoint[0], xAxisPoint[1]]; // 右下
          ctx
              .moveTo(c0[0], c0[1])
              .lineTo(c1[0], c1[1])
              .lineTo(c2[0], c2[1])
              .lineTo(c3[0], c3[1])
              .closePath();
       }
    });
    
    右侧的四边形
    right
    const CubeRight = echarts.graphic.extendShape({
       buildPath: function (ctx, shape) {
          const xAxisPoint = shape.xAxisPoint;
          const c1 = [shape.x, shape.y]; // 左上
          const c2 = [xAxisPoint[0], xAxisPoint[1]]; // 左下
          const c3 = [xAxisPoint[0] + 9, xAxisPoint[1] - 7]; //右下
          const c4 = [shape.x + 9, shape.y - 7]; // 右上
          ctx
              .moveTo(c1[0], c1[1])
              .lineTo(c2[0], c2[1])
              .lineTo(c3[0], c3[1])
              .lineTo(c4[0], c4[1])
              .closePath();
      }
    });
    
  2. 用series自定义系列(custom)的renderItem将这一组图形元素返回,组合形成3D柱状图

代码实现

<template>
    <div id="graphicBar"></div>
</template>

<script setup>
    import {reactive, onMounted} from 'vue'
    import * as echarts from "echarts";
    const barData = reactive({
        xAxis: ['Mon', 'Tue', 'Wed', 'Thu', 'Fri', 'Sat', 'Sun'],
        data: [200, 180, 120, 220, 80, 160, 150]
    })
    const customShape = () => {
        // 创建自定义的shape类型
        const CubeLeft = echarts.graphic.extendShape({
            buildPath: function (ctx, shape) {
                const xAxisPoint = shape.xAxisPoint;
                const c0 = [shape.x, shape.y]; // 右上
                const c1 = [shape.x - 9, shape.y - 7]; //左上
                const c2 = [xAxisPoint[0] - 9, xAxisPoint[1] - 6]; // 左下
                const c3 = [xAxisPoint[0], xAxisPoint[1]]; // 右下
                ctx
                    .moveTo(c0[0], c0[1])
                    .lineTo(c1[0], c1[1])
                    .lineTo(c2[0], c2[1])
                    .lineTo(c3[0], c3[1])
                    .closePath();
            }
        });
        const CubeRight = echarts.graphic.extendShape({
            buildPath: function (ctx, shape) {
                const xAxisPoint = shape.xAxisPoint;
                const c1 = [shape.x, shape.y]; // 左上
                const c2 = [xAxisPoint[0], xAxisPoint[1]]; // 左下
                const c3 = [xAxisPoint[0] + 9, xAxisPoint[1] - 7]; //右下
                const c4 = [shape.x + 9, shape.y - 7]; // 右上
                ctx
                    .moveTo(c1[0], c1[1])
                    .lineTo(c2[0], c2[1])
                    .lineTo(c3[0], c3[1])
                    .lineTo(c4[0], c4[1])
                    .closePath();
            }
        });
        const CubeTop = echarts.graphic.extendShape({
            buildPath: function (ctx, shape) {
                const c1 = [shape.x, shape.y]; // 下
                const c2 = [shape.x + 9, shape.y - 7]; // 右
                const c3 = [shape.x, shape.y - 12]; // 上
                const c4 = [shape.x - 9, shape.y - 7]; // 左
                ctx
                    .moveTo(c1[0], c1[1])
                    .lineTo(c2[0], c2[1])
                    .lineTo(c3[0], c3[1])
                    .lineTo(c4[0], c4[1])
                    .closePath();
            }
        });
        // 注册创建的自定义的shape类型
        echarts.graphic.registerShape('CubeLeft', CubeLeft);
        echarts.graphic.registerShape('CubeRight', CubeRight);
        echarts.graphic.registerShape('CubeTop', CubeTop);
    }
    const draw_bar = () => {
        customShape()
        const option = {
            xAxis: {
                data: barData.xAxis,
                axisLabel: {
                    fontSize: 12,
                    color: '#FFFFFF'
                },
                axisLine: {
                    lineStyle: {
                        color: '#3A4547',
                    }
                },
                axisTick: {
                    show: false
                }
            },
            yAxis: {
                type: 'value',
                axisLabel: {
                    fontSize: 12,
                    color: '#A8B5C1'
                },
                splitLine: {
                    lineStyle: {
                        color: ['#303638'],
                        type: 'dashed'
                    }
                }
            },
            grid: {
                containLabel: true,
                top: 10,
                bottom: 0,
                right: 0,
                left: 0
            },
            series: [        
                {
                    type: 'custom',
                    renderItem: (params, api) => {
                        // coord 将数据值映射到坐标系上
                        // api.value 给定维度的数据值
                        const location = api.coord([api.value(0), api.value(1)]);
                        return {
                            type: 'group',
                            children: [
                                {
                                    type: 'CubeLeft',
                                    shape: {
                                        api,
                                        x: location[0], // 图形元素的右上角在父节点坐标系中的横坐标值
                                        y: location[1], // 图形元素的右上角在父节点坐标系中的纵坐标值
                                        xAxisPoint: api.coord([api.value(0), 0]) // 图形元素的右下角在父节点坐标系中的坐标值
                                    },
                                    style: {
                                        // 渐变色填充
                                        fill: new echarts.graphic.LinearGradient(0, 0, 0, 1, [
                                            {
                                                offset: 0,
                                                color: 'rgba(35, 153, 254, 1)'
                                            },
                                            {
                                                offset: 1,
                                                color: 'rgba(70, 207, 255, 1)'
                                            },
                                        ])
                                    }
                                },
                                {
                                    type: 'CubeRight',
                                    shape: {
                                        api,
                                        x: location[0], // 中间上的x
                                        y: location[1], // 中间上的y
                                        xAxisPoint: api.coord([api.value(0), 0]) // 中间下
                                    },
                                    style: {
                                        fill: new echarts.graphic.LinearGradient(0, 0, 0, 1, [
                                            {
                                                offset: 0,
                                                color: 'rgba(32, 147, 255, 1)'
                                            },
                                            {
                                                offset: 1,
                                                color: 'rgba(71, 237, 255, 1)'
                                            },
                                        ])
                                    }
                                },
                                {
                                    type: 'CubeTop',
                                    shape: {
                                        api,
                                        x: location[0],
                                        y: location[1],
                                    },
                                    style: {
                                        fill: new echarts.graphic.LinearGradient(0, 0, 0, 1, [
                                            {
                                                offset: 0,
                                                color: 'rgba(107, 230, 254, 1)'
                                            },
                                            {
                                                offset: 1,
                                                color: 'rgba(48, 211, 255, 1)'
                                            }
                                        ])
                                    }
                                }
                            ]
                        };
                    },
                    data: barData.data
                }
            ]
        };
        return option
    }
    const chart_init = () => {
        let curChart = echarts.init(document.getElementById('graphicBar'))
        const exampleOption = draw_bar()
        curChart.setOption(exampleOption);
    }
    onMounted(() => {
        chart_init()
    })
</script>

<style scoped>
    #graphicBar{
        width: 460px;
        height: 300px;
    }
</style>

补充说明

  1. 以上内容是vite构建的vue3项目
  2. echarts版本5.5.1

相关推荐

最近更新

  1. docker php8.1+nginx base 镜像 dockerfile 配置

    2024-07-11 20:40:05       67 阅读
  2. Could not load dynamic library ‘cudart64_100.dll‘

    2024-07-11 20:40:05       72 阅读
  3. 在Django里面运行非项目文件

    2024-07-11 20:40:05       58 阅读
  4. Python语言-面向对象

    2024-07-11 20:40:05       69 阅读

热门阅读

  1. vue2 使用 Socket.io 实现 WebSocket

    2024-07-11 20:40:05       23 阅读
  2. flink 大数据处理资源分配

    2024-07-11 20:40:05       19 阅读
  3. LiteOS GPIO中断处理

    2024-07-11 20:40:05       20 阅读
  4. python如何与前端交互

    2024-07-11 20:40:05       16 阅读
  5. 模型需要从txt中长文本中精准提炼出来文字

    2024-07-11 20:40:05       22 阅读
  6. vue3 学习笔记04 -- axios的使用及封装

    2024-07-11 20:40:05       24 阅读
  7. 大模型融入云平台,信息化走向数智化

    2024-07-11 20:40:05       20 阅读
  8. 开源项目有哪些机遇与挑战?

    2024-07-11 20:40:05       22 阅读