echart用自定义图片填充柱状图
关键代码 type: 'pictorialBar'
加记得加image://或者直接使用bas64格式图片
const testIcon = "image://"+require('@/assets/test.svg')
svg图片
<?xml version="1.0" standalone="no"?><!DOCTYPE svg PUBLIC "-//W3C//DTD SVG 1.1//EN" "http://www.w3.org/Graphics/SVG/1.1/DTD/svg11.dtd"><svg t="1713770621159" class="icon" viewBox="0 0 1256 1024" version="1.1" xmlns="http://www.w3.org/2000/svg" p-id="6426" xmlns:xlink="http://www.w3.org/1999/xlink" width="245.3125" height="200"><path d="M201.681455 74.472727a111.709091 111.709091 0 0 0-111.709091 111.709091v651.636364a111.709091 111.709091 0 0 0 111.709091 111.709091h837.818181a111.709091 111.709091 0 0 0 111.709091-111.709091V186.181818a111.709091 111.709091 0 0 0-111.709091-111.709091h-837.818181z m0-74.472727h837.818181a186.181818 186.181818 0 0 1 186.181819 186.181818v651.636364a186.181818 186.181818 0 0 1-186.181819 186.181818h-837.818181a186.181818 186.181818 0 0 1-186.181819-186.181818V186.181818a186.181818 186.181818 0 0 1 186.181819-186.181818zM302.08 719.592727a24.669091 24.669091 0 0 1-10.333091-3.258182c-19.456-8.005818-40.587636-9.076364-43.240727-33.652363-2.513455-23.738182 12.474182-78.336 23.086545-101.003637A1441.512727 1441.512727 0 0 1 345.832727 446.603636l-1.117091-0.837818-43.892363 21.876364c-1.861818 1.210182-10.519273 5.864727-12.474182 6.144-5.306182 0.558545-5.12-7.540364-5.026909-10.426182-0.558545-13.730909 8.564364-19.083636 19.456-26.903273 14.801455-10.705455 65.861818-48.174545 79.266909-49.524363 12.567273-1.256727 24.901818 23.179636 25.739636 30.301091 1.536 13.730909 1.396364 12.381091-60.416 146.52509-13.824 29.649455-45.986909 100.445091-42.496 132.142546 0.558545 5.771636 2.513455 10.845091 3.211637 16.477091 0.418909 4.235636-1.675636 6.842182-6.050909 7.261091z m416.674909-279.458909c9.914182 90.763636-60.276364 223.464727-175.336727 243.665455-44.032 7.912727-74.658909-32.256-79.127273-72.471273-5.911273-53.341091 22.341818-115.665455 53.666909-158.161455 37.329455-50.362182 106.961455-95.092364 138.286546-98.39709 19.735273-2.048 45.893818 18.152727 47.010909 28.532363 0.558545 5.213091-10.938182 6.469818-13.963637 10.146909 22.341818 4.421818 27.368727 27.741091 29.463273 46.685091z m-85.178182 121.018182c18.618182-25.413818 53.434182-86.062545 50.082909-117.294545-1.117091-9.914182-7.959273-27.322182-21.410909-25.972364-12.567273 1.396364-23.179636 20.154182-27.927272 20.712727-3.909818 0.418909-5.492364-5.073455-5.771637-7.912727-81.361455 56.878545-112.128 128.093091-109.614545 177.105454 0.465455 9.029818 5.445818 36.212364 18.897454 34.816 14.429091-1.489455 43.333818-22.760727 53.248-33.88509l42.542546-47.616z m357.282909-149.876364c10.053818 90.856727-60.136727 223.511273-175.336727 243.712-44.032 7.912727-74.658909-32.256-79.127273-72.471272-5.911273-53.341091 22.341818-115.665455 53.666909-158.161455 37.329455-50.362182 106.961455-95.092364 138.286546-98.397091 19.735273-2.048 45.893818 18.152727 47.010909 28.532364 0.558545 5.213091-10.938182 6.469818-13.963636 10.146909 22.341818 4.421818 27.368727 27.741091 29.463272 46.685091z m-85.178181 121.018182c18.757818-25.506909 53.434182-86.016 50.082909-117.294545-1.117091-9.867636-7.959273-27.275636-21.410909-25.925818-12.567273 1.396364-23.179636 20.154182-27.927273 20.712727-3.770182 0.418909-5.445818-5.073455-5.771637-7.912727-81.361455 56.878545-112.128 128.093091-109.614545 177.105454 0.465455 9.029818 5.445818 36.212364 18.897455 34.816 14.429091-1.489455 43.333818-22.760727 53.248-33.885091l42.542545-47.616z m-79.546182 171.287273s70.888727-5.957818 110.498909-7.447273c0 0-333.917091 26.205091-623.522909 127.069091 0 0-42.216727 18.897455-49.477818 15.592727-14.429091-6.423273 0-15.639273 0-15.639272-4.468364 2.094545 252.090182-105.192727 616.634181-127.069091 0 0-35.095273 4.421818-54.132363 7.447272z m110.498909 20.945454s-35.095273 4.514909-53.992727 7.447273c0 0 70.749091-5.911273 110.312727-7.447273-322.141091 25.227636-323.397818 22.481455-623.476364 127.069091 0 0-42.216727 18.897455-49.524363 15.639273-14.429091-6.469818 0-15.639273 0-15.639273s216.203636-103.191273 616.680727-127.069091zM248.226909 186.181818a23.272727 23.272727 0 1 1 0-46.545454h526.941091a23.272727 23.272727 0 0 1 0 46.545454H248.273455z m0 93.090909a23.272727 23.272727 0 1 1 0-46.545454h263.447273a23.272727 23.272727 0 1 1 0 46.545454h-263.447273z" fill="#009345" p-id="6427"></path></svg>案例代码
<template>
<div>
<div id="customPatternBarChart" style="width: 100%; height: 400px;"></div>
</div>
</template>
<script>
import * as echarts from 'echarts';
require
export default {
data() {
const testIcon = "image://"+require('@/assets/test.svg')
var maxData = 100;
return {
chartInstance: null,
option: {
title: {
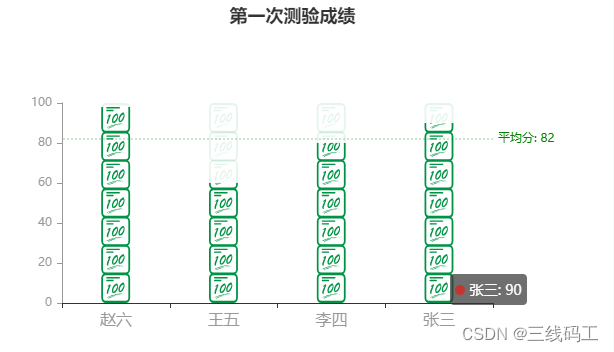
text: '第一次测验成绩',
left: 'center'
},
tooltip: {
},
xAxis: {
data: ['张三', '李四', '王五', '赵六'],
inverse: true,
// axisTick: { show: false },
// axisLine: { show: false },
axisLabel: {
margin: 10,
color: '#999',
fontSize: 16
}
},
yAxis: {
max: maxData,
splitLine: { show: false },
offset: 0,
axisLine: {
lineStyle: {
color: '#999'
}
},
axisLabel: {
margin: 10
}
},
grid: {
top: 'center',
height: 200,
left: 70,
right: 100
},
series: [
{
// current data
type: 'pictorialBar',
symbol: testIcon,
symbolRepeat: 'fixed',
symbolMargin: '5%',
symbolClip: true,
symbolSize: 30,
symbolBoundingData: maxData,
data: [90, 80, 60, 98],
markLine: {
symbol: 'none',
label: {
formatter: '平均分: {c}',
position: 'start'
},
lineStyle: {
color: 'green',
type: 'dotted',
opacity: 0.2,
width: 2
},
data: [
{
type: 'average'
}
]
},
z: 10
},
{
// full data
type: 'pictorialBar',
itemStyle: {
opacity: 0.1//未展示部分的透明度
},
label: {
show: true,
formatter: function (params) {
return ((params.value / maxData) * 100).toFixed(1) + ' %';
},
position: 'right',
offset: [10, 0],
color: 'green',
fontSize: 18
},
animationDuration: 0,
symbolRepeat: 'fixed',
symbolMargin: '5%',
symbol: testIcon,
symbolSize: 30,
symbolBoundingData: maxData,
data: [891, 1220, 660, 1670],
z: 5
}
]
}
};
},
mounted() {
this.chartInstance = echarts.init(document.getElementById('customPatternBarChart'));
this.chartInstance.setOption(this.option);
},
};
</script>
<style scoped>
div {
color: aqua;
}
</style>


![【UnityShader]使用Shader将图片进行水平/竖直镜像翻转](https://img-blog.csdnimg.cn/direct/50d09d82688143e1986a10e56ba6bf36.gif)