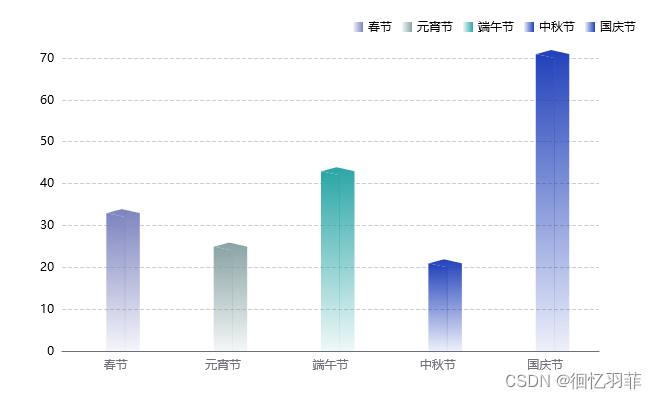
echarts用pictorialBar实现3D柱状图

先看下效果

柱状图效果

实现思路

  1. 描绘一个普通的柱状图
  2. 通过象形柱图(pictorialBar)在柱状图的顶部添加一个图形类型(symbol)菱形

代码实现

<template>
    <div id="symbolBar"></div>
</template>
<script setup>
    import {onMounted} from 'vue'
    import * as echarts from 'echarts';
    
	// 模拟数据
    const chartData = {
        xData: ['智慧社区','智慧园区','智慧党建'],
        data: [2000, 5000, 4000]
    }
    const drawBar = () => {
        let curChart = echarts.init(document.getElementById('symbolBar'))
        const exampleOption = {
        	// 提示框效果设置
            tooltip: {
                trigger: 'axis',
                axisPointer: {
                    type: 'shadow',
                },
                formatter: (params) => {
                    const str = `项目: ${params[0].axisValue}
                    </br>
                    ${params[0].marker}访问量: ${params[0].value}`
                    return str;
                },
            },
            // 图例设置
            legend: {
                show:true,
                textStyle: { fontSize: 12, color: '#fff' },
                itemWidth: 12,
                itemHeight: 12,
                itemGap: 15,
                top: '0%',
                right: '0%',
            },
            textStyle: {
                fontSize: 12
            },
            grid: {
                containLabel: true, // 防止标签溢出
                left: '0%',
                top: '10%',
                bottom: '0%',
                right: '0%',
            },
            // X轴设置
            xAxis: {
                type: 'category',
                data: chartData.xData,
                axisLine: {
                    lineStyle: {
                        color: '#979797',
                        opacity: 0.38
                    },
                },
                axisTick: {
                    show: false,
                },
                axisLabel: {
                    margin: 10,
                    fontFamily: 'Microsoft YaHei',
                    color: '#ffffff',
                    fontSize: 12
                },
            },
            // Y轴设置
            yAxis: {
                nameTextStyle: {
                    verticalAlign: 'middle',
                    align: "right"
                },
                type: 'value',
                min:0,
                boundaryGap: ['0%', '10%'],
                axisLine: {
                    show: true,
                    lineStyle: {
                        color: '#979797',
                        opacity: 0.38
                    },
                },
                splitLine: {
                    lineStyle: {
                        color: ['#fff'],
                        type: 'dashed',
                        opacity: 0.09,
                    },
                },
                axisLabel: {
                    fontSize: 12
                },
            },
            series: [
            	// 柱状图描绘
                {
                    name: "项目",
                    data: chartData.data,
                    type: 'bar',
                    barMaxWidth: 'auto',
                    barWidth: 22,
                    itemStyle: {
                        color: {
                            x: 0,
                            y: 0,
                            x2: 0,
                            y2: 1,
                            type: 'linear',
                            global: false,
                            colorStops: [
                                {
                                    offset: 0,
                                    color: '#16B2FF',
                                },
                                {
                                    offset: 1,
                                    color: 'rgba(90,74,219,0.44)'
                                },
                            ],
                        },
                    },
                },
                // 菱形描绘
                {
                    data: chartData.data,
                    type: 'pictorialBar',
                    barMaxWidth: 'auto',
                    symbolPosition: 'end', // 位置在柱状图顶部
                    symbol: 'diamond', // 图形类型为菱形
                    symbolOffset: [0, '-50%'], // 下移一半,遮住柱状图顶部
                    symbolSize: [22, 10],
                    zlevel: 200, // 菱形图形显示在柱状图之上
                    itemStyle: {
                        color: {
                            x: 0,
                            y: 0,
                            x2: 0,
                            y2: 1.3,
                            type: 'linear',
                            global: false,
                            colorStops: [
                                {
                                    offset: 0,
                                    color: '#16B2FF',
                                },
                                {
                                    offset: 1,
                                    color: 'rgba(90,74,219,0.8)'
                                },
                            ],
                        },
                    }
                },
            ],
        };
        curChart.setOption(exampleOption)
    }
    onMounted(() => {
        drawBar()
    })
</script>

<style scoped>

#symbolBar{
    width: 360px;
    height: 300px;
}
</style>

补充说明

  1. 以上内容是vite构建的vue3项目
  2. echarts版本5.5.1

相关推荐

  1. vue运用之echart3D效果案例代码

    2024-07-18 00:22:09       56 阅读
  2. ECharts实现简单饼

    2024-07-18 00:22:09       47 阅读

最近更新

  1. docker php8.1+nginx base 镜像 dockerfile 配置

    2024-07-18 00:22:09       51 阅读
  2. Could not load dynamic library ‘cudart64_100.dll‘

    2024-07-18 00:22:09       54 阅读
  3. 在Django里面运行非项目文件

    2024-07-18 00:22:09       44 阅读
  4. Python语言-面向对象

    2024-07-18 00:22:09       55 阅读

热门阅读

  1. ZC2205-24V500mAUltralow-Quiescent-Current LDO

    2024-07-18 00:22:09       16 阅读
  2. golang项目中gorm框架的配置和具体使用

    2024-07-18 00:22:09       16 阅读
  3. 使用Django框架实现音频上传功能

    2024-07-18 00:22:09       18 阅读
  4. 38 IRF+链路聚合+ACL+NAT组网架构

    2024-07-18 00:22:09       18 阅读
  5. Resilience4j 实现接口限流

    2024-07-18 00:22:09       21 阅读
  6. ld,GNU 链接器介绍以及命令行参数详解

    2024-07-18 00:22:09       14 阅读
  7. Windows 点云生成二维栅格图 [附C++完整代码实现]

    2024-07-18 00:22:09       16 阅读
  8. go recover

    2024-07-18 00:22:09       19 阅读
  9. docker从0到1 部署gitlab 纯干货

    2024-07-18 00:22:09       18 阅读