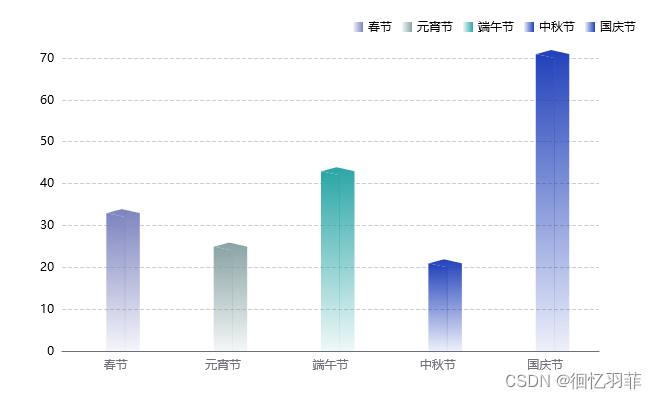
1. 柱状图(柱体顶部使用外部图片

相关代码
<template>
  <div class="out-bg">
    <div class="container" ref="warnChartRef"></div>
  </div>
</template>

<script>
import * as echarts from 'echarts'
export default {
  data() {
    return {
      jqrwChart: null,
      active: 0,
      xData: ['公交车', '卡车', '小客车', '工程车', '挖掘机', '未带安全帽', '烟雾', '货车', '轿车'], // 赋值x轴的数据
      seriesData: [147, 244, 2, 2, 174, 1, 1, 897, 1628],// 赋值Y轴的数据
      barTopImg: require('@/assets/images/bigScreen/bar-top.png'),
      symbolData: [],
      timer: null,
    }
  },
  mounted() {
    this.initData()
  },
  methods: {
    //echarts自适应
    fontSize(res) {
      let clientWidth =
        window.innerWidth ||
        document.documentElement.clientWidth ||
        document.body.clientWidth;
      if (!clientWidth) return;
      let fontSize = clientWidth / 1920;
      return res * fontSize;
    },
    initData() {
      this.xData.forEach((item, index) => {
        // 设置markPoint数据
        this.symbolData.push({
          symbol: 'image://' + this.barTopImg,
          symbolSize: [this.fontSize(20), this.fontSize(18)],
          xAxis: item,
          yAxis: this.seriesData[index], // 对应每列基础bar的值
        });
      });
      this.intChart();
    },
    intChart() {
      this.$nextTick(() => {
        this.jqrwChart = echarts.init(this.$refs.warnChartRef);
        this.jqrwChart.clear();
        this.jqrwChart.resize();
        let option = {
          grid: {
            containLabel: true,
            // width: '70%',
            // height: '68%',
            top: 20,
            right: 15,
            bottom: 0,
            left: 10,
          },
          tooltip: {
            trigger: "axis",
            axisPointer: {
              type: "shadow",
            },
          },
          xAxis: {
            // 类目轴
            type: "category",
            data: this.xData,
            axisTick: {
              show: false, //隐藏X轴刻度
            },
            axisLine: {
              lineStyle: {
                color: "rgba(57, 70, 89, 1)",
              },
            },
            axisLabel: {
              show: true,
              rotate: 25, // 轴转动
              textStyle: {
                color: "#fff",
                fontSize: this.fontSize(10),
                fontFamily: "Source Han Sans CN-Regular",
              },
            },
          },
          yAxis: {
            type: "value",
            name: "",
            nameTextStyle: { // 坐标轴名称的样式
              color: "rgba(255,255,255,1)",
              fontSize: this.fontSize(14),
              fontFamily: "Source Han Sans CN-Regular",
              align: "left",
              verticalAlign: "center",
            },
            axisLabel: { // 刻度标签
              show: true,
              color: "rgba(255,255,255,1)",
              textStyle: {
                fontSize: this.fontSize(14),
              },
            },
            axisLine: { // 刻度线
              show: false,
              lineStyle: {
                color: "rgba(57, 70, 89, 1)",
              },
            },
            axisTick: {
              show: false,
            },
            splitLine: { // 分隔线
              lineStyle: {
                color: "rgba(57, 70, 89, 1)",
                type: "dashed",
              },
            },
          },
          series: [
            {
              name: "数据",
              type: "bar",
              barWidth: this.fontSize(20),
              showBackground: true,
              backgroundStyle: {
                color: "transparent",
              },
              label: {
                show: true,
                position: 'top',
                color: '#fff',
                fontSize: this.fontSize(14),
                fontFamily: "DingTalkJinBuTi",
                padding: [0, 0, this.fontSize(4), 0]
              },
              itemStyle: {
                color: new echarts.graphic.LinearGradient(0, 0, 0, 1, [
                  { offset: 0, color: "rgba(0, 123, 232, 0.61)" },
                  { offset: 1, color: "rgba(24, 126, 171, 0)" },
                ]),
              },
              data: this.seriesData,
              markPoint: {
                data: this.symbolData,
              }
            },
          ],
        };
        this.jqrwChart.setOption(option, true);
        // 监听窗口变化
        window.addEventListener('resize', this.setSize)
      });
    },
    setSize() {
      if (this.timer) {
        clearTimeout(this.timer)
      }
      this.timer = setTimeout(() => {
        this.jqrwChart.resize();
      }, 500);
    },

  },
  destroyed() {
    window.removeEventListener('resize', this.setSize)
  }
}
</script>

<style lang="less" scoped>
  .out-bg{
    width: 100%;
    height: 100%;
    .container{
      width: 100%;
      height: 16.25rem;
    }
  }
</style>


![903. 昂贵的聘礼[dijsktra堆优化版]](https://img-blog.csdnimg.cn/direct/2ed23cf181e14cc7ab2afc03b9887beb.png#pic_center)

![Python 机器学习 基础 之 监督学习 [决策树集成] 算法 的简单说明](https://img-blog.csdnimg.cn/direct/d1e1a9763a094f739084ce0a69315dde.png)