第3章 Logstash数据分析
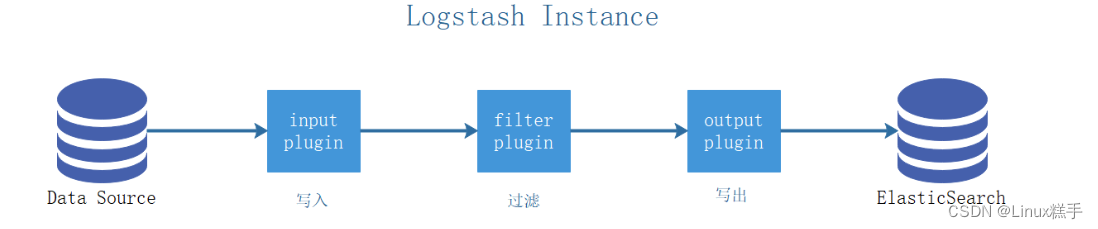
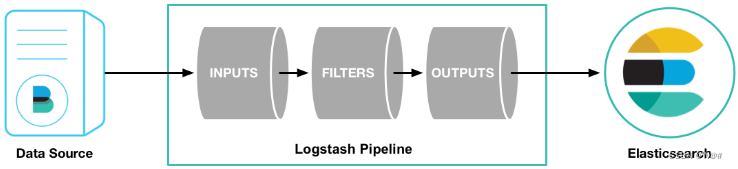
Logstash使用管道方式进行日志的搜集处理和输出。有点类似*NIX系统的管道命令 xxx | ccc | ddd,xxx执行完了会执行ccc,然后执行ddd。
在logstash中,包括了三个阶段:
输入input --> 处理filter(不是必须的) --> 输出output

每个阶段都由很多的插件配合工作,比如file、elasticsearch、redis等等。
每个阶段也可以指定多种方式,比如输出既可以输出到elasticsearch中,也可以指定到stdout在控制台打印。
logstash支持多输入和多输出
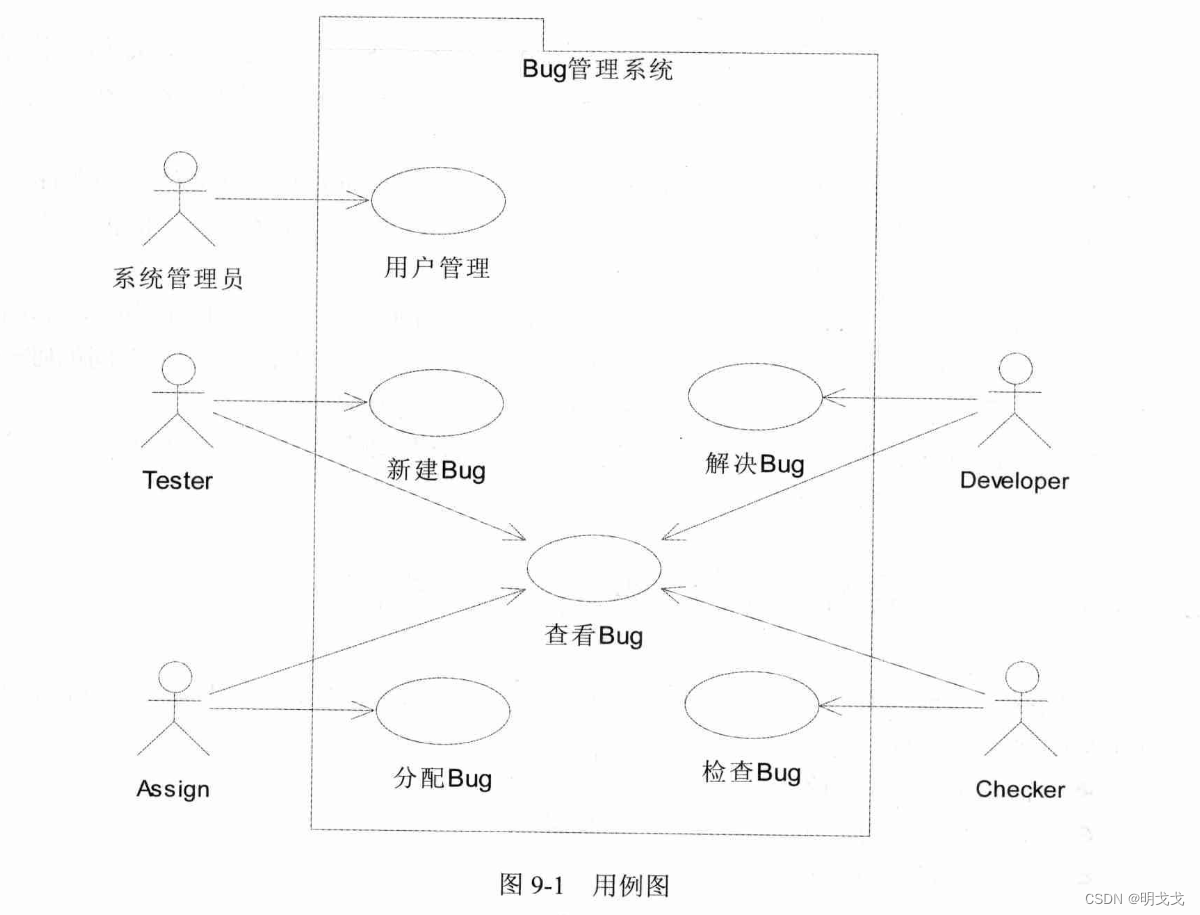
ELFK架构示意图:

1.Logstash基础部署
- 安装软件
[root@host3 ~]# yum install logstash --enablerepo=es -y 			# 偶尔需要使用的仓库可以将它关闭,用到的时候临时打开

[root@host3 ~]# ln -sv /usr/share/logstash/bin/logstash /usr/local/bin/	# 做软连接,命令就可以直接使用了
"/usr/local/bin/logstash" -> "/usr/share/logstash/bin/logstash"
- 创建第一个配置文件
[root@host3 ~]# vim 01-stdin-stdout.conf

input {
  stdin {}
}

output {
  stdout {}
}
- 测试配置文件
[root@host3 ~]# logstash -tf 01-stdin-stdout.conf
- 自定义启动,这种方式通常用于实验环境,业务环境下,通常将配置修改后,使用systemctl来管理服务
[root@host3 ~]# logstash -f 01-stdin-stdout.conf
Using bundled JDK: /usr/share/logstash/jdk
OpenJDK 64-Bit Server VM warning: Option UseConcMarkSweepGC was deprecated in version 9.0 and will likely be removed in a future release.
WARNING: Could not find logstash.yml which is typically located in $LS_HOME/config or /etc/logstash. You can specify the path using --path.settings. Continuing using the defaults
Could not find log4j2 configuration at path /usr/share/logstash/config/log4j2.properties. Using default config which logs errors to the console
[INFO ] 2022-09-15 21:49:37.109 [main] runner - Starting Logstash {"logstash.version"=>"7.17.6", "jruby.version"=>"jruby 9.2.20.1 (2.5.8) 2021-11-30 2a2962fbd1 OpenJDK 64-Bit Server VM 11.0.16+8 on 11.0.16+8 +indy +jit [linux-x86_64]"}
[INFO ] 2022-09-15 21:49:37.115 [main] runner - JVM bootstrap flags: [-Xms1g, -Xmx1g, -XX:+UseConcMarkSweepGC, -XX:CMSInitiatingOccupancyFraction=75, -XX:+UseCMSInitiatingOccupancyOnly, -Djava.awt.headless=true, -Dfile.encoding=UTF-8, -Djdk.io.File.enableADS=true, -Djruby.compile.invokedynamic=true, -Djruby.jit.threshold=0, -Djruby.regexp.interruptible=true, -XX:+HeapDumpOnOutOfMemoryError, -Djava.security.egd=file:/dev/urandom, -Dlog4j2.isThreadContextMapInheritable=true]
[INFO ] 2022-09-15 21:49:37.160 [main] settings - Creating directory {:setting=>"path.queue", :path=>"/usr/share/logstash/data/queue"}
[INFO ] 2022-09-15 21:49:37.174 [main] settings - Creating directory {:setting=>"path.dead_letter_queue", :path=>"/usr/share/logstash/data/dead_letter_queue"}
[WARN ] 2022-09-15 21:49:37.687 [LogStash::Runner] multilocal - Ignoring the 'pipelines.yml' file because modules or command line options are specified
[INFO ] 2022-09-15 21:49:38.843 [LogStash::Runner] Reflections - Reflections took 114 ms to scan 1 urls, producing 119 keys and 419 values
[WARN ] 2022-09-15 21:49:39.658 [LogStash::Runner] line - Relying on default value of `pipeline.ecs_compatibility`, which may change in a future major release of Logstash. To avoid unexpected changes when upgrading Logstash, please explicitly declare your desired ECS Compatibility mode.
[WARN ] 2022-09-15 21:49:39.703 [LogStash::Runner] stdin - Relying on default value of `pipeline.ecs_compatibility`, which may change in a future major release of Logstash. To avoid unexpected changes when upgrading Logstash, please explicitly declare your desired ECS Compatibility mode.
Configuration OK
[INFO ] 2022-09-15 21:49:39.917 [LogStash::Runner] runner - Using config.test_and_exit mode. Config Validation Result: OK. Exiting Logstash
[root@host3 ~]# logstash -f 01-stdin-stdout.conf
Using bundled JDK: /usr/share/logstash/jdk
OpenJDK 64-Bit Server VM warning: Option UseConcMarkSweepGC was deprecated in version 9.0 and will likely be removed in a future release.
 WARNING: Could not find logstash.yml which is typically located in $LS_HOME/config or /etc/logstash. You can specify the path using --path.settings. Continuing using the defaults
Could not find log4j2 configuration at path /usr/share/logstash/config/log4j2.properties. Using default config which logs errors to the console
[INFO ] 2022-09-15 21:50:25.095 [main] runner - Starting Logstash {"logstash.version"=>"7.17.6", "jruby.version"=>"jruby 9.2.20.1 (2.5.8) 2021-11-30 2a2962fbd1 OpenJDK 64-Bit Server VM 11.0.16+8 on 11.0.16+8 +indy +jit [linux-x86_64]"}
[INFO ] 2022-09-15 21:50:25.103 [main] runner - JVM bootstrap flags: [-Xms1g, -Xmx1g, -XX:+UseConcMarkSweepGC, -XX:CMSInitiatingOccupancyFraction=75, -XX:+UseCMSInitiatingOccupancyOnly, -Djava.awt.headless=true, -Dfile.encoding=UTF-8, -Djdk.io.File.enableADS=true, -Djruby.compile.invokedynamic=true, -Djruby.jit.threshold=0, -Djruby.regexp.interruptible=true, -XX:+HeapDumpOnOutOfMemoryError, -Djava.security.egd=file:/dev/urandom, -Dlog4j2.isThreadContextMapInheritable=true]
[WARN ] 2022-09-15 21:50:25.523 [LogStash::Runner] multilocal - Ignoring the 'pipelines.yml' file because modules or command line options are specified
[INFO ] 2022-09-15 21:50:25.555 [LogStash::Runner] agent - No persistent UUID file found. Generating new UUID {:uuid=>"3fc04af1-7665-466e-839f-1eb42348aeb0", :path=>"/usr/share/logstash/data/uuid"}
[INFO ] 2022-09-15 21:50:27.119 [Api Webserver] agent - Successfully started Logstash API endpoint {:port=>9600, :ssl_enabled=>false}
[INFO ] 2022-09-15 21:50:28.262 [Converge PipelineAction::Create<main>] Reflections - Reflections took 110 ms to scan 1 urls, producing 119 keys and 419 values
[WARN ] 2022-09-15 21:50:29.084 [Converge PipelineAction::Create<main>] line - Relying on default value of `pipeline.ecs_compatibility`, which may change in a future major release of Logstash. To avoid unexpected changes when upgrading Logstash, please explicitly declare your desired ECS Compatibility mode.
[WARN ] 2022-09-15 21:50:29.119 [Converge PipelineAction::Create<main>] stdin - Relying on default value of `pipeline.ecs_compatibility`, which may change in a future major release of Logstash. To avoid unexpected changes when upgrading Logstash, please explicitly declare your desired ECS Compatibility mode.
[INFO ] 2022-09-15 21:50:29.571 [[main]-pipeline-manager] javapipeline - Starting pipeline {:pipeline_id=>"main", "pipeline.workers"=>2, "pipeline.batch.size"=>125, "pipeline.batch.delay"=>50, "pipeline.max_inflight"=>250, "pipeline.sources"=>["/root/01-stdin-stdout.conf"], :thread=>"#<Thread:0x32e464e6 run>"}
[INFO ] 2022-09-15 21:50:30.906 [[main]-pipeline-manager] javapipeline - Pipeline Java execution initialization time {"seconds"=>1.33}
WARNING: An illegal reflective access operation has occurred
WARNING: Illegal reflective access by com.jrubystdinchannel.StdinChannelLibrary$Reader (file:/usr/share/logstash/vendor/bundle/jruby/2.5.0/gems/jruby-stdin-channel-0.2.0-java/lib/jruby_stdin_channel/jruby_stdin_channel.jar) to field java.io.FilterInputStream.in
WARNING: Please consider reporting this to the maintainers of com.jrubystdinchannel.StdinChannelLibrary$Reader
WARNING: Use --illegal-access=warn to enable warnings of further illegal reflective access operations
WARNING: All illegal access operations will be denied in a future release
[INFO ] 2022-09-15 21:50:31.128 [[main]-pipeline-manager] javapipeline - Pipeline started {"pipeline.id"=>"main"}
The stdin plugin is now waiting for input:
[INFO ] 2022-09-15 21:50:31.270 [Agent thread] agent - Pipelines running {:count=>1, :running_pipelines=>[:main], :non_running_pipelines=>[]}
abc
{
       "message" => " abc",
      "@version" => "1",
          "host" => "host3.test.com",
    "@timestamp" => 2022-09-15T13:52:02.984Z
}
bbb
{
       "message" => "bbb",
      "@version" => "1",
          "host" => "host3.test.com",
    "@timestamp" => 2022-09-15T13:52:06.177Z
}
2.输入类型
在上例中,输入类型是stdin,也就是手动输入,而在生产环境中,日志不可能通过手工输入的发生产生,因此stdin通常都是用于测试环境是否搭建成功,下面会介绍几种常见的输入类型。
2.1 file
input {
  file {
    path => ["/tmp/test/*.txt"]
    # 从最开始读日志文件(默认是末尾),仅在读取记录没有任何记录的情况下生效,也就是说,在服务停止的时候有新文件产生,服务器启动后可以读取到(旧文件不行)
    start_position => "beginning"
  }
}
文件的读取记录放在/usr/share/logstash/data/plugins/inputs/file/.sincedb_3cd99a80ca58225ec14dc0ac340abb80中
[root@host3 ~]# cat /usr/share/logstash/data/plugins/inputs/file/.sincedb_3cd99a80ca58225ec14dc0ac340abb80
5874000 0 64768 4 1663254379.147252 /tmp/test/1.txt
2.2 tcp
和filebeat一样,Logstash同样支持监听TCP的某一个端口,用来接收日志。可以同时监听多个端口
这种方式通常用于无法安装客户端的服务器
也可以使用HTTP协议,配置方法和TCP类似
[root@host3 ~]#vim 03-tcp-stdout.conf
input {
  tcp {
    port => 9999
  }
}

output {
  stdout {}
}
[root@host2 ~]# telnet 192.168.19.103 9999
Trying 192.168.19.103...
Connected to 192.168.19.103.
Escape character is '^]'.
123456
test
hello
{
       "message" => "123456\r",
      "@version" => "1",
    "@timestamp" => 2022-09-15T15:30:23.123Z,
          "host" => "host2",
          "port" => 51958
}
{
       "message" => "test\r",
      "@version" => "1",
    "@timestamp" => 2022-09-15T15:30:24.494Z,
          "host" => "host2",
          "port" => 51958
}
{
       "message" => "hello\r",
      "@version" => "1",
    "@timestamp" => 2022-09-15T15:30:26.336Z,
          "host" => "host2",
          "port" => 51958
}
2.3 redis
Logstash支持直接从redis数据库中拿数据。支持三种redis数据类型:
- list,表示的redis命令为blpop,代表从redis list的左边获取第一个元素,如无元素则阻塞;
- channel,表示的redis命令为subscribe,代表从redis频道获取最新的数据;
- pattern_channel,表示的redis命令为psubscribe,代表通过pattern正则表达式匹配频道,获取最新的数据。
数据类型之间的区别:
- channel与pattern_channel的区别在于,pattern_channel可以通过正则表达式匹配多个频道,而channel是单一频道;
- list与另外两个channel的区别在于,1个channel的数据会被多个订阅的logstash重复获取,1个list的数据被多个logstash获取时不会重复,会被分摊在各个Logstash中。
输入配置如下
input {
  redis {
    data_type => "list"         # 指定数据类型
    db => 5                     # 指定数据库,默认是0
    host => "192.168.19.101"    # 指定redis服务器IP,默认是localhost
    port => 6379
    password => "bruce"
    key => "test-list"
  }
}
redis中追加数据
[root@host1 ~]# redis-cli -h host1 -a bruce
host1:6379> select 5
OK
host1:6379[5]> lpush test-list bruce
(integer) 1
host1:6379[5]> lrange test-list 0 -1
(empty list or set)
host1:6379[5]> lpush test-list hello
(integer) 1
host1:6379[5]> lrange test-list 0 -1		# 可以看到,Logstash获取数据后,会将列表清空
(empty list or set)
host1:6379[5]> lpush test-list '{"requestTime":"[12/Sep/2022:23:30:56 +0800]","clientIP":"192.168.19.1","threadID":"http-bio-8080-exec-7","protocol":"HTTP/1.1","requestMethod":"GET / HTTP/1.1","requestStatus":"404","sendBytes":"-","queryString":"","responseTime":"0ms","partner":"-","agentVersion":"Mozilla/5.0 (Windows NT 10.0; Win64; x64) AppleWebKit/537.36 (KHTML, like Gecko) Chrome/105.0.0.0 Safari/537.36"}'
Logstash获取数据
{
       "message" => "bruce",
    "@timestamp" => 2022-09-16T08:17:38.213Z,
      "@version" => "1",
          "tags" => [
        [0] "_jsonparsefailure"
    ]
}
# 非json格式数据会报错,但是能接收
[ERROR] 2022-09-16 16:18:21.688 [[main]<redis] json - JSON parse error, original data now in message field {:message=>"Unrecognized token 'hello': was expecting ('true', 'false' or 'null')\n at [Source: (String)\"hello\"; line: 1, column: 11]", :exception=>LogStash::Json::ParserError, :data=>"hello"}
{
       "message" => "hello",
    "@timestamp" => 2022-09-16T08:18:21.689Z,
      "@version" => "1",
          "tags" => [
        [0] "_jsonparsefailure"
    ]
}
# json格式的数据过来,Logstash可以自动解析
{
         "clientIP" => "192.168.19.1",
      "requestTime" => "[12/Sep/2022:23:30:56 +0800]",
      "queryString" => "",
         "@version" => "1",
     "agentVersion" => "Mozilla/5.0 (Windows NT 10.0; Win64; x64) AppleWebKit/537.36 (KHTML, like Gecko) Chrome/105.0.0.0 Safari/537.36",
          "partner" => "-",
       "@timestamp" => 2022-09-16T08:23:10.320Z,
         "protocol" => "HTTP/1.1",
    "requestStatus" => "404",
         "threadID" => "http-bio-8080-exec-7",
    "requestMethod" => "GET / HTTP/1.1",
        "sendBytes" => "-",
     "responseTime" => "0ms"
}
2.4 beats
在FileBeat中已经配置好了将日志输出到Logstash,在Logstash中,只需要接收数据即可。
filebeat配置
filebeat.inputs:
- type: log
  paths: /tmp/1.txt

output.logstash:
  hosts: ["192.168.19.103:5044"]
Logstash配置
input {
  beats {
    port => 5044
  }
}
host2上在/tmp/1.txt中追加111,Logstash的输出
{
       "message" => "111",
          "tags" => [
        [0] "beats_input_codec_plain_applied"
    ],
         "agent" => {
                  "id" => "76b7876b-051a-4df8-8b13-bd013ac5ec59",
             "version" => "7.17.4",
            "hostname" => "host2.test.com",
                "type" => "filebeat",
                "name" => "host2.test.com",
        "ephemeral_id" => "437ac89f-7dc3-4898-a457-b2452ac4223b"
    },
         "input" => {
        "type" => "log"
    },
          "host" => {
        "name" => "host2.test.com"
    },
           "log" => {
        "offset" => 0,
          "file" => {
            "path" => "/tmp/1.txt"
        }
    },
      "@version" => "1",
           "ecs" => {
        "version" => "1.12.0"
    },
    "@timestamp" => 2022-09-16T08:53:20.975Z
}
3. 输出类型
3.1 redis
redis也可以作为输出类型,配置方式和输入类似
output {
  redis {
    data_type => "list"
    db => 6
    host => "192.168.19.101"
    port => 6379
    password => "bruce"
    key => "test-list"
  }
}
查看redis数据库
[root@host1 ~]# redis-cli -h host1 -a bruce
host1:6379> select 6
OK
host1:6379[6]> lrange test-list 0 -1
1) "{\"message\":\"1111\",\"@version\":\"1\",\"@timestamp\":\"2022-09-16T09:12:29.890Z\",\"host\":\"host3.test.com\"}"
3.2 file
file类型是输出到本地磁盘保存。
output {
  file {
    path => "/tmp/test-file.log"
  }
}
3.3 elasticsearch
output {
  elasticsearch {
    hosts => ["192.168.19.101:9200","192.168.19.102:9200","192.168.19.103:9200"]
    index => "centos-logstash-elasticsearh-%{+YYYY.MM.dd}"
  }
}
4. filter
filter是一个可选插件,在接收到日志信息后,可以对日志进行格式化,然后再输出。
4.1 grok
grok可以用来解析任意文本并进行结构化。该工具适合syslog日志、Apache和其他网络服务器日志。
①简单示例
input {
  file {
    path => ["/var/log/nginx/access.log*"]
    start_position => "beginning"
  }
}

filter {
  grok {
    match => {
      "message" => "%{COMBINEDAPACHELOG}"
      # "message" => "%{HTTPD_COMMONLOG}"		# 新版本Logstash可能会用这个变量
    }
  }
}

output {
  stdout {}
  elasticsearch {
    hosts => ["192.168.19.101:9200","192.168.19.102:9200","192.168.19.103:9200"]
    index => "nginx-logs-es-%{+YYYY.MM.dd}"
  }
}
解析出来的结果:
{
        "request" => "/",
          "bytes" => "4833",
       "@version" => "1",
           "auth" => "-",
          "agent" => "\"curl/7.29.0\"",
           "path" => "/var/log/nginx/access.log-20220913",
          "ident" => "-",
           "verb" => "GET",
        "message" => "192.168.19.102 - - [12/Sep/2022:21:48:29 +0800] \"GET / HTTP/1.1\" 200 4833 \"-\" \"curl/7.29.0\" \"-\"",
    "httpversion" => "1.1",
           "host" => "host3.test.com",
     "@timestamp" => 2022-09-16T14:27:43.208Z,
       "response" => "200",
      "timestamp" => "12/Sep/2022:21:48:29 +0800",
       "referrer" => "\"-\"",
       "clientip" => "192.168.19.102"
}

②预定义字段
grok是基于正则表达式来进行匹配,它的语法格式是%{SYNTAX:SEMANTIC}
- SYNTAX是将匹配您的文本的模式的名称,这是内置好的语法,官方支持120种字段。
- SEMANTIC是您为要匹配的文本提供的标识符,也就是你要给它去的名字。
示例:
- 日志源文件
55.3.244.1 GET /index.html 15824 0.043
- 匹配的字段应该是
%{IP:client} %{WORD:method} %{URIPATHPARAM:request} %{NUMBER:bytes} %{NUMBER:duration}
- 配置文件
input {
  stdin {}
}

filter {
  grok {
    match => { "message" => "%{IP:client} %{WORD:method} %{URIPATHPARAM:request} %{NUMBER:bytes} %{NUMBER:duration}" }
  }
}

output {
  stdout {}
}
- 匹配出来的结果
55.3.244.1 GET /index.html 15824 0.043
{
       "message" => "55.3.244.1 GET /index.html 15824 0.043",
      "@version" => "1",
    "@timestamp" => 2022-09-16T14:46:46.426Z,
        "method" => "GET",
       "request" => "/index.html",
         "bytes" => "15824",
      "duration" => "0.043",
          "host" => "host3.test.com",
        "client" => "55.3.244.1"
}
针对不同服务的日志,可以查看官方文档的定义:
https://github.com/logstash-plugins/logstash-patterns-core/tree/master/patterns
③自定义字段
当预定义的字段不符合要求时,grok也支持自定义正则表达式来匹配日志信息
- 首先需要创建自定义表达式保存的目录,并将表达式写进去
[root@host3 ~]# mkdir patterns
[root@host3 ~]# echo "POSTFIX_QUEUEID [0-9A-F]{10,11}" >> ./patterns/1
- 修改配置文件
input {
  stdin {}
}

filter {
  grok {
    patterns_dir => ["/root/patterns"]											# 指定表达式位置
    match => { "message" => "%{SYSLOGBASE} %{POSTFIX_QUEUEID:queue_id}: %{GREEDYDATA:syslog_message}" }	# 这里有系统预定义的,也有自定义的表达式,大括号外的字符就是常规的字符,需要逐个匹配,如冒号:
  }
}

output {
  stdout {}
}
- 运行并测试
...
The stdin plugin is now waiting for input:
[INFO ] 2022-09-16 23:22:04.511 [Agent thread] agent - Pipelines running {:count=>1, :running_pipelines=>[:main], :non_running_pipelines=>[]}
Jan  1 06:25:43 mailserver14 postfix/cleanup[21403]: BEF25A72965: message-id=<20130101142543.5828399CCAF@mailserver14.example.com>
{
           "message" => "Jan  1 06:25:43 mailserver14 postfix/cleanup[21403]: BEF25A72965: message-id=<20130101142543.5828399CCAF@mailserver14.example.com>",
              "host" => "host3.test.com",
         "timestamp" => "Jan  1 06:25:43",
          "queue_id" => "BEF25A72965",			# 自定义表达式匹配的字段
         "logsource" => "mailserver14",
        "@timestamp" => 2022-09-16T15:22:19.516Z,
           "program" => "postfix/cleanup",
               "pid" => "21403",
          "@version" => "1",
    "syslog_message" => "message-id=<20130101142543.5828399CCAF@mailserver14.example.com>"
}
4.2 通用字段
顾名思义,这些字段可以用在所有属于filter的插件中。
- remove_field
filter {
  grok {
    remove_field => ["@version","tag","agent"]
  }
}
- add_field
filter {
  grok {
    add_field => ["new_tag" => "hello world %{YYYY.mm.dd}"]
  }
}
4.3 date
在数据中,会有两个时间戳timestamp和@timestamp,日志产生的时间和数据采集的时间,这两个时间可能会不一致。
date插件可以用来转换日志记录中的时间字符串,参考@timestamp字段里的时间。date插件支持五种时间格式:
- ISO8601
- UNIX
- UNIX_MS
- TAI64N
input {
  file {
    path => "/var/log/nginx/access.log*"
    start_position => "beginning"
  }
}

filter {

  grok {
    match => { "message" => "%{HTTPD_COMMONLOG}" }
    remove_field => ["message","ident","auth","@version","path"]
  }

  date {
    match => [ "timestamp","dd/MMM/yyyy:HH:mm:ss Z" ]
    # timestamp必须是现有的字段,这里只是对这个字段的时间进行校正,且需要和timestamp字段的原数据格式一致,否则会报解析错误
    # timestamp原来的数据格式为"17/Sep/2022:18:42:26 +0800",因此时区改成ZZZ就会一直报错,因为ZZZ代表Asia/Shanghai这种格式,Z代表+0800
    timezone => "Asia/Shanghai"
  }

}

output {
  stdout {}
}
输出的格式:
{
      "timestamp" => "17/Sep/2022:18:42:26 +0800", #和@timestamp有8小时的时间差,可到Elasticsearch中查看,如果也有时间差,可以在date中修改timezone
       "response" => "200",
    "httpversion" => "1.1",
       "clientip" => "192.168.19.102",
           "verb" => "GET",
           "host" => "host3.test.com",
        "request" => "/",
     "@timestamp" => 2022-09-17T10:42:26.000Z,
          "bytes" => "4833"
}
使用target将匹配到的时间字段解析后存储到目标字段,若不指定,默认是@timestamp字段。这个字段在Kibana中创建索引时可以用到
  date {
    match => [ "timestamp","dd/MMM/yyyy:HH:mm:ss Z" ]
    timezone => "Asia/Shanghai"
    target => "logtime"
  }

# 结果
{
      "timestamp" => "17/Sep/2022:21:15:30 +0800",
       "response" => "200",
        "logtime" => 2022-09-17T13:15:30.000Z,		# 日志产生的时间
    "httpversion" => "1.1",
       "clientip" => "192.168.19.102",
           "verb" => "GET",
           "host" => "host3.test.com",
        "request" => "/",
     "@timestamp" => 2022-09-17T13:15:31.357Z,		# 日志记录的时间,可以看到和日志产生的时间有一定的延迟
          "bytes" => "4833"
}
4.4 geoip
用来解析访问IP的位置信息。这个插件是依赖GeoLite2城市数据库,信息不一定准确,也可以自己下载MaxMind格式的数据库然后应用,官方网站有自定义数据库的指导手册。
input {
  file {
    path => "/var/log/nginx/access.log*"
    start_position => "beginning"
  }
}

filter {

  grok {
    match => { "message" => "%{HTTPD_COMMONLOG}" }
    remove_field => ["message","ident","auth","@version","path"]
  }

  geoip {
    source => "clientip" 			# IP地址的源参考clientip字段
    # fields => ["country_name" ,"timezone", "city_name"]		# 可以选择显示的字段
  }

}

output {
  stdout {}
}
得到的结果,可以看到,私有地址无法正常解析
{
      "timestamp" => "17/Sep/2022:21:15:30 +0800",
       "response" => "200",
          "geoip" => {},
    "httpversion" => "1.1",
       "clientip" => "192.168.19.102",
           "verb" => "GET",
           "host" => "host3.test.com",
           "tags" => [
        [0] "_geoip_lookup_failure"				# 私网地址
    ],
        "request" => "/",
     "@timestamp" => 2022-09-17T13:30:05.178Z,
          "bytes" => "4833"
}
{
      "timestamp" => "17/Sep/2022:21:15:30 +0800",
       "response" => "200",
          "geoip" => {					# 解析的结果放在geoip中
         "country_code2" => "CM",
         "country_code3" => "CM",
          "country_name" => "Cameroon",
                    "ip" => "154.72.162.134",
              "timezone" => "Africa/Douala",
              "location" => {
            "lon" => 12.5,
            "lat" => 6.0
        },
        "continent_code" => "AF",
              "latitude" => 6.0,
             "longitude" => 12.5
    },
    "httpversion" => "1.1",
       "clientip" => "154.72.162.134",
           "verb" => "GET",
           "host" => "host3.test.com",
        "request" => "/",
     "@timestamp" => 2022-09-17T13:30:05.178Z,
          "bytes" => "4833"
}
4.5 useragent
用来解析浏览器的信息。前提是输出的信息有浏览器信息字段。
input {
  file {
    path => "/var/log/nginx/access.log*"
    start_position => "beginning"
  }
}

filter {

  grok {
    match => { "message" => "%{HTTPD_COMBINEDLOG}" }		# HTTPD_COMBINEDLOG可以解析浏览器
    remove_field => ["message","ident","auth","@version","path"]
  }

  useragent {
    source => "agent"							# 指定浏览器信息在哪个字段中,这个字段必须要存在
    target => "agent_test"						# 为了方便查看,将所有解析后的信息放到这个字段里面去
  }
}

output {
  stdout {}
}
得到的结果:
{
      "timestamp" => "17/Sep/2022:23:42:31 +0800",
       "response" => "404",
          "geoip" => {},
    "httpversion" => "1.1",
       "clientip" => "192.168.19.103",
           "verb" => "GET",
          "agent" => "\"Mozilla/5.0 (X11; Linux x86_64; rv:60.0) Gecko/20100101 Firefox/60.0\"",
           "host" => "host3.test.com",
        "request" => "/favicon.ico",
       "referrer" => "\"-\"",
     "@timestamp" => 2022-09-17T15:42:31.927Z,
          "bytes" => "3650",
     "agent_test" => {
          "major" => "60",
           "name" => "Firefox",
             "os" => "Linux",
        "os_full" => "Linux",
        "os_name" => "Linux",
        "version" => "60.0",
          "minor" => "0",
         "device" => "Other"
    }
}
{
{
...
     "agent_test" => {
          "major" => "60",
           "name" => "Firefox",
             "os" => "Linux",
        "os_full" => "Linux",
        "os_name" => "Linux",
        "version" => "60.0",
          "minor" => "0",
         "device" => "Other"
    }
}
{
...
     "agent_test" => {
          "os_minor" => "0",
           "os_full" => "iOS 16.0",
           "version" => "16.0",
          "os_major" => "16",
            "device" => "iPhone",
             "major" => "16",
              "name" => "Mobile Safari",
                "os" => "iOS",
        "os_version" => "16.0",
           "os_name" => "iOS",
             "minor" => "0"
    }
}
{
...
     "agent_test" => {
             "patch" => "3987",
           "os_full" => "Android 10",
           "version" => "80.0.3987.162",
          "os_major" => "10",
            "device" => "Samsung SM-G981B",
             "major" => "80",
              "name" => "Chrome Mobile",
                "os" => "Android",
        "os_version" => "10",
           "os_name" => "Android",
             "minor" => "0"
    }
}
4.6 mutate
- 切割自定的字段
input {
  stdin {}
}

filter {
  mutate {
    split => {
      message =>  " "		# 将message消息以空格作为分隔符进行分割
    }
    remove_field => ["@version","host"]
    add_field => {
      "tag" => "This a test field from Bruce"
    }
  }
}

output {
  stdout {}
}
111 222 333
{
           "tag" => "This a test field from Bruce",
       "message" => [
        [0] "111",
        [1] "222",
        [2] "333"
    ],
    "@timestamp" => 2022-09-18T08:07:36.373Z
}
- 将切割后的数据取出来
input {
  stdin {}
}

filter {
  mutate {
    split => {
      message =>  " "		# 将message消息以空格作为分隔符进行分割
    }
    remove_field => ["@version","host"]
    add_field => {
      "tag" => "This a test field from Bruce"
    }
  }
  mutate {
    add_field => {
      "name" => "%{[message][0]}"
      "age" => "%{[message][1]}"
      "sex" => "%{[message][2]}"
    }
  }
}

output {
  stdout {}
}
bruce 37 male
{
       "message" => [
        [0] "bruce",
        [1] "37",
        [2] "male"
    ],
           "age" => "37",
    "@timestamp" => 2022-09-18T08:14:31.230Z,
           "sex" => "male",
           "tag" => "This a test field from Bruce",
          "name" => "bruce"
}
- convert:将字段的值转换成不同的类型,例如将字符串转换成证书,如字段值是一个数组,所有成员都会被转换。如果该字段是散列,则不会采取任何动作
filter {
  mutate {
    convert => {
      "age" => "integer"			# 将age转换成数字类型
    }
  }
}
bruce 20 male
{
       "message" => [
        [0] "bruce",
        [1] "20",
        [2] "male"
    ],
           "sex" => "male",
          "name" => "bruce",
           "age" => 20,					# 没有引号,代表已经修改成数字类型了
    "@timestamp" => 2022-09-18T08:51:07.633Z,
           "tag" => "This a test field from Bruce"
}
- strip:剔除字段中的前导和尾随的空格
filter {
  mutate {
    strip => { "name","sex" }
  }
}
- rename:修改字段名
filter {
  mutate {
    rename => { "sex" => "agenda" }
  }
}
- replace:替换字段内容
filter {
  mutate {
    replace => { "tag" => "This is test message" }		# 修改了tag字段的内容
  }
}
update:用法和replace一样,区别在于如果字段存在则修改内容,如果过不存在则忽略此操作
uppercase/lowercase:转换成大写/小写;capitalize:首字母大写。转换的是字段内容
filter {
  mutate {
    uppercase => "tag"
    capitalize => "name"
  }
}
5 高级特性
5.1 判断语法
在input中打上标记后,可以在output和filter中通过判断语句来做区别化的处理
input {
  beats {
    port => 8888
    type => "nginx-beats"
  }
  tcp {
    port => 9999
    type => "tomcat-tcp"
  }
}

output {
  if [type] == "nginx-beats" {
    elasticsearch {
      hosts => ["192.168.19.101:9200","192.168.19.102:9200","192.168.19.103:9200"]
      index => "nginx-beats-elasticsearh-%{+YYYY.MM.dd}"
    }
  } else {
    elasticsearch {
      hosts => ["192.168.19.101:9200","192.168.19.102:9200","192.168.19.103:9200"]
      index => "tomcat-tcp-elasticsearh-%{+YYYY.MM.dd}"
  }
}
5.2 多实例运行
Logstash支持多实例运行,但是如果直接启动,第二个实例会报错,需要指定path.data的路径才能正常启动。
[root@host3 ~]# logstash -f 01-stdin-stdout.conf --path.data /tmp/logstash


![[Bug]使用Transformers 微调 Whisper出现版本不兼容的bug](https://img-blog.csdnimg.cn/direct/91f3f5876f9240a4aefe0851648dfbb6.png)