前言:
日志分析对于现代IT系统来说至关重要,它可以帮助组织机构理解和优化其业务和技术基础设施。以下是日志分析的一些重要性方面:
问题诊断与故障排除:
- 当系统发生故障或出现异常时,通过对相关日志进行分析,可以找到问题的根源,进行准确的定位。
- 日志数据提供了详细的上下文信息,帮助工程师更快地解决问题,提高故障处理效率。
性能监控与优化:
- 日志分析可以帮助企业了解系统的性能瓶颈,发现潜在的性能问题。
- 通过对日志数据的分析,可以找出影响系统性能的关键因素,为优化系统性能提供方向。
用户体验提升:
- 通过分析用户行为日志,企业可以了解用户的使用习惯和需求,为优化产品设计、提升用户体验提供依据。
- 对异常行为的分析还可以及时发现并处理恶意行为,保障用户权益。
安全审计与合规:
- 日志分析对于网络安全具有重要意义,通过网络日志的分析,IT管理员可以检测网络环境中的漏洞,并采取措施修补。
- 它可以帮助检测和预防安全威胁,比如入侵尝试、DDoS攻击等。
业务洞察与决策支持:
- 通过对日志数据的深入分析,可以提取出关键的信息和模式,了解用户行为、喜好和需求等,为产品和服务的优化提供有力的支持。
- 在电商行业,对用户购买行为的日志分析可以帮助企业更好地了解用户的购物偏好,提供个性化的推荐服务,从而提升用户体验和商业价值。
搜索引擎优化(SEO):
- 在SEO领域,日志分析特别重要,因为它可以帮助网站所有者理解搜索引擎蜘蛛的行为,比如爬取频率、爬取深度等。
- 分析日志可以帮助识别和修复404错误页面、死链等问题,确保网站符合搜索引擎的要求。
系统稳定性与可靠性:
- 日志分析有助于监控系统的健康状况,通过性能指标、服务状态和安全事件预警确保系统的稳定性。
- 它可以用于问题追踪,通过错误、访问和安全日志定位故障点。
合规性与法规遵循:
- 许多行业都有严格的日志记录和审计要求,以满足法规遵循的需求。
- 日志分析可以确保组织符合相关法律法规的要求,比如HIPAA、PCI-DSS等。
正文
本文架构信息:
- 架构信息:
EFK架构:Elasticsearch-7.13.3、Filebeat-7.13.3、Kinbana-7.13.3 - 服务器信息:
ubuntu16.04 服务3台: es-node1(kibana)、es-node2、es-node3
x86_64架构 - 软件信息
本文采用deb包部署软件包:
Elasticsearch: https://artifacts.elastic.co/downloads/elasticsearch/elasticsearch-7.17.3-amd64.deb
Filebeat: https://artifacts.elastic.co/downloads/beats/filebeat/filebeat-7.17.3-amd64.deb
Kibana: https://artifacts.elastic.co/downloads/kibana/kibana-7.17.3-amd64.deb
##如果需要tar包下载,选择对应的平台的tar包下载即可:
https://www.elastic.co/cn/downloads/past-releases/elasticsearch-7-17-3
https://www.elastic.co/cn/downloads/past-releases/filebeat-7-17-3
https://www.elastic.co/cn/downloads/past-releases/kibana-7-17-3
ELK Stack介绍
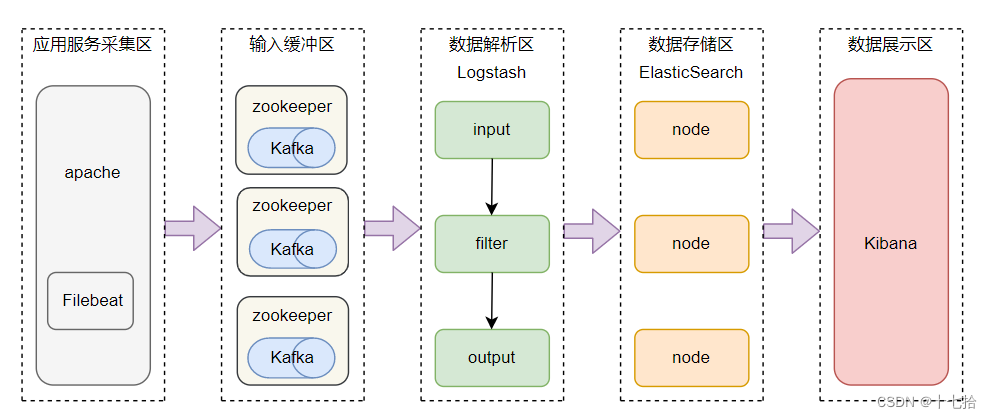
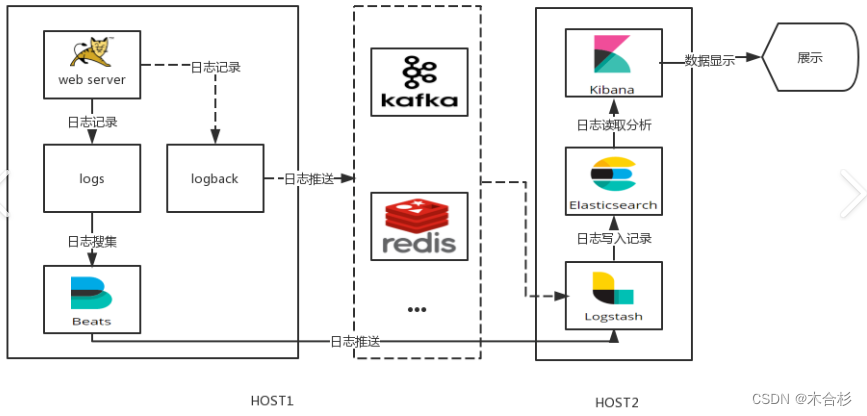
ELK Stack ELK Stack 是一个广泛使用的日志管理和分析平台,它由四个主要的组件组成:Elasticsearch、Kibana、Beats 和 Logstash。这些组件通常一起工作来提供一个完整的日志和数据流解决方案。有别于传统ELK架构,增加了Beats组件。
Elasticsearch:
- 分布式搜索和分析引擎,具有高可伸缩性、高可靠性和易于管理的特点。
- 基于 Apache Lucene 构建,能够对大量数据进行近乎实时的存储、搜索和分析操作。
- 作为基础搜索引擎,使应用程序具有复杂的搜索功能。
Logstash:
- 数据收集引擎,支持动态地从多种数据源收集数据。
- 能够对数据进行过滤、解析、丰富和格式化等操作。
- 将处理后的数据存储到 Elasticsearch 或其他指定位置。
Kibana:
- 数据分析和可视化平台,通常与 Elasticsearch 配合使用。
- 提供了用户友好的界面来进行数据探索、仪表板创建、图表制作等。
- 使用户能够对存储在 Elasticsearch 中的数据进行实时的可视化和分析。
Beats:
- 数据采集,Beats 可以采集各种类型的数据,包括日志文件(Filebeat)、网络数据(Packetbeat)、系统和服务的运行指标(Metricbeat)、Windows 事件日志(Winlogbeat)等。
- 数据转发,Beats 可以将采集到的数据发送到 Elasticsearch 进行索引,也可以发送到 Logstash 进行更复杂的处理。
- 轻量级,Beats 设计的目标是轻量级和低资源占用,因此它可以在所有类型的服务器上运行,甚至包括在 IoT 设备上。
- 易于扩展,Beats 提供了开发者指南,用户可以根据自己的需求编写自定义的 Beats
架构图
[外链图片转存失败,源站可能有防盗链机制,建议将图片保存下来直接上传(img-or6HiICT-1721659284556)(https://i-blog.csdnimg.cn/direct/8ef7fe80f1cf4ee5afa2c1e3aae1878a.png)]
部署
Elasticsearch安装
将已下载好的软件包放在/work/tools/目录下:
es-node1
root@xxxx:~# apt-get install /work/tools/elasticsearch-7.17.3-amd64.deb ##软件包部署,不需要单独部署jdk,部署路径/usr/share/elasticsearch/jdk
root@xxxx:~# systemctl cat elasticsearch.service ###通过此命令,可查看相关安装信息
# /usr/lib/systemd/system/elasticsearch.service
[Unit]
Description=Elasticsearch
Documentation=https://www.elastic.co
Wants=network-online.target
After=network-online.target
[Service]
Type=notify
RuntimeDirectory=elasticsearch
PrivateTmp=true
Environment=ES_HOME=/usr/share/elasticsearch
Environment=ES_PATH_CONF=/etc/elasticsearch
Environment=PID_DIR=/var/run/elasticsearch
Environment=ES_SD_NOTIFY=true
EnvironmentFile=-/etc/default/elasticsearch
WorkingDirectory=/usr/share/elasticsearch
User=elasticsearch
Group=elasticsearch
ExecStart=/usr/share/elasticsearch/bin/systemd-entrypoint -p ${PID_DIR}/elasticsearch.pid --quiet
# StandardOutput is configured to redirect to journalctl since
# some error messages may be logged in standard output before
# elasticsearch logging system is initialized. Elasticsearch
# stores its logs in /var/log/elasticsearch and does not use
# journalctl by default. If you also want to enable journalctl
# logging, you can simply remove the "quiet" option from ExecStart.
StandardOutput=journal
StandardError=inherit
# Specifies the maximum file descriptor number that can be opened by this process
LimitNOFILE=65535
# Specifies the maximum number of processes
LimitNPROC=4096
# Specifies the maximum size of virtual memory
LimitAS=infinity
# Specifies the maximum file size
LimitFSIZE=infinity
# Disable timeout logic and wait until process is stopped
TimeoutStopSec=0
# SIGTERM signal is used to stop the Java process
KillSignal=SIGTERM
# Send the signal only to the JVM rather than its control group
KillMode=process
# Java process is never killed
SendSIGKILL=no
# When a JVM receives a SIGTERM signal it exits with code 143
SuccessExitStatus=143
# Allow a slow startup before the systemd notifier module kicks in to extend the timeout
TimeoutStartSec=75
[Install]
WantedBy=multi-user.target
# Built for packages-7.17.3 (packages)
root@xxxx:~# cp /etc/elasticsearch/elasticsearch.yml /etc/elasticsearch/elasticsearch.yml_bk ###备份原始配置文件
root@xxxx:~# cat /etc/elasticsearch/elasticsearch.yml |grep -Ev "^$|^#" ###修改配置文件,其他配置文件暂时使用默认的
cluster.name: elk-cluster
node.name: es-node1
path.data: /var/lib/elasticsearch
path.logs: /var/log/elasticsearch
network.host: 0.0.0.0
http.port: 9200
discovery.seed_hosts: ["10.xx.xx.xx", "10.xx.xx.xx","10.xx.xx.xx"] ###更换成自己的节点IP
cluster.initial_master_nodes:["10.xx.xx.xx", "10.xx.xx.xx","10.xx.xx.xx"]
#node.attr.rack: rc 同机架感知,就是同一机房同一机架感知,主要是为了预防服务器在机房中同一机架,在高可用架构中,如果业务比较重要,需要考虑这个参数
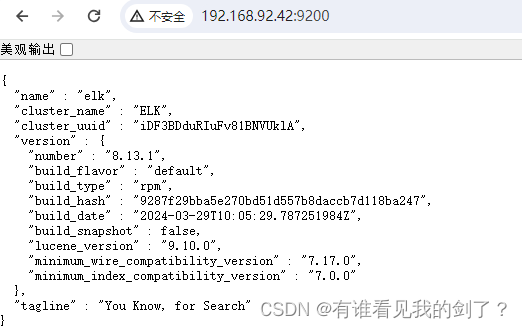
root@xxxx:~# systemctl start elasticsearch.service
root@xxxx:~# netstat -ntlp |grep java
tcp6 0 0 :::9300 :::* LISTEN 213048/java
tcp6 0 0 :::9200 :::* LISTEN 213048/java
[外链图片转存失败,源站可能有防盗链机制,建议将图片保存下来直接上传(img-M3hP0HNZ-1721659284558)(https://i-blog.csdnimg.cn/direct/300f355dc6554ac88200c4a44ad8ab49.png)]
es-node2
相对省略了一些步骤:
root@xxxx:~# apt-get install /work/tools/elasticsearch-7.17.3-amd64.deb

root@xxxx:~# cp /etc/elasticsearch/elasticsearch.yml  /etc/elasticsearch/elasticsearch.yml_bk   ###备份原始配置文件

root@xxxx:~#  cat /etc/elasticsearch/elasticsearch.yml  |grep -Ev "^$|^#"
cluster.name:  elk-cluster
node.name: es-node2
path.data: /var/lib/elasticsearch
path.logs: /var/log/elasticsearch
network.host: 0.0.0.0
http.port: 9200
discovery.seed_hosts: ["10.xx.xx.xx", "10.xx.xx.xx","10.xx.xx.xx"]      ###更换成自己的节点IP
cluster.initial_master_nodes:["10.xx.xx.xx", "10.xx.xx.xx","10.xx.xx.xx"]

root@xxxx:~# systemctl start  elasticsearch.service
[外链图片转存失败,源站可能有防盗链机制,建议将图片保存下来直接上传(img-lErLGIvf-1721659284559)(https://i-blog.csdnimg.cn/direct/2e67d346878349468383ecce4be72785.png)]
es-node3
root@xxxx:~# apt-get install /work/tools/elasticsearch-7.17.3-amd64.deb

root@xxxx:~# cp /etc/elasticsearch/elasticsearch.yml  /etc/elasticsearch/elasticsearch.yml_bk   ###备份原始配置文件

root@xxxx:~#  cat /etc/elasticsearch/elasticsearch.yml  |grep -Ev "^$|^#"
cluster.name:  elk-cluster
node.name: es-node3
path.data: /var/lib/elasticsearch
path.logs: /var/log/elasticsearch
network.host: 0.0.0.0
http.port: 9200
discovery.seed_hosts: ["10.xx.xx.xx", "10.xx.xx.xx","10.xx.xx.xx"]      ###更换成自己的节点IP
cluster.initial_master_nodes:["10.xx.xx.xx", "10.xx.xx.xx","10.xx.xx.xx"]

root@xxxx:~# systemctl start  elasticsearch.service
[外链图片转存失败,源站可能有防盗链机制,建议将图片保存下来直接上传(img-myH0yTGB-1721659284559)(https://i-blog.csdnimg.cn/direct/64f5414270d94062bd940f5b592f68d7.png)]
[外链图片转存失败,源站可能有防盗链机制,建议将图片保存下来直接上传(img-sGA7iagD-1721659284559)(https://i-blog.csdnimg.cn/direct/9886904b67a84bbeb7971a64052d8596.png)]
###知识点:
服务器启动两个java端口:9200、9300
- 9200:为集群外部提供服务,通过http协议,向集群外部提供交互;
- 9300:集群内各组件内部通信,使用tcp协议;
kibana安装
es-nod01将已下载好的软件包放在/work/tools/目录下:
root@xxxx:~# apt-get install /work/tools/kibana-7.17.3-amd64.deb

root@xxxx:~# systemctl start  kibana.service

root@xxxx:~# netstat  -ntlp |grep 5601
tcp        0      0 0.0.0.0:5601            0.0.0.0:*               LISTEN      213921/node
[外链图片转存失败,源站可能有防盗链机制,建议将图片保存下来直接上传(img-a91FhyUP-1721659284560)(https://i-blog.csdnimg.cn/direct/9da43653215048b4ba4a18973a3e3872.png)]
filebeat 安装
测试在es-nod01将已下载好的软件包放在/work/tools/目录下:
root@xxxx:~# apt-get install /work/tools/filebeat-7.17.3-amd64.deb

###配置文档使用默认
###filebeat知识点:
filebeat: 数据收集和传输
- input:指定数据采集源文件
- output:指定数据输出目的地
ELK数据采集
filebeat input参考文档: https://www.elastic.co/guide/en/beats/filebeat/7.17/filebeat-input-log.html
filebeat output参考文档:https://www.elastic.co/guide/en/beats/filebeat/7.17/configuring-output.html
output 之console模式:
参考文档:https://www.elastic.co/guide/en/beats/filebeat/7.17/console-output.html
root@xxxx:~# vim /etc/filebeat/config/01-log-to-console.yml
filebeat.inputs:
- type: log
  enable: true
  paths:
    - "/tmp/test.log"      ###指定输入log路径
  fields:      ###自定义字段(k:v)形式
    server: "test"
    zone: "CD"
  fields_under_root: false  ###将自定义的字段放到顶级字段,默认未false,将字段放入fields{k:v}
  tags: ["system","test"]   ###给当前输入类型打tag,多个tag,使用[],以,为分隔符

output.console:
  pretty: true   ###如果pretty设置为 true,则写入 stdout 的事件将被正确格式化。默认值为 false


root@xxxx:~#  filebeat  -e -c  /etc/filebeat/config/01-log-to-console.yml    ###截取部分输出
...............
{
  "@timestamp": "2024-07-22T12:55:23.947Z",
  "@metadata": {
    "beat": "filebeat",
    "type": "_doc",
    "version": "7.17.3"
  },
  "host": {
    "name": "ubuntu-xx-xx"
  },
  "agent": {
    "id": "ec5f8bca-1df4-4a76-964a-e46354bdc625",
    "name": "ubuntu-xx-xx",
    "type": "filebeat",
    "version": "7.17.3",
    "hostname": "ubuntu-xx-xx",
    "ephemeral_id": "e5d4e088-c161-4f6d-955b-4557d50db600"
  },
  "log": {
    "offset": 0,    ###详见下方注释
    "file": {
      "path": "/tmp/test.log"
    }
  },
  "message": "111",
  "tags": [
    "system",
    "test"
  ],
  "input": {
    "type": "log"
  },
  "fields": {   ###自定义字段,如果fields_under_root: true 会将字典中的key提升到和input相同的顶级字段
    "server": "test",
    "zone": "CD"
  },
  "ecs": {
    "version": "1.12.0"
  }
}
........................
###offset字段知识点:
offset 的作用
- 位置追踪:Filebeat 使用
offset来记住它在每个日志文件中的当前位置,这样即使 Filebeat 重启或系统重新启动后,它也可以从上次停止的地方继续读取数据。 - 持久化:
offset信息会保存在 Filebeat 的状态文件中,确保即使在中断之后也能恢复读取的位置。
如何工作:
- 初始状态:当 Filebeat 开始监控一个日志文件时,它会从文件的开头开始读取数据。此时,
offset设置为 0。 - 读取数据:Filebeat 会不断地读取新的日志条目,并更新
offset到最后读取的位置。 - 状态保存:Filebeat 会定期将当前的
offset写入到状态文件中。这通常是通过心跳机制来完成的,即每隔一段时间或每次读取一定数量的数据后更新状态文件。 - 恢复状态:如果 Filebeat 重启或系统重启,它会从状态文件中加载
offset信息,并从该位置继续读取数据。
配置选项:
配置文件:在 Filebeat 的配置文件中,你可以控制 offset 的行为,例如:
close_eof: 如果设置为true,则当 Filebeat 读取到文件末尾时,它会关闭对该文件的监控,并在文件重新打开时从头开始读取。scan_frequency: 控制 Filebeat 检查文件更改的频率,默认情况下,Filebeat 会每秒检查一次文件是否有更新。
文件路径
/var/lib/filebeat/registry/filebeat/log.json
root@xxxx:/var/lib/filebeat/registry/filebeat# cat log.json
{"op":"set","id":1}
{"k":"filebeat::logs::native::3937463-64768","v":{"id":"native::3937463-64768","type":"log","FileStateOS":{"device":64768,"inode":3937463},"timestamp":[2062532145022,1721652923],"ttl":-1,"identifier_name":"native","prev_id":"","source":"/tmp/test.log","offset":0}}
{"op":"set","id":2}
{"k":"filebeat::logs::native::3937463-64768","v":{"offset":26,"identifier_name":"native","id":"native::3937463-64768","source":"/tmp/test.log","ttl":-1,"type":"log","FileStateOS":{"inode":3937463,"device":64768},"prev_id":"","timestamp":[2062532533946,1721652924]}}
{"op":"set","id":3}
{"k":"filebeat::logs::native::3937463-64768","v":{"ttl":-1,"FileStateOS":{"inode":3937463,"device":64768},"source":"/tmp/test.log","offset":26,"timestamp":[2062532533946,1721652924],"type":"log","identifier_name":"native","id":"native::3937463-64768","prev_id":""}}
output 之 elasticsearch 模式:
output配置
参考文档:https://www.elastic.co/guide/en/beats/filebeat/7.17/elasticsearch-output.html
root@xxxx:/etc/filebeat/config# cat 01-log-to-es.yml
filebeat.inputs:
- type: log
  enable: true
  paths:
    - "/tmp/test.log"
  ####自定义字段(k:v)形式
  fields:
    server: "test"
    zone: "CD"
  ###将自定义的字段放到顶级字段,默认未false,将字段放入fields{k:v}
  fields_under_root: false
  ##给当前输入类型打波前
  tags: ["system","test"]

output.elasticsearch:
  enable: true
  hosts: ["http://10.xx.xx.xx:9200","http://10.xx.xx.xx:9200","http://10.xx.xx.xx:9200"]
  index: "web_server-%{+yyyy.MM.dd}"

#关闭所以生命周期管理,启用索引生命周期管理 (ILM)后,默认index值为 "filebeat-%{[agent.version]}-%{+yyyy.MM.dd}-%{index_num}",例如 。启用 ILM 后,"filebeat-7.17.22-2024-07-18-000001"自定义设置将被忽略
setup.ilm.enabled: false
##设置索引模板名称
setup.template.name: "web_server"
##设置index模板匹配的模式
setup.template.pattern: "web_server*"

root@xxxx:~# rm -rf /var/lib/filebeat/*        ###这个步骤只能在测试用,生产环境不要使用,清除历史收集信息,是日志从头开始读取

root@xxxx:~#  filebeat  -e -c  /etc/filebeat/config/01-log-to-es.yml    ####后续输出不在文中展示
kibana展示
进入管理页面
[外链图片转存失败,源站可能有防盗链机制,建议将图片保存下来直接上传(img-KYxfUDKF-1721659284560)(https://i-blog.csdnimg.cn/direct/3df54059a114480f827375b4adc9b8d3.png)]
索引管理
[外链图片转存失败,源站可能有防盗链机制,建议将图片保存下来直接上传(img-mf9tXscE-1721659284560)(https://i-blog.csdnimg.cn/direct/875aad6c9670426ab1d1424eeb27c2f1.jpeg)]
创建索引模式
[外链图片转存失败,源站可能有防盗链机制,建议将图片保存下来直接上传(img-3hYe2LEi-1721659284561)(https://i-blog.csdnimg.cn/direct/6f5c97277bbd4ed0b6e98322ec420f9c.jpeg)]
[外链图片转存失败,源站可能有防盗链机制,建议将图片保存下来直接上传(img-S21SuOQx-1721659284561)(https://i-blog.csdnimg.cn/direct/f693c7aa30ba4436bdd8a895d866cdb6.jpeg)]
日志查看
[外链图片转存失败,源站可能有防盗链机制,建议将图片保存下来直接上传(img-GRy1iRyr-1721659284562)(https://i-blog.csdnimg.cn/direct/4168dbdb585b4f189f8a25c716b88c3f.jpeg)]
[外链图片转存失败,源站可能有防盗链机制,建议将图片保存下来直接上传(img-Jc5P1UaQ-1721659284562)(https://i-blog.csdnimg.cn/direct/7a19ab74e09746bda7105460765138fa.png)]
###可以根据自己需求选择关键字,剩下更多功能,期待各位发现分享
案例分享
案例一
配置文件
filebeat.inputs:
####输入流类型
- type: log
####指定日志路径
  paths:
    - "/var/log/syslog"
####排除日志中包含"snapd和titanagent"的行
  exclude_lines: ['snapd',"titanagent"]
####打标签,可以作为帅选条件,但是比如fields字段灵活
  tags: ["systemlog"]
####定义字段;k:v形式,引用更加灵活,如果设fields_under_root=true,则将字段定义为顶级字段输出
  fields:
    OS: "ubuntu"
    log_type: "sys"
    services: "system"

- type: log
#  id: apahe2-01
  paths:
    - "/var/log/apache2/*_access.log"
  fields:
    OS: "ubuntu"
    log_type: "app"
    services: "apache2"
  tags: ["applog"]

###指定输出类型
output.elasticsearch:
###指定输出到es的主机信息
  hosts: ["http://10.xx.xx.xx:9200","http://10.xx.xx.xx:9200","http://10.xx.xx.xx:9200"]
#  index: "%{[fields.services]}-%{[host.name]}-%{+yyyy.MM.dd}"

###定义index
  indices:
#    - index: "%{[agent.hostname]}-%{[fields.log_type]}-%{+yyyy.MM.dd}"
    - index: "serverlog-%{[agent.hostname]}-sys-%{+yyyy.MM.dd}"
###设置条件,满足条件这使用上面定义的index格式
      when.contains:
        fields:
          log_type: "sys"

    - index: "serverlog-%{[agent.hostname]}-app-%{+yyyy.MM.dd}"
      when.contains:
        fields:
          log_type: "app"


###使用Elasticsearch 中的索引生命周期管理(ILM) 功能来管理 Filebeat 索引,启用索引生命周期管理 (ILM)后,默认index值为 "filebeat-%{[agent.version]}-%{+yyyy.MM.dd}-%{index_num}",例如 。启用 ILM 后,"filebeat-7.17.22-2024-07-11-000001"自定义设置将被忽略,这是个要注意
setup.ilm.enabled: false

##设置index模板启用
setup.template.enable: false
##设置index模板名字
setup.template.name: "serverlog"
setup.template.pattern: "serverlog*"
遇到问题
1.setup.template.name: “%{[host.name]}”,模板名字似乎不支持变量,变量的格式%"{[var]}"
使用变量有报错:
#Connection marked as failed because the onConnect callback failed: error loading template: error creating template instance: key not found
2.在配置indices,把when.contains,配置成:when.fields,错误修改了固定格式,导致日志收集报错
报错如下:
Exiting: error initializing publisher: missing or invalid condition
排错思路:
当运行使用filebeat test config -c /xxxx/xx.yml检查配置文件书写格式报Exiting: error initializing publisher: missing or invalid condition时:
1.确定是否是字符写错或者yml格式有错,配置文件在https://www.elastic.co/guide/en/beats/filebeat/7.17/ 官网有相应的模板,建议可以直接复制粘贴修改;
2.注释相应的参数,确定那个字段部分存在错误,最终定位到indices部分配置有误,在配置indices,把when.contains,配置成:when.fields,错误修改了固定格式,导致日志收集报错
案例二:nginx日志拆分
概述:nginx 日志拆分方案主要为:
1.修改原生日志为json格式
2.借助filebat模块处理
3.引入logstash
配置文件
nginx: /etc/nginx/nginx.conf
                 log_format nginx_outlog_josn '{"@timestamp":"$time_iso8601",'
                               '"host":"$server_addr",'
                               '"clientip":"$remote_addr",'
                               '"size":"$body_bytes_sent",'
                               '"responsetime":"$request_time",'
                               '"upstreamtime":"$upstream_response_time",'
                               '"upstreamhost":"$upstream_addr",'
                               '"http_host":"$host",'
                               '"uri":"$uri",'
                               '"domain":"$host",'
                               '"xff":"$http_x_forwarded_for",'
                               '"referer":"$http_referer",'
                               '"tcp_xff":"$proxy_protocol_addr",'
                               '"http_user_agent":"$http_user_agent",'
                               '"status":"$status"}';
                 access_log /var/log/nginx/access.log nginx_outlog_josn;
filebeat:
/etc/filebeat/config/nginx-log.yaml
filebeat.inputs:
- type: log
  paths:
    - "/var/log/nginx/access.log"
  tags: ["access"]
  json.keys_under_root: true
  json.add_error_key: true

output.elasticsearch:
  hosts: ["http://10.xx.xx.xx:9200","http://10.xx.xx.xx:9200","http://10.xx.xx.xx:9200"]
  index: "ubuntu-8-136-nginx-access-%{+yyyy.MM.dd}"

setup.ilm.enabled: false
setup.template.name: "ubuntu-xx-xx-nginx"
setup.template.pattern: "ubuntu-xx-xx-nginx*"
setup.template.overwrite: false
setup.template.settings:
  index.number_of_shards: 3    ###设置主分片
  index.number_of_replicas: 1   ###设置副本分片

####https://www.elastic.co/guide/en/beats/filebeat/7.17/filebeat-input-log.html
遇到问题
2024-07-20T21:02:19.706+0800    ERROR   [reader_json]   readjson/json.go:74     Error decoding JSON: invalid character ',' in numeric literal
2024-07-20T21:02:19.706+0800    INFO    [input.harvester]       log/harvester.go:309    Harvester started for paths: [/var/log/nginx/access.log*]       {"input_id": "ad197483-7a98-47ec-bd14-fa0db45082aa", "source": "/var/log/nginx/access.log.1", "state_id": "native::3675790-64768", "finished": false, "os_id": "3675790-64768", "harvester_id": "25d97abb-6ef6-4371-9d39-2ef9464c255a"}
2024-07-20T21:02:19.707+0800    ERROR   [reader_json]   readjson/json.go:74     Error decoding JSON: json: cannot unmarshal number into Go value of type map[string]interface {}
2024-07-20T21:02:19.707+0800    INFO    [input.harvester]       log/harvester.go:309    Harvester started for paths: [/var/log/nginx/access.log*]       {"input_id": "ad197483-7a98-47ec-bd14-fa0db45082aa", "source": "/var/log/nginx/access.log.2.gz", "state_id": "native::3672740-64768", "finished": false, "os_id": "3672740-64768", "harvester_id": "152988e0-eb67-4f80-b972-a962dc403dcc"}
2024-07-20T21:02:19.707+0800    ERROR   [reader_json]   readjson/json.go:74     Error decoding JSON: invalid character '\x1f' looking for beginning of value
2024-07-20T21:02:19.707+0800    ERROR   [reader_json]   readjson/json.go:74     Error decoding JSON: invalid character 'E' looking for beginning of value
2024-07-20T21:02:19.707+0800    INFO    [input.harvester]       log/harvester.go:309    Harvester started for paths: [/var/log/nginx/access.log*]       {"input_id": "ad197483-7a98-47ec-bd14-fa0db45082aa", "source": "/var/log/nginx/access.log.3.gz", "state_id": "native::3676152-64768", "finished": false, "os_id": "3676152-64768", "harvester_id": "9a5c52a6-19b2-40fc-886a-5daca4f7ac84"}
2024-07-20T21:02:19.707+0800    INFO    [input.harvester]       log/harvester.go:309    Harvester started for paths: [/var/log/nginx/access.log*]       {"input_id": "ad197483-7a98-47ec-bd14-fa0db45082aa", "source": "/var/log/nginx/access.log.4.gz", "state_id": "native::3675705-64768", "finished": false, "os_id": "3675705-64768", "harvester_id": "e52b7ab0-16af-4499-b234-b22f963b6b94"}
2024-07-20T21:02:19.707+0800    ERROR   [reader_json]   readjson/json.go:74     Error decoding JSON: invalid character '\x1f' looking for beginning of value
2024-07-20T21:02:19.707+0800    ERROR   [reader_json]   readjson/json.go:74     Error decoding JSON: invalid character 'Â' looking for beginning of value
2024-07-20T21:02:19.707+0800    ERROR   [reader_json]   readjson/json.go:74     Error decoding JSON: invalid character 'I' looking for beginning of value
排错思路:
根具报错判读和字符有关;
1.查看log输出格式:
root@xxxx:~#  cat /var/log/nginx/access.log
{"@timestamp":"2024-07-20T20:52:09+08:00","host":"10.25.xx.xx","clientip":"10.17.xx.xx","size":0,"responsetime":0.000,"upstreamtime":-,"upstreamhost":"-","http_host":"10.25.xx.xx","uri":"/index.png","domain":"10.25.xx.xx","xff":"-","referer":"-","tcp_xff":"","http_user_agent":"Mozilla/5.0 (Windows NT 10.0; Win64; x64) AppleWebKit/537.36 (KHTML, like Gecko) Chrome/121.0.0.0 Safari/537.36","status":"304"}
发现日志中“-”输出缺少引号,“upstreamtime”:-,使用nginx 语法检查是检测不出来的,所以希望大家注意下 ;
2.变量中加上引号发现还是有报错,所以尝试注释key存在或者值中有特殊字符参数,最终发现是由key “@timestamp"中的@引起,去掉之后重启nginx成功
知识分享
es分片:
es为集群为每个节点定义了分片编号如:xxx-0 、xxx-1、xxx-2,通过路由计算(路由计算:hash(_id ) % 分片数量=等于分片编号 )得到index写入哪个个节点,扩容节点会扩展分片编号,只要主分片的数量没有改变,那么不会影响数据的读写,所以当生产环境中确定主分片数量后,不要修改,不然会导致读取或者写入分片编号混乱;(需要思考问题,分片数量大于节点数量,es如何定义分片编号)
分片数量确定后不可修改,推介设置为10;(如果修改了分片数据,对应计算方式变化,导致读取写入数据的分片编号变化,数据读写异常);副本数量可以修改,但是数量不能大于或者等于es节点数量,否则会有副本分片读取异常,即kibana运行状态为黄色
主分片和副本分片区别: 主分片可读写;副本分片只读
怎么修改分片数量:
1.启用index模板
2.设置主分片数量,和副本分片数量,
setup.ilm.enabled: false
setup.template.enable: true
setup.template.name: "ubuntu-xx-xxxx"
setup.template.pattern: "ubuntu-xx-xxxx*"
setup.template.overwrite: false   ##是否覆盖已经存在的索引模板
setup.template.settings:
  index.number_of_shards: 5  ##设置主分片数量
  index.number_of_replicas: 2  ##设置副本分片数量
[外链图片转存失败,源站可能有防盗链机制,建议将图片保存下来直接上传(img-yNwZIhAw-1721659284562)(https://i-blog.csdnimg.cn/direct/ab53cbea4c74421998b9295cf85c9beb.png)]
[外链图片转存失败,源站可能有防盗链机制,建议将图片保存下来直接上传(img-Itee1lxb-1721659284563)(https://i-blog.csdnimg.cn/direct/64ecf12fba844bbea71fec931b81a447.png)]
[外链图片转存失败,源站可能有防盗链机制,建议将图片保存下来直接上传(img-5M7RMxic-1721659284563)(https://i-blog.csdnimg.cn/direct/e14e4d6e12514709ae0dd157d6b2667f.png)]
es01
[外链图片转存失败,源站可能有防盗链机制,建议将图片保存下来直接上传(img-nLy5dSFT-1721659284564)(https://i-blog.csdnimg.cn/direct/7ae66709ec854164ae72134c6360bce6.png)]
es02:
[外链图片转存失败,源站可能有防盗链机制,建议将图片保存下来直接上传(img-eW13bc5B-1721659284564)(https://i-blog.csdnimg.cn/direct/e09919cca0424ed7a2c1cecbf1804ca4.png)]
es03:
[外链图片转存失败,源站可能有防盗链机制,建议将图片保存下来直接上传(img-Ov9Q2KH7-1721659284564)(https://i-blog.csdnimg.cn/direct/47f230bc7b3b48d98d37438da4128828.png)]
kibana运行状态
运行状态有三种:红色、黄色、绿色
- 红色:集群的主分片不能正常访问;
- 黄色:集群部分副本分片未正常使用;
- 绿色:集群的主分片和副本可正常访问
[外链图片转存失败,源站可能有防盗链机制,建议将图片保存下来直接上传(img-n87WHOaV-1721659284565)(https://i-blog.csdnimg.cn/direct/7dc35414427946a2956dfda7491c4bc6.png)]
三大组件的补充知识
1. filebeat: 数据收集和传输
- input:指定数据采集源文件
- output:指定数据输出目的地
2.es:数据存储、查询、分析
- index(索引):数据逻辑存储名称;类似于mysql中的database概念
- 主分片:一个索引至少有一个或者是多个分片,读写
- 副本分片:主分片的备份,只读,一个副本分片至少有0个或者多个副本,但是不能不能大于或等于es集群几点数量;
3.kibana:数据展示
- 创建索引模板匹配es上的索引;(删除了索引模板,不会删除索引)
- 创建索引模式时至少匹配一个或者多个索引