1、3D表面形状的绘制
from mpl_toolkits.mplot3d import Axes3D
import matplotlib.pyplot as plt
import numpy as np
import matplotlib as mpl

fig=plt.figure()
ax=fig.add_subplot(111,projection='3d')

u=np.linspace(0,2*np.pi,100)
v=np.linspace(0,np.pi,100)
x=10*np.outer(np.cos(u),np.sin(v))
y=10*np.outer(np.sin(u),np.cos(v))
z=10*np.outer(np.ones(np.size(u)),np.cos(v))

ax.plot_surface(x,y,z,color='r')

plt.show()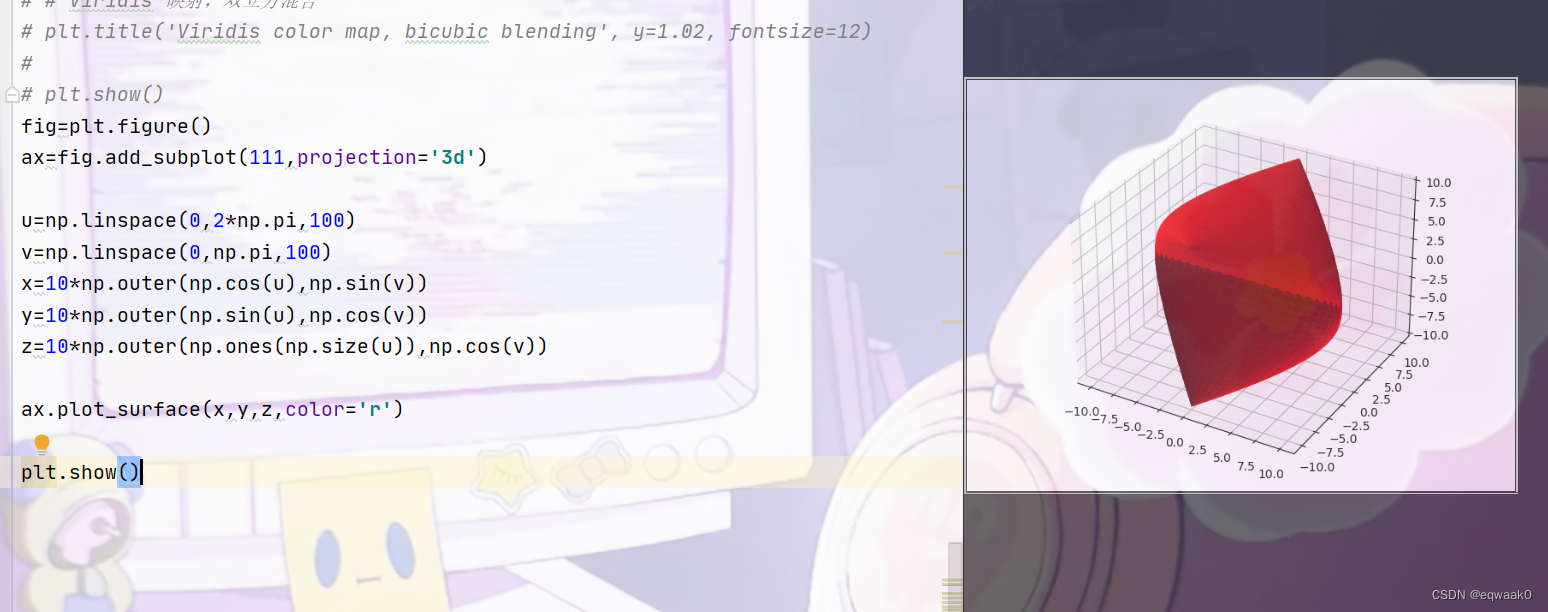
2.绘制3D线和3D点的示例
from mpl_toolkits import mplot3d
import matplotlib.pyplot as plt
import numpy as np
import matplotlib as mpl
import random

fig = plt.figure()
ax = plt.axes(projection="3d")
z_line = np.linspace(0, 15, 1000)
x_line = np.cos(z_line)
y_line = np.sin(z_line)
ax.plot3D(x_line, y_line, z_line, ‘gray’)

z_points = 15 * np.random.random(100)
x_points = np.cos(z_points) + 0.1 * np.random.randn(100)
y_points = np.sin(z_points) + 0.1 * np.random.randn(100)
ax.scatter3D(x_points, y_points, z_points, c=z_points, cmap=’hsv’);

plt.show()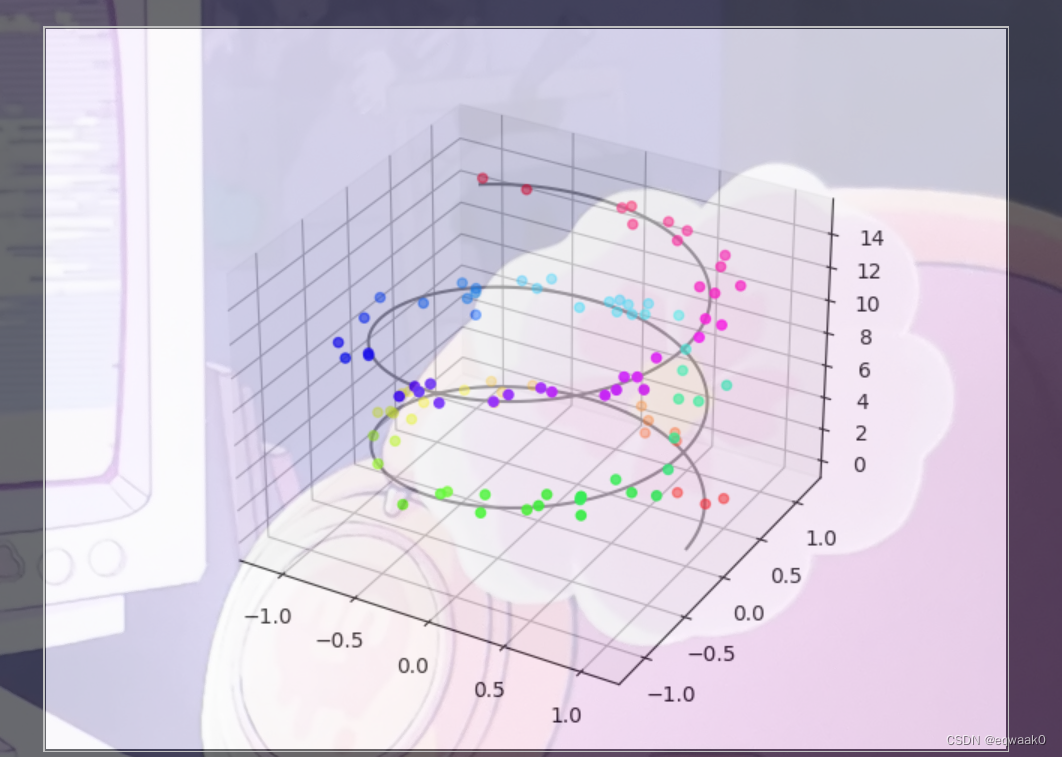
3.曲面图[Surface图]
from mpl_toolkits import mplot3d
import matplotlib.pyplot as plt
import numpy as np
import matplotlib as mpl
import random

fig=plt.figure()
ax=plt.axes(projection="3d")
def z_function(x,y):
    return np.sin(np.sqrt(x**2+y**2))
x=np.linspace(-6,6,30)
y=np.linspace(-6,6,30)

X,Y=np.meshgrid(x,y)
Z=z_function(X,Y)
ax.plot_wireframe(X,Y,Z,color='green')
ax.set_xlabel('x')
ax.set_xlabel('y')
ax.set_xlabel('z')

plt.show() 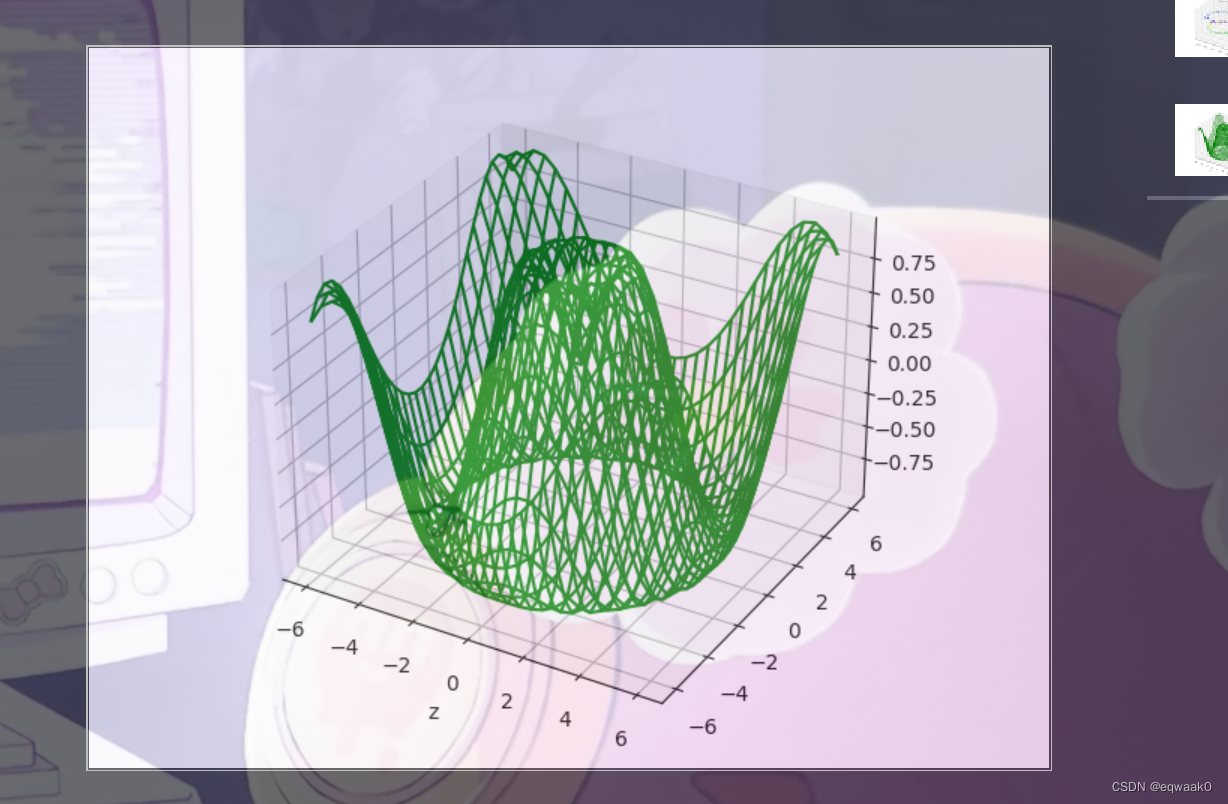
(2)添加方法:
from mpl_toolkits import mplot3d
import matplotlib.pyplot as plt
import numpy as np
import matplotlib as mpl
import random

fig=plt.figure()
ax=plt.axes(projection="3d")
def z_function(x,y):
    return np.sin(np.sqrt(x**2+y**2))
x=np.linspace(-6,6,30)
y=np.linspace(-6,6,30)

X,Y=np.meshgrid(x,y)
Z=z_function(X,Y)
ax.plot_wireframe(X,Y,Z,color='green')
ax.set_xlabel('x')
ax.set_xlabel('y')
ax.set_xlabel('z')

ax = plt.axes(projection='3d')
ax.plot_surface(X, Y, Z, rstride=1, cstride=1,
                cmap='winter', edgecolor='none')
ax.set_title('surface');

plt.show() 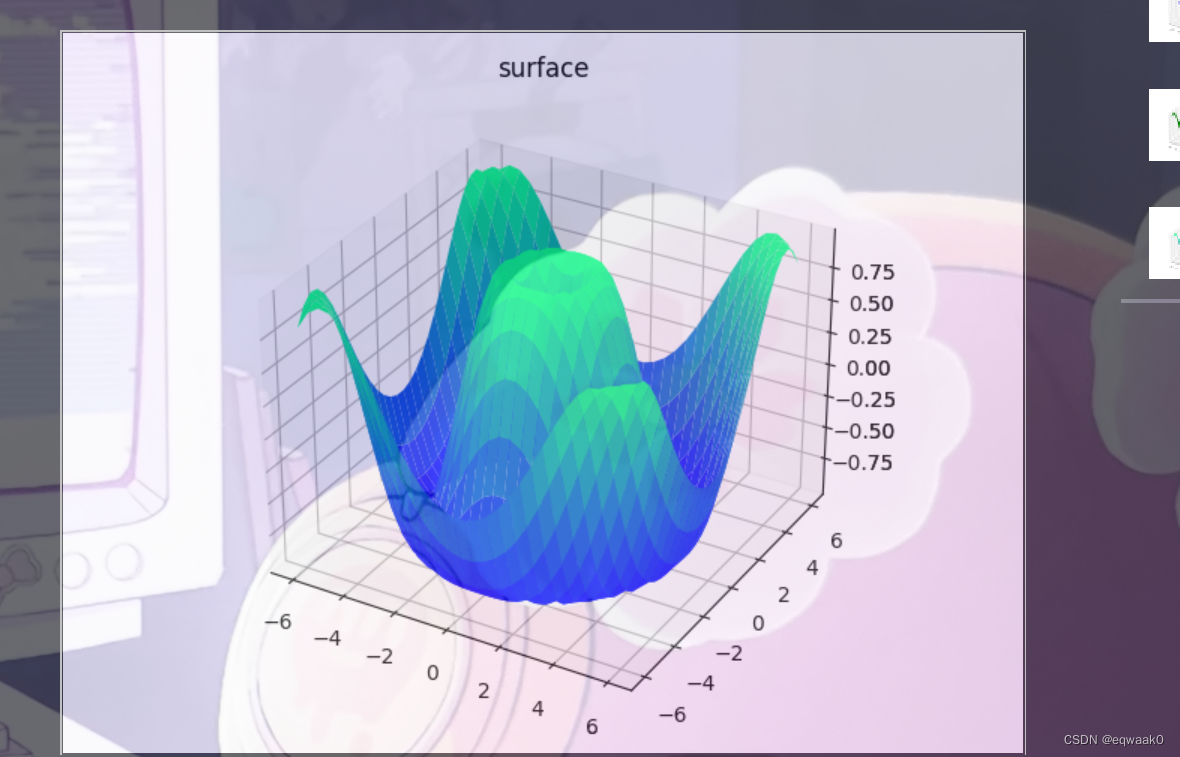
4.3D条形图[bar图]
from mpl_toolkits import mplot3d
import matplotlib.pyplot as plt
import numpy as np
import matplotlib as mpl
import random

fig = plt.figure()
ax1 = fig.add_subplot(111, projection='3d')
x3 = [1,2,3,4,5,6,7,8,9,10]
y3 = [5,6,7,8,2,5,6,3,7,2]
z3 = np.zeros(10)
dx = np.ones(10)
dy = np.ones(10)
dz = [1,2,3,4,5,6,7,8,9,10]
ax1.bar3d(x3, y3, z3, dx, dy, dz)
ax1.set_xlabel('x axis')
ax1.set_ylabel('y axis')
ax1.set_zlabel('z axis')
plt.show()