Prometheus配置文件与核心功能
环境部署完成以后,我们就需要对产品进行稳定性监控。在知道怎么监控收集数据之前,我们需要知道prometheus的配置文件和核心功能
全局配置文件
首先我们从针对prometheus的全局文件进行说起,首先进入prometheus的存放的包的路径。以本文为例。
[root@localhost prometheus]# cd /ftp/Stability/prometheus
进入以后,通过ls命令是可以看到一个prometheus.yml的文件
[root@localhost prometheus]# ls
console_libraries  consoles  LICENSE  NOTICE  prometheus  prometheus.yml  promtool
然后打开配置文件,我们可以获取如下内容,重点内容注释详情如下红色标注部分,也可以参考官方文档中的配置文件说明:https://prometheus.io/docs/prometheus/latest/configuration/configuration/
[root@localhost prometheus]# cat prometheus.yml
# my global config
global:            ---全局配置
  scrape_interval:     15s      ---采集数据周期,默认情况下为1分钟 # Set the scrape interval to every 15 seconds. Default is every 1 minute.
  evaluation_interval: 15s  ---告警时间规则# Evaluate rules every 15 seconds. The default is every 1 minute.
  scrape_timeout: 10s     ---采集数据超时时间,请求超时时间# scrape_timeout is set to the global default (10s).

# Alertmanager configuration
alerting:     ---配置告警部门
  alertmanagers:
  - static_configs:
    - targets:
      # - alertmanager:9093

# Load rules once and periodically evaluate them according to the global 'evaluation_interval'.
rule_files:   ---制定监控告警的规则
  # - "first_rules.yml"
  # - "second_rules.yml"

  # The labels to add to any time series or alerts when communicating with
  # external systems (federation, remote storage, Alertmanager).
  external_labels:
    [ <labelname>: <labelvalue> ... ]    ---外部标签
# A scrape configuration containing exactly one endpoint to scrape:
# Here it's Prometheus itself.
scrape_configs:  ---配置被监控端
  # The job name is added as a label `job=<job_name>` to any timeseries scraped from this config.
  - job_name: 'prometheus'

    # metrics_path defaults to '/metrics'
    # scheme defaults to 'http'.

    static_configs:
- targets: ['localhost:9090']

# 远程写配置
remote_write:     ---制定远程读写
  - url: "http://localhost:9201/write"
  # 配置连接influxdb连接的用户名与密码
    basic_auth:
      username: DGAtest
      password: DGAtest123
# 远程读配置
remote_read:
  - url: "http://localhost:9201/read"
    basic_auth:
      username: DGAtest
      password: DGAtest123
其中scrape_configs和relabel_configs我们在实际工作中使用到的时候再进行详细说明。
基于文件的服务发现
针对被监控的对象,我们需要通过安装代理程序进行数据收集后定向的向prometheus发送收集到的数据,那如何发现这些被监控的对象呢?prometheus提供了多种基于文件的服务发现方法。
| 发现方法 | 发现方法 |
|---|---|
| azure_sd_configs | consul_sd_configs |
| dns_sd_configs | ec2_sd_configs |
| openstack_sd_configs | file_sd_configs |
| gce_sd_configs | kubernetes_sd_configs |
| marathon_sd_configs | marathon_sd_configs |
| nerve_sd_configs | triton_sd_configs |
| 而在实际工作中,我们主要使用上述的file_sd_configs以及在K8S中使用的kubernetes_sd_configs进行服务发现的功能。 |
6.3. file_sd_configs配置
因为在实际工作中我们暂时还未用到K8S相关技术,所以kubernetes_sd_configs的后续进行不充,本文目前只要重点介绍file_sd_configs。
主要配置步骤如下:
首先我们需要进入prometheus程序所在目录
[root@Storage prometheus-2.25.0.linux-amd64]# cd /usr/local/prometheus/prometheus
打开prometheus.yml文件,在linux中找到scrape_configs:那行配置,然后增加对应的内容如下。
scrape_configs:
  # The job name is added as a label `job=<job_name>` to any timeseries scraped from this config.
  - job_name: 'LinuxSystemBase'
    file_sd_configs:
      - files: ['/ftp/Stability/prometheus/conf/LinuxSystemBase.yml']
        refresh_interval: 5s
--- 读取对应路径下的文件配置,获取监控数据
配置完成文件以后,我们再在对应的路径下使用命令打开文件进行配置
[root@localhost conf]# vi LinuxSystemBase.yml
然后输入以下内容:
- targets: ['10.XX.XX.20:9090']
  labels:
    group: PTest
配置完成以后可以在prometheus的部署的路径下可以对文件进行文件的校验
[root@localhost prometheus]# ./promtool check config prometheus.yml
Checking prometheus.yml
  SUCCESS: 0 rule files found
注意:配置文件严格按照yml格式进行。
配置完成以后,可以用两种方法对让配置文件生效。
方法1:
[root@localhost prometheus]# systemctl restart Prometheus
方法2:
[root@localhost prometheus]# ps -ef|grep prometheus
root      31163      1  3 Mar19 ?        02:13:25 /ftp/Stability/prometheus/prometheus --config.file=/ftp/Stability/prometheus/prometheus.yml
root      31508      1  0 Mar19 ?        00:05:50 ./remote_storage_adapter --influxdb-url=http://127.0.0.1:8086/ --influxdb.database=prometheus --influxdb.retention-policy=autogen
root     175368 164127  0 14:03 pts/1    00:00:00 grep --color=auto prometheus
[root@localhost prometheus]# kill -hup 31163
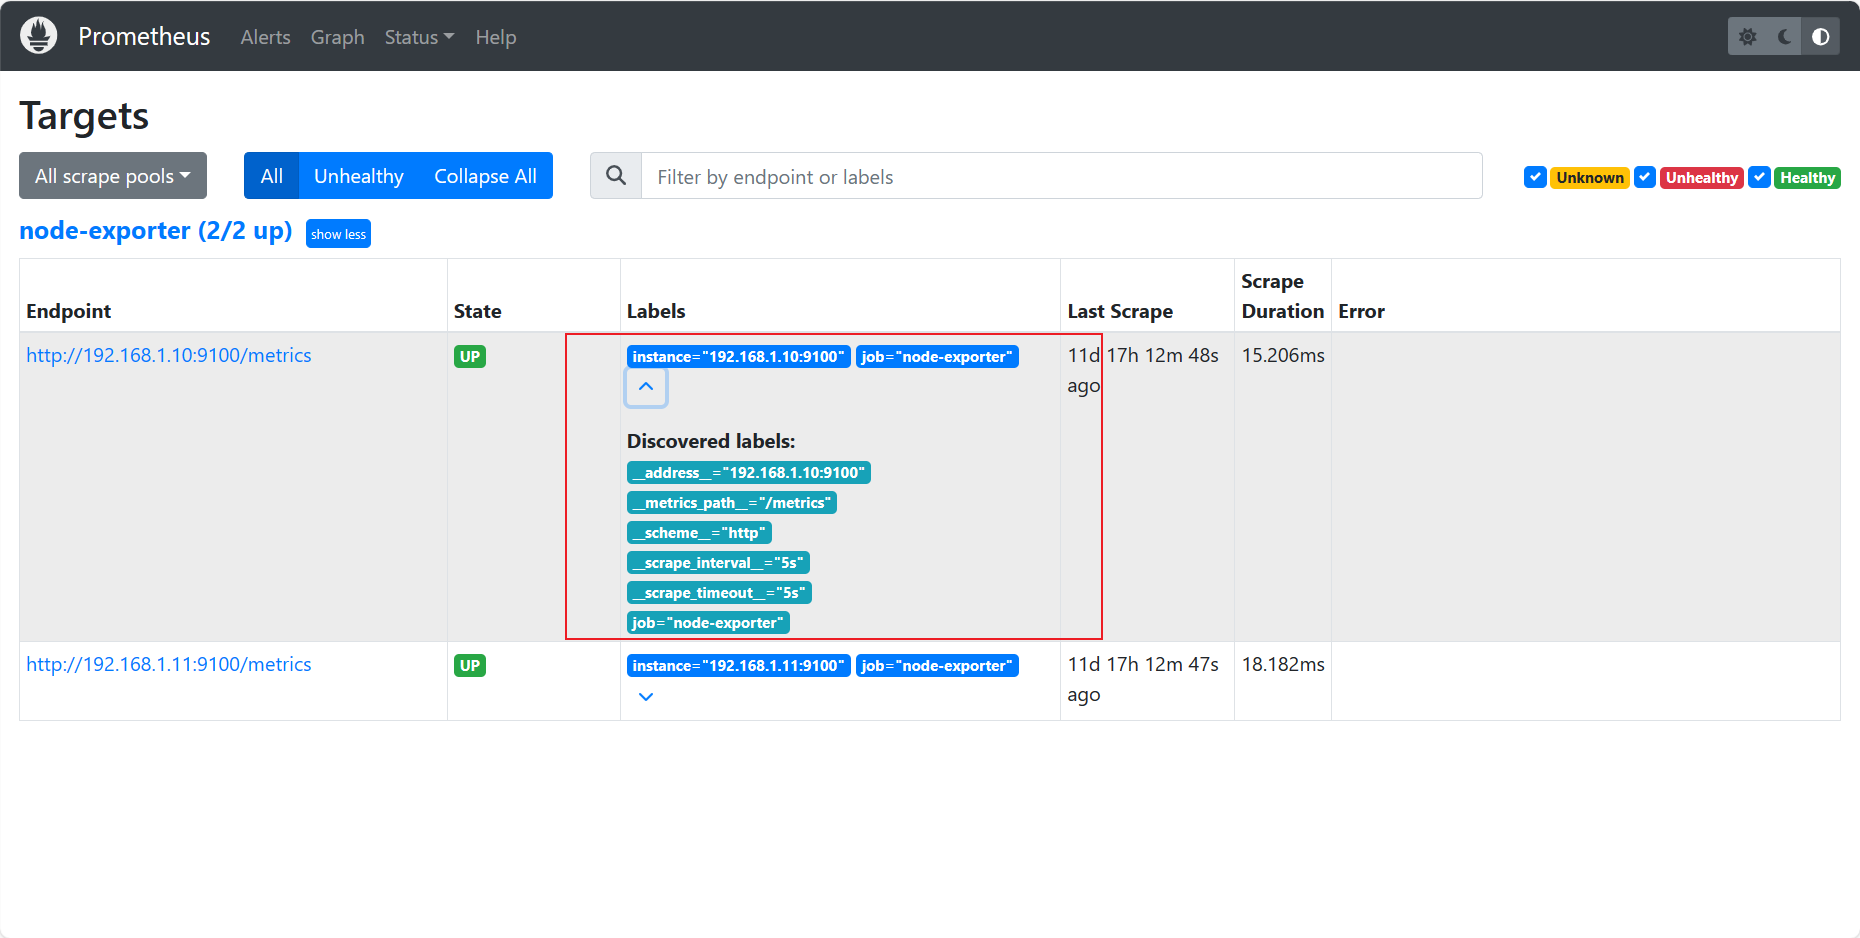
配置完成以后可以再Prometheus自己的界面中找到Target看到添加的信息。