官网demo地址:
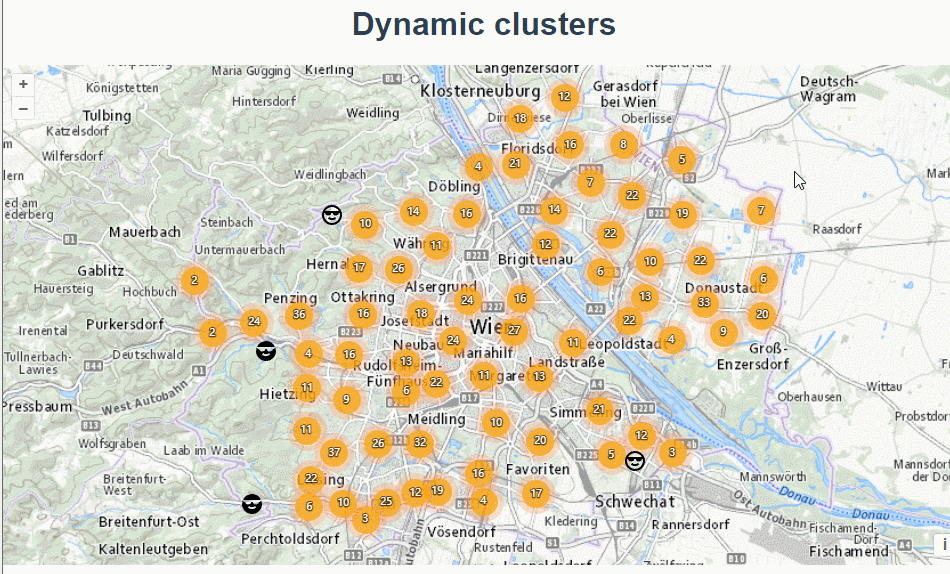
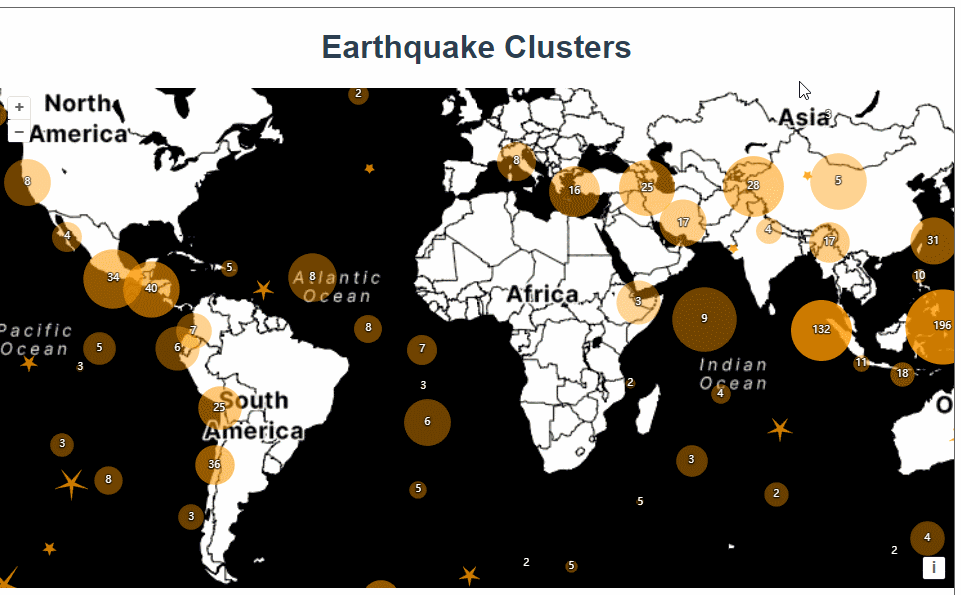
这篇展示了鼠标触摸聚合图层点位显示五角星的效果。
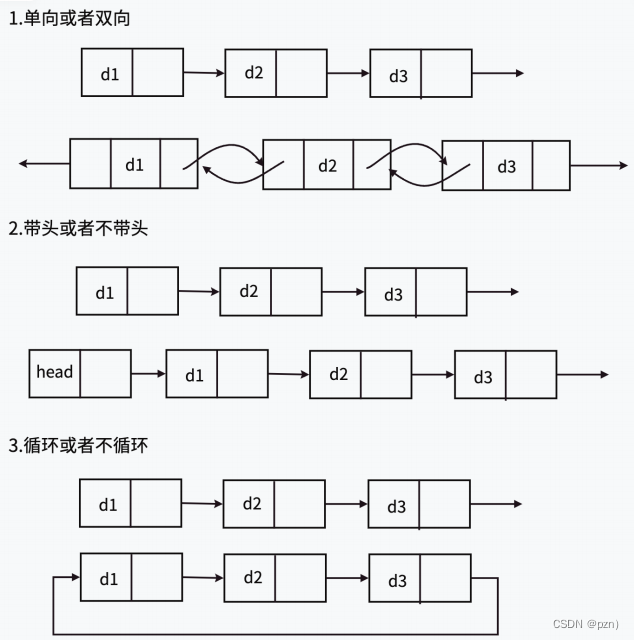
首先是初始化地图,加载了一个KML格式的矢量数据源,extractStyles为false表示不从kml数据源中提取样式。使用Select添加了鼠标选中的交互事件
vector = new VectorLayer({
      source: new Cluster({
        distance: 40,
        source: new VectorSource({
          url: "https://openlayers.org/en/latest/examples/data/kml/2012_Earthquakes_Mag5.kml",
          format: new KML({
            extractStyles: false,
          }),
        }),
      }),
      style: styleFunction,
    });
    const raster = new TileLayer({
      source: new StadiaMaps({
        layer: "stamen_toner",
      }),
    });
const map = new Map({
      layers: [raster, vector],
      interactions: defaultInteractions().extend([
        new Select({
          condition: function (evt) {
            return evt.type == "pointermove" || evt.type == "singleclick";
          },
          style: selectStyleFunction,
        }),
      ]),
      target: "map",
      view: new View({
        center: [0, 0],
        zoom: 2,
      }),
    });
其中有两个样式函数,先来看第一个styleFunction。
如果有子feature就显示为黄色圆圈,如果没有子feature则绘制成五角星。
 let currentResolution;
    function styleFunction(feature, resolution) {
      if (resolution != currentResolution) {
        calculateClusterInfo(resolution);
        currentResolution = resolution;
      }
      let style;
      const size = feature.get("features").length;
      if (size > 1) {
        style = new Style({
          image: new CircleStyle({
            radius: feature.get("radius"),
            fill: new Fill({
              color: [255, 153, 0, Math.min(0.8, 0.4 + size / maxFeatureCount)],
            }),
          }),
          text: new Text({
            text: size.toString(),
            fill: textFill,
            stroke: textStroke,
          }),
        });
      } else {
        const originalFeature = feature.get("features")[0];
        style = createEarthquakeStyle(originalFeature);
      }
      return style;
    }
使用calculateClusterInfo 函数计算圆圈的半径,将子feature的extent合并到了一起,结合分辨率算出半径。
const calculateClusterInfo = function (resolution) {
      maxFeatureCount = 0;
      const features = vector.getSource().getFeatures();
      let feature, radius;
      for (let i = features.length - 1; i >= 0; --i) {
        feature = features[i];
        const originalFeatures = feature.get("features");
        const extent = createEmpty(); //创建一个空的范围对象,用来存储聚类的总范围。
        let j, jj;
        for (j = 0, jj = originalFeatures.length; j < jj; ++j) {
        //获取当前原始特征的几何范围。将这个几何范围合并到总范围 extent 中
          extend(extent, originalFeatures[j].getGeometry().getExtent());
        }
        maxFeatureCount = Math.max(maxFeatureCount, jj);
        radius = (0.25 * (getWidth(extent) + getHeight(extent))) / resolution;
        feature.set('radius',radius)
      }
    };
extend方法示例
假设你有一个聚类包含三个特征,其范围分别为:
- 特征1:
[0, 0, 1, 1] - 特征2:
[2, 2, 3, 3] - 特征3:
[1, 1, 4, 4]
通过逐步扩展 extent:
- 初始
extent是空的。 - 扩展第一个特征后,
extent变为[0, 0, 1, 1]。 - 扩展第二个特征后,
extent变为[0, 0, 3, 3]。 - 扩展第三个特征后,
extent变为[0, 0, 4, 4]。
最终的 extent 包含了所有特征的范围,即 [0, 0, 4, 4]。
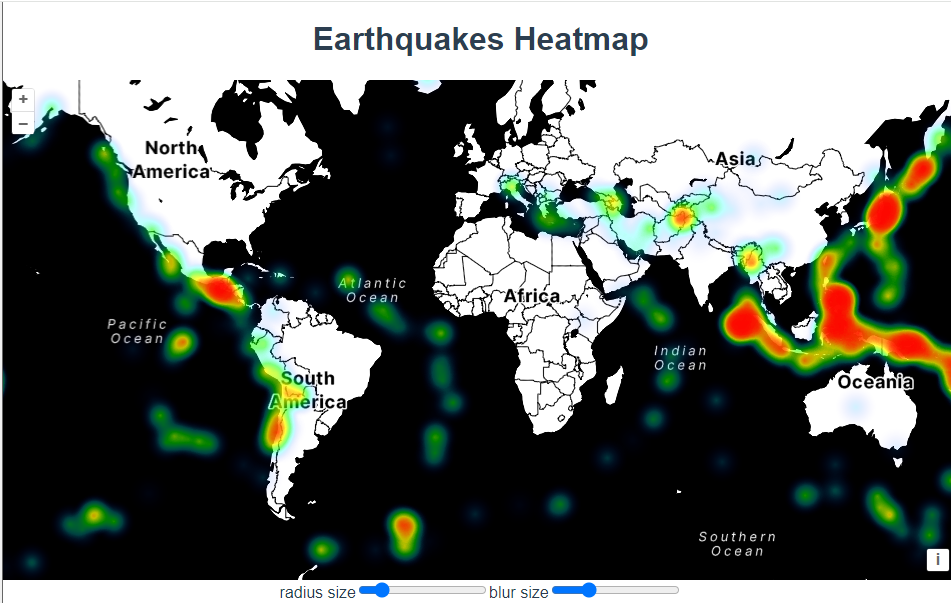
createEarthquakeStyle是绘制星星的方法,主要用了RegularShape这个类。
function createEarthquakeStyle(feature) {
      const name = feature.get("name");
      const magnitude = parseFloat(name.substr(2));
      const radius = 5 + 20 * (magnitude - 5);
      return new Style({
        geometry: feature.getGeometry(),
        image: new RegularShape({
          radius: radius,
          radius2: 3,
          points: 5,
          angle: Math.PI,
          fill: earthquakeFill,
          stroke: earthquakeStroke,
        }),
      });
    }
写一个小demo来理解RegularShape
//小demo
    let piontArr = [-213399.46385070545, -7204129.9025042085];
    let pointFeature = new Feature({
      geometry: new MultiPoint([piontArr]),
    });
    let newLayer = new VectorLayer({
      source: new VectorSource({
        features: [pointFeature],
      }),
      style: [
        new Style({
          image: new RegularShape({
            radius: 50,
            radius2:20,
            points: 5,
            angle: Math.PI,
            fill: earthquakeFill,
            stroke: earthquakeStroke,
          }),
        }),
      ],
    });
    map.addLayer(newLayer)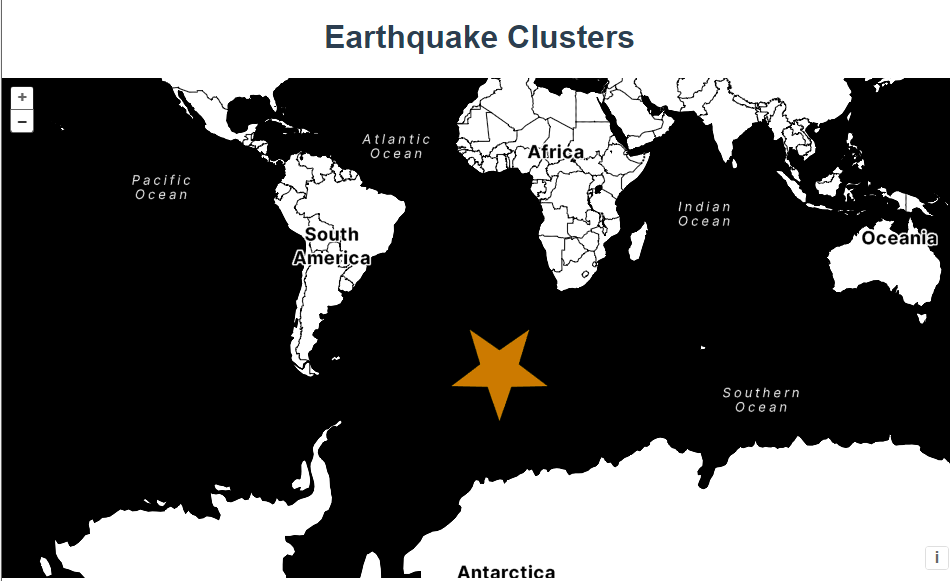
RegularShape参数解释:
radius:- 含义: 图形的外半径,即从图形中心到外顶点的距离。
radius2:- 含义: 图形的内半径,仅在绘制星形时有效。表示从图形中心到内顶点的距离。
points:- 含义: 图形的顶点数。如果
radius2被定义,则points表示星形的顶点数(外顶点和内顶点的总数),否则表示多边形的边数。 - 示例值:
6表示绘制一个六边形或六角星形。
- 含义: 图形的顶点数。如果
angle:- 含义: 图形的旋转角度,以弧度为单位。
Math.PI表示旋转 180 度。 - 示例值:
Math.PI表示图形旋转 180 度。
- 含义: 图形的旋转角度,以弧度为单位。
 然后是第二个样式函数selectStyleFunction
鼠标触摸的时候获取到feature自定义属性features取出来,把每一个子feature绘制成星星形状展示。
function selectStyleFunction(feature) {
      const styles = [
        new Style({
          image: new CircleStyle({
            radius: feature.get("radius"),
            fill: invisibleFill,
          }),
        }),
      ];
      const originalFeatures = feature.get("features");
      let originalFeature;
      for (let i = originalFeatures.length - 1; i >= 0; --i) {
        originalFeature = originalFeatures[i];
        styles.push(createEarthquakeStyle(originalFeature));
      }
      return styles;
    }
完整代码:
<template>
  <div class="box">
    <h1>Earthquake Clusters</h1>
    <div id="map"></div>
  </div>
</template>

<script>
import KML from "ol/format/KML.js";
import Map from "ol/Map.js";
import View from "ol/View.js";
import {
  Circle as CircleStyle,
  Fill,
  RegularShape,
  Stroke,
  Style,
  Text,
  Circle,
} from "ol/style.js";
import { MultiPoint, Point } from "ol/geom.js";
import { Cluster, StadiaMaps, Vector as VectorSource } from "ol/source.js";
import { Select, defaults as defaultInteractions } from "ol/interaction.js";
import { Tile as TileLayer, Vector as VectorLayer } from "ol/layer.js";
import { createEmpty, extend, getHeight, getWidth } from "ol/extent.js";
import Feature from "ol/Feature.js";
export default {
  name: "",
  components: {},
  data() {
    return {
      map: null,
    };
  },
  computed: {},
  created() {},
  mounted() {
    const earthquakeFill = new Fill({
      color: "rgba(255, 153, 0, 0.8)",
    });
    const earthquakeStroke = new Stroke({
      color: "rgba(255, 204, 0, 0.2)",
      width: 1,
    });
    const textFill = new Fill({
      color: "#fff",
    });
    const textStroke = new Stroke({
      color: "rgba(0, 0, 0, 0.6)",
      width: 3,
    });
    const invisibleFill = new Fill({
      color: "rgba(255, 255, 255, 0.01)",
    });

    function createEarthquakeStyle(feature) {
      const name = feature.get("name");
      const magnitude = parseFloat(name.substr(2));
      const radius = 5 + 20 * (magnitude - 5);
      return new Style({
        geometry: feature.getGeometry(),
        image: new RegularShape({
          radius: radius,
          radius2: 3,
          points: 5,
          angle: Math.PI,
          fill: earthquakeFill,
          stroke: earthquakeStroke,
        }),
      });
    }

    let maxFeatureCount;
    let vector = null;
    const calculateClusterInfo = function (resolution) {
      maxFeatureCount = 0;
      const features = vector.getSource().getFeatures();
      let feature, radius;
      for (let i = features.length - 1; i >= 0; --i) {
        feature = features[i];
        const originalFeatures = feature.get("features");
        const extent = createEmpty();
        let j, jj;
        for (j = 0, jj = originalFeatures.length; j < jj; ++j) {
          extend(extent, originalFeatures[j].getGeometry().getExtent());
        }
        maxFeatureCount = Math.max(maxFeatureCount, jj);
        radius = (0.25 * (getWidth(extent) + getHeight(extent))) / resolution;
        feature.set('radius',radius)
      }
    };

    let currentResolution;
    function styleFunction(feature, resolution) {
      if (resolution != currentResolution) {
        calculateClusterInfo(resolution);
        currentResolution = resolution;
      }
      let style;
      const size = feature.get("features").length;
      if (size > 1) {
        style = new Style({
          image: new CircleStyle({
            radius: feature.get("radius"),
            fill: new Fill({
              color: [255, 153, 0, Math.min(0.8, 0.4 + size / maxFeatureCount)],
            }),
          }),
          text: new Text({
            text: size.toString(),
            fill: textFill,
            stroke: textStroke,
          }),
        });
      } else {
        const originalFeature = feature.get("features")[0];
        style = createEarthquakeStyle(originalFeature);
      }
      return style;
    }

    function selectStyleFunction(feature) {
      const styles = [
        new Style({
          image: new CircleStyle({
            radius: feature.get("radius"),
            fill: invisibleFill,
          }),
        }),
      ];
      const originalFeatures = feature.get("features");
      let originalFeature;
      for (let i = originalFeatures.length - 1; i >= 0; --i) {
        originalFeature = originalFeatures[i];
        styles.push(createEarthquakeStyle(originalFeature));
      }
      return styles;
    }

    vector = new VectorLayer({
      source: new Cluster({
        distance: 40,
        source: new VectorSource({
          url: "https://openlayers.org/en/latest/examples/data/kml/2012_Earthquakes_Mag5.kml",
          format: new KML({
            extractStyles: false,
          }),
        }),
      }),
      style: styleFunction,
    });
    const raster = new TileLayer({
      source: new StadiaMaps({
        layer: "stamen_toner",
      }),
    });

    const map = new Map({
      layers: [raster,vector],
      interactions: defaultInteractions().extend([
        new Select({
          condition: function (evt) {
            return evt.type == "pointermove" || evt.type == "singleclick";
          },
          style: selectStyleFunction,
        }),
      ]),
      target: "map",
      view: new View({
        center: [0, 0],
        zoom: 2,
      }),
    });

    //小demo
    let piontArr = [-213399.46385070545, -7204129.9025042085];
    let pointFeature = new Feature({
      geometry: new MultiPoint([piontArr]),
    });
    let newLayer = new VectorLayer({
      source: new VectorSource({
        features: [pointFeature],
      }),
      style: [
        new Style({
          image: new RegularShape({
            radius: 50,
            radius2:20,
            points: 5,
            angle: Math.PI,
            fill: earthquakeFill,
            stroke: earthquakeStroke,
          }),
        }),
      ],
    });
    // map.addLayer(newLayer)
  },
  methods: {},
};
</script>

<style lang="scss" scoped>
#map {
  width: 100%;
  height: 500px;
}
.box {
  height: 100%;
}
</style>