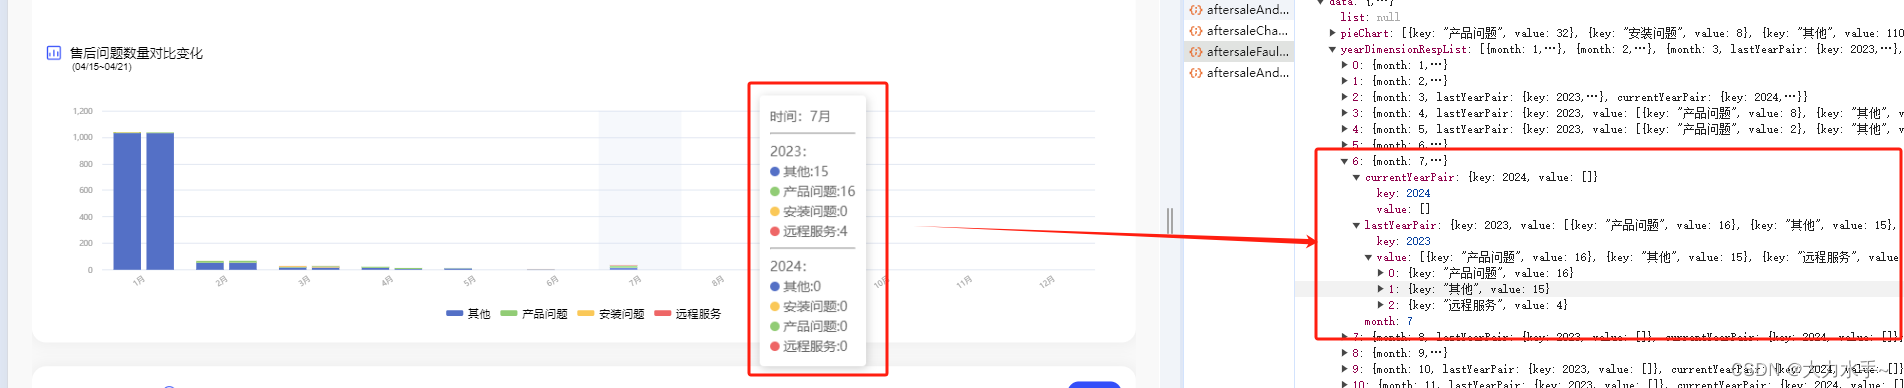
1.后台返回的数据格式
{
"code": "0000",
"message": "",
"messageCode": "操作成功",
"sign": null,
"detail": null,
"data": {
"pieChart": [
{
"key": "产品问题",
"value": 32
},
{
"key": "安装问题",
"value": 8
},
{
"key": "其他",
"value": 1107
},
{
"key": "远程服务",
"value": 1
}
],
"list": null,
"yearDimensionRespList": [
{
"month": 1,
"lastYearPair": {
"key": 2023,
"value": [
{
"key": "安装问题",
"value": 1
},
{
"key": "其他",
"value": 1031
},
{
"key": "产品问题",
"value": 5
}
]
},
"currentYearPair": {
"key": 2024,
"value": [
{
"key": "其他",
"value": 1031
},
{
"key": "产品问题",
"value": 5
},
{
"key": "安装问题",
"value": 1
}
]
}
},
{
"month": 2,
"lastYearPair": {
"key": 2023,
"value": [
{
"key": "安装问题",
"value": 1
},
{
"key": "产品问题",
"value": 14
},
{
"key": "其他",
"value": 53
}
]
},
"currentYearPair": {
"key": 2024,
"value": [
{
"key": "产品问题",
"value": 14
},
{
"key": "安装问题",
"value": 1
},
{
"key": "其他",
"value": 53
}
]
}
},
{
"month": 3,
"lastYearPair": {
"key": 2023,
"value": [
{
"key": "产品问题",
"value": 5
},
{
"key": "安装问题",
"value": 6
},
{
"key": "其他",
"value": 17
},
{
"key": "远程服务",
"value": 1
}
]
},
"currentYearPair": {
"key": 2024,
"value": [
{
"key": "其他",
"value": 17
},
{
"key": "产品问题",
"value": 5
},
{
"key": "安装问题",
"value": 6
},
{
"key": "远程服务",
"value": 1
}
]
}
},
{
"month": 4,
"lastYearPair": {
"key": 2023,
"value": [
{
"key": "其他",
"value": 15
},
{
"key": "产品问题",
"value": 8
}
]
},
"currentYearPair": {
"key": 2024,
"value": [
{
"key": "其他",
"value": 6
},
{
"key": "产品问题",
"value": 8
}
]
}
},
{
"month": 5,
"lastYearPair": {
"key": 2023,
"value": [
{
"key": "产品问题",
"value": 2
},
{
"key": "其他",
"value": 10
}
]
},
"currentYearPair": {
"key": 2024,
"value": []
}
},
{
"month": 6,
"lastYearPair": {
"key": 2023,
"value": [
{
"key": "其他",
"value": 2
},
{
"key": "产品问题",
"value": 1
},
{
"key": "远程服务",
"value": 1
}
]
},
"currentYearPair": {
"key": 2024,
"value": []
}
},
{
"month": 7,
"lastYearPair": {
"key": 2023,
"value": [
{
"key": "产品问题",
"value": 16
},
{
"key": "远程服务",
"value": 4
},
{
"key": "其他",
"value": 15
}
]
},
"currentYearPair": {
"key": 2024,
"value": []
}
},
{
"month": 8,
"lastYearPair": {
"key": 2023,
"value": []
},
"currentYearPair": {
"key": 2024,
"value": []
}
},
{
"month": 9,
"lastYearPair": {
"key": 2023,
"value": [
{
"key": "其他",
"value": 2
},
{
"key": "产品问题",
"value": 5
},
{
"key": "远程服务",
"value": 1
}
]
},
"currentYearPair": {
"key": 2024,
"value": []
}
},
{
"month": 10,
"lastYearPair": {
"key": 2023,
"value": []
},
"currentYearPair": {
"key": 2024,
"value": []
}
},
{
"month": 11,
"lastYearPair": {
"key": 2023,
"value": []
},
"currentYearPair": {
"key": 2024,
"value": []
}
},
{
"month": 12,
"lastYearPair": {
"key": 2023,
"value": []
},
"currentYearPair": {
"key": 2024,
"value": []
}
}
]
},
"success": true
}
2.代码 indexC optionC optionCYear
<template>
<!-- 售后服务工单 -->
<div class="production-box">
<!-- 顶部时间切换 -->
<TopTab @handleClickDateTab="handleClickDateTab" />
<!-- 主体内容 -->
<div class="content">
<!-- !!!!售后工单渠道占比!!!!!! -->
<div class="sales">
<!-- 顶部标题 -->
<div class="top-title">
<div>
<div>售后工单渠道占比</div>
<div @click="showDialogs(0)"></div>
</div>
<div v-if="0">详情</div>
</div>
<!-- 中部标题 -->
<div class="middle-title">
<div class="hardware-bg"></div>
<div>{{ state.titleA }}</div>
</div>
<!-- echarts图表环形 -->
<div class="chart-info">
<EChart
:option="state.circleOptionA"
:width="state.width"
:height="state.height"
isClick
/>
</div>
<!-- 底部标题 -->
<div class="bottom-title">
<div>
<div class="data-bg"></div>
<div class="bottom-title_bold">{{ state.subtitleA }}</div>
</div>
<div>
<div style="width: 18px"></div>
<div class="bottom-title_think">{{ state.timeRangA }}</div>
</div>
</div>
<!-- echarts图表 -->
<div class="chart-info">
<EChart
:option="
state.queryType != 'year' ? state.optionA : state.optionAYear
"
:width="state.width"
:height="state.height"
isClick
/>
</div>
</div>
<!-- !!!!售后问题统计!!!!!! -->
<div class="sales">
<!-- 顶部标题 -->
<div class="top-title">
<div>
<div>售后问题统计</div>
<div @click="showDialogs(1)"></div>
</div>
<div @click="handleClickDetailB">详情</div>
</div>
<!-- 中部标题 -->
<div class="middle-title">
<div class="hardware-bg"></div>
<div>{{ state.titleB }}</div>
</div>
<!-- echarts图表环形 -->
<div class="chart-info">
<EChart
:option="state.circleOptionB"
:width="state.width"
:height="state.height"
isClick
/>
</div>
<!-- 底部标题 -->
<div class="bottom-title">
<div>
<div class="data-bg"></div>
<div class="bottom-title_bold">{{ state.subtitleB }}</div>
</div>
<div>
<div style="width: 18px"></div>
<div class="bottom-title_think">{{ state.timeRangB }}</div>
</div>
</div>
<!-- echarts图表 -->
<div class="chart-info">
<EChart
:option="
state.queryType != 'year' ? state.optionB : state.optionBYear
"
:width="state.width"
:height="state.height"
isClick
/>
</div>
</div>
<!-- !!!!售后工单数统计!!!!!! -->
<div class="sales">
<!-- 顶部标题 -->
<div class="top-title">
<div>
<div>售后工单数统计</div>
<div @click="showDialogs(2)"></div>
</div>
<div @click="handleClickDetailC">详情</div>
</div>
<!-- 中部标题 -->
<div class="middle-title">
<div class="hardware-bg"></div>
<div>{{ state.titleC }}</div>
</div>
<!-- echarts图表环形 -->
<div class="chart-info">
<EChart
:option="state.circleOptionC"
:width="state.width"
:height="state.height"
isClick
/>
</div>
<!-- 底部标题 -->
<div class="bottom-title">
<div>
<div class="data-bg"></div>
<div class="bottom-title_bold">{{ state.subtitleC }}</div>
</div>
<div>
<div style="width: 18px"></div>
<div class="bottom-title_think">{{ state.timeRangC }}</div>
</div>
</div>
<!-- echarts图表 -->
<div class="chart-info">
<EChart
:option="
state.queryType != 'year' ? state.optionC : state.optionCYear
"
:width="state.width"
:height="state.height"
isClick
/>
</div>
</div>
<div class="up-time">数据更新时间:{{ store.state.updateTime }}</div>
</div>
<van-dialog v-model:show="state.show" title="" confirmButtonText="知道了">
<div class="dialog-content">
<div
v-for="(item, index) in state.currentTipList"
:key="index"
class="dia-cent"
>
{{ item }}
</div>
</div>
</van-dialog>
</div>
</template>
<script setup>
import { getCurrentInstance, onMounted, reactive, inject, ref } from "vue";
import TopTab from "../../component/top-tab.vue";
import EChart from "@/component/charts.vue";
import moment from "moment";
import {useRouter} from "vue-router";
import store from '@/store/index';
// echart 初始化
const echarts = inject("ec");
const { proxy } = getCurrentInstance();
const router = useRouter();
const tips = ref([
{
title: "售后工单渠道占比",
list: [
"「售后工单渠道占比」数据取自主服系统中售后服务工单表;",
"时间维度为分别为日(当日)、周(本周周一至当日)、月(本月1日至当日)、年(当年1月1日至当日)的出货总数量;",
"区分售后工单来源渠道,分别为车企、电商新零售、海外、公共配套;",
"饼状图统计各渠道同一时间维度下数量及占比情况;",
"柱状图统计各渠道同一时间维度下数量变化的趋势情况;",
],
},
{
title: "售后问题统计",
list: [
"「售后问题统计」数据取自主服系统售后服务工单表中状态为已完成的数据;",
"时间维度为分别为日(当日)、周(本周周一至当日)、月(本月1日至当日)、年(当年1月1日至当日)的工单总数量;",
"根据售后问题解决方案区分售后工单问题,分别为产品问题、安装问题、远程服务、检测无故障、其他;",
"工单问题类型为其他的表示该工单为填写解决方案;",
"饼状图统计各渠道同一时间维度下问题数量及占比情况;",
"柱状图统计各渠道同一时间维度下问题数量变化的趋势情况;",
],
},
{
title: "售后工单数统计",
list: [
"「售后工单数统计」数据取自主服系统售后服务工单表中状态为已完成的数据;",
"时间维度为分别为日(当日)、周(本周周一至当日)、月(本月1日至当日)、年(当年1月1日至当日)的工单总数量;",
"饼状图统计各渠道同一时间维度下售后工单数量在全部工单的占比情况;",
"柱状图统计各渠道同一时间维度下售后工单在全部工单的占比数量变化的趋势情况;",
],
},
]);
const state = reactive({
show: false,
currentTipList: [],
width: "100%",
height: "240px",
queryType: "day",
eightWeek: {
startTime: "",
endTime: "",
},
currentYear: "",
lastYear: "",
year: moment().format("YYYY"),
indexA: 0,
indexB: 0,
indexC: 0,
titleA: "",
subtitleA: "",
timeRangA: "",
titleB: "",
subtitleB: "",
timeRangB: "",
titleC: "",
subtitleC: "",
timeRangC: "",
optionA: {
//日月周
grid: {
top: "16px",
left: "16px",
right: "16px",
bottom: "32px",
containLabel: true,
},
tooltip: {
trigger: "axis",
confine: true,
},
legend: {
x: "center",
y: "bottom",
// width: 60,
itemWidth: 18, //图例长度
itemHeight: 6, //图例宽度
icon: "roundRect",
textStyle: {
//图例文字
color: "#000000",
fontSize: 12,
},
selectedMode: true,
},
xAxis: [
{
type: "category",
data: [],
axisPointer: {
type: "shadow",
},
axisTick: {
show: false, // 隐藏刻度线
},
axisLine: {
show: false,
lineStyle: {
color: "#A4A4A4", // 设置轴线的颜色,这里以红色为例
},
},
axisLabel: {
rotate: 35,
interval: 0,
textStyle: {
color: "#A4A4A4", // 文本颜色
fontSize: 8, // 文本大小
},
},
},
],
yAxis: [
{
type: "value",
min: 0,
// max: 10000,
// interval: 2000,
axisLabel: {
formatter: "{value} ",
textStyle: {
color: "#A4A4A4", // 文本颜色
fontSize: 8, // 文本大小
},
},
},
],
series: [],
},
optionAYear: {
//年
grid: {
top: "16px",
left: "16px",
right: "16px",
bottom: "32px",
containLabel: true,
},
tooltip: {
trigger: "axis",
confine: true,
formatter: function (params) {
console.log("state.currentYear=" + params.length);
var res =
"<div>时间:" +
params[0].name +
"</div><hr><div>" +
state.lastYear +
":</div>";
for (var i = 0; i < params.length; i++) {
res +=
"<div>" +
params[i].marker +
params[i].seriesName +
":" +
params[i].data +
"</div>";
if (i == state.indexA) {
res += "<hr><div>" + state.currentYear + ":</div>";
}
}
return res;
},
},
legend: {
x: "center",
y: "bottom",
// width: 60,
itemWidth: 18, //图例长度
itemHeight: 6, //图例宽度
icon: "roundRect",
textStyle: {
//图例文字
color: "#000000",
fontSize: 12,
},
selectedMode: false,
},
xAxis: [
{
type: "category",
data: [],
axisPointer: {
type: "shadow",
},
axisTick: {
show: false, // 隐藏刻度线
},
axisLine: {
show: false,
lineStyle: {
color: "#A4A4A4", // 设置轴线的颜色,这里以红色为例
},
},
axisLabel: {
rotate: 35,
interval: 0,
textStyle: {
color: "#A4A4A4", // 文本颜色
fontSize: 8, // 文本大小
},
},
},
],
yAxis: [
{
type: "value",
min: 0,
// max: 10000,
// interval: 2000,
axisLabel: {
formatter: "{value} ",
textStyle: {
color: "#A4A4A4", // 文本颜色
fontSize: 8, // 文本大小
},
},
},
],
series: [],
},
optionB: {
//日月周
grid: {
top: "16px",
left: "16px",
right: "16px",
bottom: "32px",
containLabel: true,
},
tooltip: {
trigger: "axis",
confine: true,
},
legend: {
x: "center",
y: "bottom",
// width: 60,
itemWidth: 18, //图例长度
itemHeight: 6, //图例宽度
icon: "roundRect",
textStyle: {
//图例文字
color: "#000000",
fontSize: 12,
},
selectedMode: true,
},
xAxis: [
{
type: "category",
data: [],
axisPointer: {
type: "shadow",
},
axisTick: {
show: false, // 隐藏刻度线
},
axisLine: {
show: false,
lineStyle: {
color: "#A4A4A4", // 设置轴线的颜色,这里以红色为例
},
},
axisLabel: {
rotate: 35,
interval: 0,
textStyle: {
color: "#A4A4A4", // 文本颜色
fontSize: 8, // 文本大小
},
},
},
],
yAxis: [
{
type: "value",
min: 0,
// max: 10000,
// interval: 2000,
axisLabel: {
formatter: "{value} ",
textStyle: {
color: "#A4A4A4", // 文本颜色
fontSize: 8, // 文本大小
},
},
},
],
series: [],
},
optionBYear: {
//年
grid: {
top: "16px",
left: "16px",
right: "16px",
bottom: "32px",
containLabel: true,
},
tooltip: {
trigger: "axis",
confine: true,
formatter: function (params) {
console.log("state.currentYear=" + params.length);
var res =
"<div>时间:" +
params[0].name +
"</div><hr><div>" +
state.lastYear +
":</div>";
for (var i = 0; i < params.length; i++) {
res +=
"<div>" +
params[i].marker +
params[i].seriesName +
":" +
params[i].data +
"</div>";
if (i == state.indexB) {
res += "<hr><div>" + state.currentYear + ":</div>";
}
}
return res;
},
},
legend: {
x: "center",
y: "bottom",
// width: 60,
itemWidth: 18, //图例长度
itemHeight: 6, //图例宽度
icon: "roundRect",
textStyle: {
//图例文字
color: "#000000",
fontSize: 12,
},
selectedMode: false,
},
xAxis: [
{
type: "category",
data: [],
axisPointer: {
type: "shadow",
},
axisTick: {
show: false, // 隐藏刻度线
},
axisLine: {
show: false,
lineStyle: {
color: "#A4A4A4", // 设置轴线的颜色,这里以红色为例
},
},
axisLabel: {
rotate: 35,
interval: 0,
textStyle: {
color: "#A4A4A4", // 文本颜色
fontSize: 8, // 文本大小
},
},
},
],
yAxis: [
{
type: "value",
min: 0,
// max: 10000,
// interval: 2000,
axisLabel: {
formatter: "{value} ",
textStyle: {
color: "#A4A4A4", // 文本颜色
fontSize: 8, // 文本大小
},
},
},
],
series: [],
},
optionC: {
//日月周
grid: {
top: "16px",
left: "16px",
right: "16px",
bottom: "32px",
containLabel: true,
},
tooltip: {
trigger: "axis",
confine: true,
},
legend: {
x: "center",
y: "bottom",
// width: 60,
itemWidth: 18, //图例长度
itemHeight: 6, //图例宽度
icon: "roundRect",
textStyle: {
//图例文字
color: "#000000",
fontSize: 12,
},
selectedMode: true,
},
xAxis: [
{
type: "category",
data: [],
axisPointer: {
type: "shadow",
},
axisTick: {
show: false, // 隐藏刻度线
},
axisLine: {
show: false,
lineStyle: {
color: "#A4A4A4", // 设置轴线的颜色,这里以红色为例
},
},
axisLabel: {
rotate: 35,
interval: 0,
textStyle: {
color: "#A4A4A4", // 文本颜色
fontSize: 8, // 文本大小
},
},
},
],
yAxis: [
{
type: "value",
min: 0,
// max: 10000,
// interval: 2000,
axisLabel: {
formatter: "{value} ",
textStyle: {
color: "#A4A4A4", // 文本颜色
fontSize: 8, // 文本大小
},
},
},
],
series: [],
},
optionCYear: {
//年
grid: {
top: "16px",
left: "16px",
right: "16px",
bottom: "32px",
containLabel: true,
},
tooltip: {
trigger: "axis",
confine: true,
formatter: function (params) {
console.log("state.currentYear=" + params.length);
var res =
"<div>时间:" +
params[0].name +
"</div><hr><div>" +
state.lastYear +
":</div>";
for (var i = 0; i < params.length; i++) {
res +=
"<div>" +
params[i].marker +
params[i].seriesName +
":" +
params[i].data +
"</div>";
if (i == state.indexC) {
res += "<hr><div>" + state.currentYear + ":</div>";
}
}
return res;
},
},
legend: {
x: "center",
y: "bottom",
// width: 60,
itemWidth: 18, //图例长度
itemHeight: 6, //图例宽度
icon: "roundRect",
textStyle: {
//图例文字
color: "#000000",
fontSize: 12,
},
selectedMode: false,
},
xAxis: [
{
type: "category",
data: [],
axisPointer: {
type: "shadow",
},
axisTick: {
show: false, // 隐藏刻度线
},
axisLine: {
show: false,
lineStyle: {
color: "#A4A4A4", // 设置轴线的颜色,这里以红色为例
},
},
axisLabel: {
rotate: 35,
interval: 0,
textStyle: {
color: "#A4A4A4", // 文本颜色
fontSize: 8, // 文本大小
},
},
},
],
yAxis: [
{
type: "value",
min: 0,
// max: 10000,
// interval: 2000,
axisLabel: {
formatter: "{value} ",
textStyle: {
color: "#A4A4A4", // 文本颜色
fontSize: 8, // 文本大小
},
},
},
],
series: [],
},
circleOptionA: {
tooltip: {
trigger: "item",
confine: true,
},
grid: {
top: "16px",
left: "16px",
right: "16px",
bottom: "32px",
containLabel: true,
},
legend: {
top: "80%",
left: "center",
// width: 60,
itemWidth: 17, //图例长度
itemHeight: 6, //图例宽度
icon: "roundRect",
textStyle: {
//图例文字
color: "#000000",
fontSize: 10,
},
},
series: [
{
name: "",
type: "pie",
radius: ["40%", "55%"], //环形图的大小
center: ["50%", "40%"], //环形图位置
// adjust the start and end angle
startAngle: 180,
endAngle: 360,
data: [],
},
],
},
circleOptionB: {
tooltip: {
trigger: "item",
confine: true,
},
grid: {
top: "16px",
left: "16px",
right: "16px",
bottom: "32px",
containLabel: true,
},
legend: {
top: "80%",
left: "center",
// width: 60,
itemWidth: 17, //图例长度
itemHeight: 6, //图例宽度
icon: "roundRect",
textStyle: {
//图例文字
color: "#000000",
fontSize: 10,
},
},
series: [
{
name: "",
type: "pie",
radius: ["40%", "55%"], //环形图的大小
center: ["50%", "40%"], //环形图位置
// adjust the start and end angle
startAngle: 180,
endAngle: 360,
data: [],
},
],
},
circleOptionC: {
tooltip: {
trigger: "item",
confine: true,
},
grid: {
top: "16px",
left: "16px",
right: "16px",
bottom: "32px",
containLabel: true,
},
legend: {
top: "80%",
left: "center",
// width: 60,
itemWidth: 17, //图例长度
itemHeight: 6, //图例宽度
icon: "roundRect",
textStyle: {
//图例文字
color: "#000000",
fontSize: 10,
},
},
series: [
{
name: "",
type: "pie",
radius: ["40%", "55%"], //环形图的大小
center: ["50%", "40%"], //环形图位置
// adjust the start and end angle
startAngle: 180,
endAngle: 360,
data: [],
},
],
},
});
// 问号弹出框
const showDialogs = (val) => {
state.show = true;
state.currentTipList = tips.value[val].list;
};
const handleClickDateTab = (row) => {
console.log(row);
state.queryType = row.value;
init();
};
// 售后工单渠道占比
const getaftersaleChannelNum = () => {
proxy.$H
.post(proxy, proxy.$A.aftersaleChannelNum, {
accessType: "web",
data: state.queryType,
})
.then((res) => {
if (state.queryType != "year") {
//饼状图数据
if (res.data.data.pieChart.length > 0) {
state.circleOptionA.series[0].data = res.data.data.pieChart.map(
(item) => {
return {
name: item.key,
value: item.value,
};
}
);
}
//柱状堆叠图
//X轴数据
if (res.data.data.list.length > 0) {
state.optionA.xAxis[0].data = res.data.data.list.map((item) => {
return item.date;
});
//serios的name集合
let seriosNameList = [];
state.optionA.series = [];
for (let item of res.data.data.list) {
for (let ite of item.channelList) {
if (!seriosNameList.includes(ite.key)) {
seriosNameList.push(ite.key);
}
}
}
console.log("长度为:" + seriosNameList.length);
seriosNameList.forEach((element, index) => {
let seriesObj = {
name: "",
type: "bar",
stack: "total",
data: [],
barWidth: "50%",
// itemStyle: {
// normal: {
// color: {
// type: "linear",
// x: 0,
// y: 0,
// x2: 0,
// y2: 1,
// colorStops: [
// {
// offset: 0,
// color: "rgba(253,148,12,0.54)", // 柱子上部颜色
// },
// {
// offset: 1,
// color: "rgba(254,71,1,0.54)", // 柱子下部颜色
// },
// ],
// globalCoord: false, // 缺省值false
// },
// },
// },
};
console.log(index);
console.log("name=" + element);
seriesObj.name = element;
state.optionA.series.push(seriesObj);
console.log(state.optionA.series);
for (let item of res.data.data.list) {
if (item.channelList.length > 0) {
if (item.channelList.some((ite) => ite.key == element)) {
for (let it of item.channelList) {
if (it.key == element) {
seriesObj.data.push(it.value);
}
}
} else {
seriesObj.data.push(0);
}
} else {
seriesObj.data.push(0);
}
}
});
}
} else {
//年的数据
//饼状图数据
if (res.data.data.pieChart.length > 0) {
state.circleOptionA.series[0].data = res.data.data.pieChart.map(
(item) => {
return {
name: item.key,
value: item.value,
};
}
);
}
//serios的name集合
let seriosNameListA = []; //去年的
let seriosNameListB = []; //今年的
state.optionAYear.series = [];
//柱状堆叠图
//X轴数据
if (res.data.data.yearDimensionRespList.length > 0) {
state.optionAYear.xAxis[0].data = res.data.data.yearDimensionRespList.map(
(item) => {
return item.month + "月";
}
);
for (let item of res.data.data.yearDimensionRespList) {
state.currentYear = item.currentYearPair.key;
state.lastYear = item.lastYearPair.key;
for (let ite of item.lastYearPair.value) {
if (!seriosNameListA.includes(ite.key)) {
seriosNameListA.push(ite.key);
}
}
for (let ite of item.currentYearPair.value) {
if (!seriosNameListB.includes(ite.key)) {
seriosNameListB.push(ite.key);
}
}
}
console.log(seriosNameListA);
console.log(seriosNameListB);
//去年堆叠图
state.indexA = seriosNameListA.length - 1; //tooltip 转换的下标
seriosNameListA.forEach((element, index) => {
let seriesObj = {
name: "",
type: "bar",
stack: state.lastYear,
data: [],
// barWidth: "50%",
};
console.log(index);
console.log("name=" + element);
seriesObj.name = element;
state.optionAYear.series.push(seriesObj);
console.log(state.optionAYear.series);
for (let item of res.data.data.yearDimensionRespList) {
if (item.lastYearPair.value.length > 0) {
if (item.lastYearPair.value.some((ite) => ite.key == element)) {
for (let it of item.lastYearPair.value) {
if (it.key == element) {
seriesObj.data.push(it.value);
}
}
} else {
seriesObj.data.push(0);
}
} else {
seriesObj.data.push(0);
}
}
});
//今年堆叠图
seriosNameListB.forEach((element, index) => {
let seriesObj = {
name: "",
type: "bar",
stack: state.currentYear,
data: [],
// barWidth: "50%",
// itemStyle: {
// normal: {
// color: {
// type: "linear",
// x: 0,
// y: 0,
// x2: 0,
// y2: 1,
// colorStops: [
// {
// offset: 0,
// color: "rgba(253,148,12,0.54)", // 柱子上部颜色
// },
// {
// offset: 1,
// color: "rgba(254,71,1,0.54)", // 柱子下部颜色
// },
// ],
// globalCoord: false, // 缺省值false
// },
// },
// },
};
console.log(index);
console.log("name=" + element);
seriesObj.name = element;
state.optionAYear.series.push(seriesObj);
console.log(state.optionAYear.series);
for (let item of res.data.data.yearDimensionRespList) {
if (item.currentYearPair.value.length > 0) {
if (
item.currentYearPair.value.some((ite) => ite.key == element)
) {
for (let it of item.currentYearPair.value) {
if (it.key == element) {
seriesObj.data.push(it.value);
}
}
} else {
seriesObj.data.push(0);
}
} else {
seriesObj.data.push(0);
}
}
});
}
}
//标题变更
const today = moment();
let startDate = "";
let endDate = "";
if (state.queryType == "day") {
state.titleA = `${moment()
.subtract(1, "days")
.format("YYYY-MM-DD")}售后工单渠道数量及占比`;
state.subtitleA = `近7日售后工单渠道数量变化`;
startDate = res.data.data.list[0].date;
endDate = res.data.data.list[res.data.data.list.length - 1].date;
state.timeRangA = `(${startDate}~${endDate})`;
} else if (state.queryType == "week") {
state.titleA = `本周(${
res.data.data.list[res.data.data.list.length - 1].date
})售后工单渠道数量及占比`;
state.subtitleA = `近8周售后工单渠道数量变化`;
state.timeRangA = `(${state.eightWeek.startTime}~${state.eightWeek.endTime})`;
} else if (state.queryType == "month") {
state.titleA = `售后工单渠道数量及占比`;
state.subtitleA = `近6个售后工单渠道数量变化`;
startDate = res.data.data.list[0].date;
endDate = res.data.data.list[res.data.data.list.length - 1].date;
state.timeRangA = `(${startDate}~${endDate})`;
} else {
state.titleA = `${state.year}售后工单渠道数量及占比`;
state.subtitleA = "售后工单渠道数量对比变化";
}
});
};
// 售后问题统计
const getaftersaleFaultNum = () => {
proxy.$H
.post(proxy, proxy.$A.aftersaleFaultNum, {
accessType: "web",
data: state.queryType,
})
.then((res) => {
if (state.queryType != "year") {
//饼状图数据
if (res.data.data.pieChart.length > 0) {
state.circleOptionB.series[0].data = res.data.data.pieChart.map(
(item) => {
return {
name: item.key,
value: item.value,
};
}
);
}
//柱状堆叠图
//X轴数据
if (res.data.data.list.length > 0) {
state.optionB.xAxis[0].data = res.data.data.list.map((item) => {
return item.date;
});
//serios的name集合
let seriosNameList = [];
state.optionB.series = [];
for (let item of res.data.data.list) {
for (let ite of item.channelList) {
if (!seriosNameList.includes(ite.key)) {
seriosNameList.push(ite.key);
}
}
}
console.log("长度为:" + seriosNameList.length);
seriosNameList.forEach((element, index) => {
let seriesObj = {
name: "",
type: "bar",
stack: "total",
data: [],
barWidth: "50%",
// itemStyle: {
// normal: {
// color: {
// type: "linear",
// x: 0,
// y: 0,
// x2: 0,
// y2: 1,
// colorStops: [
// {
// offset: 0,
// color: "rgba(253,148,12,0.54)", // 柱子上部颜色
// },
// {
// offset: 1,
// color: "rgba(254,71,1,0.54)", // 柱子下部颜色
// },
// ],
// globalCoord: false, // 缺省值false
// },
// },
// },
};
console.log(index);
console.log("name=" + element);
seriesObj.name = element;
state.optionB.series.push(seriesObj);
console.log(state.optionB.series);
for (let item of res.data.data.list) {
if (item.channelList.length > 0) {
if (item.channelList.some((ite) => ite.key == element)) {
for (let it of item.channelList) {
if (it.key == element) {
seriesObj.data.push(it.value);
}
}
} else {
seriesObj.data.push(0);
}
} else {
seriesObj.data.push(0);
}
}
});
}
} else {
//年的数据
//饼状图数据
if (res.data.data.pieChart.length > 0) {
state.circleOptionB.series[0].data = res.data.data.pieChart.map(
(item) => {
return {
name: item.key,
value: item.value,
};
}
);
}
//serios的name集合
let seriosNameListA = []; //去年的
let seriosNameListB = []; //今年的
state.optionBYear.series = [];
//柱状堆叠图
//X轴数据
if (res.data.data.yearDimensionRespList.length > 0) {
state.optionBYear.xAxis[0].data = res.data.data.yearDimensionRespList.map(
(item) => {
return item.month + "月";
}
);
for (let item of res.data.data.yearDimensionRespList) {
state.currentYear = item.currentYearPair.key;
state.lastYear = item.lastYearPair.key;
for (let ite of item.lastYearPair.value) {
if (!seriosNameListA.includes(ite.key)) {
seriosNameListA.push(ite.key);
}
}
for (let ite of item.currentYearPair.value) {
if (!seriosNameListB.includes(ite.key)) {
seriosNameListB.push(ite.key);
}
}
}
console.log(seriosNameListA);
console.log(seriosNameListB);
//去年堆叠图
state.indexB = seriosNameListA.length - 1; //tooltip 转换的下标
seriosNameListA.forEach((element, index) => {
let seriesObj = {
name: "",
type: "bar",
stack: state.lastYear,
data: [],
// barWidth: "50%",
};
console.log(index);
console.log("name=" + element);
seriesObj.name = element;
state.optionBYear.series.push(seriesObj);
console.log(state.optionBYear.series);
for (let item of res.data.data.yearDimensionRespList) {
if (item.lastYearPair.value.length > 0) {
if (item.lastYearPair.value.some((ite) => ite.key == element)) {
for (let it of item.lastYearPair.value) {
if (it.key == element) {
seriesObj.data.push(it.value);
}
}
} else {
seriesObj.data.push(0);
}
} else {
seriesObj.data.push(0);
}
}
});
//今年堆叠图
seriosNameListB.forEach((element, index) => {
let seriesObj = {
name: "",
type: "bar",
stack: state.currentYear,
data: [],
// barWidth: "50%",
// itemStyle: {
// normal: {
// color: {
// type: "linear",
// x: 0,
// y: 0,
// x2: 0,
// y2: 1,
// colorStops: [
// {
// offset: 0,
// color: "rgba(253,148,12,0.54)", // 柱子上部颜色
// },
// {
// offset: 1,
// color: "rgba(254,71,1,0.54)", // 柱子下部颜色
// },
// ],
// globalCoord: false, // 缺省值false
// },
// },
// },
};
console.log(index);
console.log("name=" + element);
seriesObj.name = element;
state.optionBYear.series.push(seriesObj);
console.log(state.optionBYear.series);
for (let item of res.data.data.yearDimensionRespList) {
if (item.currentYearPair.value.length > 0) {
if (
item.currentYearPair.value.some((ite) => ite.key == element)
) {
for (let it of item.currentYearPair.value) {
if (it.key == element) {
seriesObj.data.push(it.value);
}
}
} else {
seriesObj.data.push(0);
}
} else {
seriesObj.data.push(0);
}
}
});
}
}
//标题变更
const today = moment();
let startDate = "";
let endDate = "";
if (state.queryType == "day") {
state.titleB = `${moment()
.subtract(1, "days")
.format("YYYY-MM-DD")}售后问题数量及占比`;
state.subtitleB = `近7日售后问题数量变化`;
startDate = res.data.data.list[0].date;
endDate = res.data.data.list[res.data.data.list.length - 1].date;
state.timeRangB = `(${startDate}~${endDate})`;
} else if (state.queryType == "week") {
state.titleB = `本周(${
res.data.data.list[res.data.data.list.length - 1].date
})售后问题数量及占比`;
state.subtitleB = `近8周售后问题数量变化`;
state.timeRangB = `(${state.eightWeek.startTime}~${state.eightWeek.endTime})`;
} else if (state.queryType == "month") {
state.titleB = `本月售后问题数量及占比`;
state.subtitleB = `近6个售后问题数量变化`;
startDate = res.data.data.list[0].date;
endDate = res.data.data.list[res.data.data.list.length - 1].date;
state.timeRangB = `(${startDate}~${endDate})`;
} else {
state.titleB = `${state.year}售后问题数量及占比`;
state.subtitleB = "售后问题数量对比变化";
}
});
};
// 售后工单数统计
const getaftersaleAndInstallOrderNum = () => {
proxy.$H
.post(proxy, proxy.$A.aftersaleAndInstallOrderNum, {
accessType: "web",
data: state.queryType,
})
.then((res) => {
if (state.queryType != "year") {
//饼状图数据
if (res.data.data.pieChart.length > 0) {
state.circleOptionC.series[0].data = res.data.data.pieChart.map(
(item) => {
return {
name: item.key,
value: item.value,
};
}
);
}
//柱状堆叠图
//X轴数据
if (res.data.data.list.length > 0) {
state.optionC.xAxis[0].data = res.data.data.list.map((item) => {
return item.date;
});
//serios的name集合
let seriosNameList = [];
state.optionC.series = [];
for (let item of res.data.data.list) {
for (let ite of item.channelList) {
if (!seriosNameList.includes(ite.key)) {
seriosNameList.push(ite.key);
}
}
}
console.log("长度为:" + seriosNameList.length);
seriosNameList.forEach((element, index) => {
let seriesObj = {
name: "",
type: "bar",
stack: "total",
data: [],
barWidth: "50%",
// itemStyle: {
// normal: {
// color: {
// type: "linear",
// x: 0,
// y: 0,
// x2: 0,
// y2: 1,
// colorStops: [
// {
// offset: 0,
// color: "rgba(253,148,12,0.54)", // 柱子上部颜色
// },
// {
// offset: 1,
// color: "rgba(254,71,1,0.54)", // 柱子下部颜色
// },
// ],
// globalCoord: false, // 缺省值false
// },
// },
// },
};
console.log(index);
console.log("name=" + element);
seriesObj.name = element;
state.optionC.series.push(seriesObj);
console.log(state.optionC.series);
for (let item of res.data.data.list) {
if (item.channelList.length > 0) {
if (item.channelList.some((ite) => ite.key == element)) {
for (let it of item.channelList) {
if (it.key == element) {
seriesObj.data.push(it.value);
}
}
} else {
seriesObj.data.push(0);
}
} else {
seriesObj.data.push(0);
}
}
});
}
} else {
//年的数据
//饼状图数据
if (res.data.data.pieChart.length > 0) {
state.circleOptionC.series[0].data = res.data.data.pieChart.map(
(item) => {
return {
name: item.key,
value: item.value,
};
}
);
}
//serios的name集合
let seriosNameListA = []; //去年的
let seriosNameListB = []; //今年的
state.optionCYear.series = [];
//柱状堆叠图
//X轴数据
if (res.data.data.yearDimensionRespList.length > 0) {
state.optionCYear.xAxis[0].data = res.data.data.yearDimensionRespList.map(
(item) => {
return item.month + "月";
}
);
for (let item of res.data.data.yearDimensionRespList) {
state.currentYear = item.currentYearPair.key;
state.lastYear = item.lastYearPair.key;
for (let ite of item.lastYearPair.value) {
if (!seriosNameListA.includes(ite.key)) {
seriosNameListA.push(ite.key);
}
}
for (let ite of item.currentYearPair.value) {
if (!seriosNameListB.includes(ite.key)) {
seriosNameListB.push(ite.key);
}
}
}
console.log(seriosNameListA);
console.log(seriosNameListB);
//去年堆叠图
state.indexC = seriosNameListA.length - 1; //tooltip 转换的下标
seriosNameListA.forEach((element, index) => {
let seriesObj = {
name: "",
type: "bar",
stack: state.lastYear,
data: [],
// barWidth: "50%",
};
console.log(index);
console.log("name=" + element);
seriesObj.name = element;
state.optionCYear.series.push(seriesObj);
console.log(state.optionCYear.series);
for (let item of res.data.data.yearDimensionRespList) {
if (item.lastYearPair.value.length > 0) {
if (item.lastYearPair.value.some((ite) => ite.key == element)) {
for (let it of item.lastYearPair.value) {
if (it.key == element) {
seriesObj.data.push(it.value);
}
}
} else {
seriesObj.data.push(0);
}
} else {
seriesObj.data.push(0);
}
}
});
//今年堆叠图
seriosNameListB.forEach((element, index) => {
let seriesObj = {
name: "",
type: "bar",
stack: state.currentYear,
data: [],
// barWidth: "50%",
// itemStyle: {
// normal: {
// color: {
// type: "linear",
// x: 0,
// y: 0,
// x2: 0,
// y2: 1,
// colorStops: [
// {
// offset: 0,
// color: "rgba(253,148,12,0.54)", // 柱子上部颜色
// },
// {
// offset: 1,
// color: "rgba(254,71,1,0.54)", // 柱子下部颜色
// },
// ],
// globalCoord: false, // 缺省值false
// },
// },
// },
};
console.log(state.indexC);
console.log("name=" + element);
seriesObj.name = element;
state.optionCYear.series.push(seriesObj);
console.log(state.optionCYear.series);
for (let item of res.data.data.yearDimensionRespList) {
if (item.currentYearPair.value.length > 0) {
if (
item.currentYearPair.value.some((ite) => ite.key == element)
) {
for (let it of item.currentYearPair.value) {
if (it.key == element) {
seriesObj.data.push(it.value);
}
}
} else {
seriesObj.data.push(0);
}
} else {
seriesObj.data.push(0);
}
}
});
}
}
// 标题变更
const today = moment();
let startDate = "";
let endDate = "";
if (state.queryType == "day") {
state.titleC = `${moment()
.subtract(1, "days")
.format("YYYY-MM-DD")}售后上门工单数及占比`;
state.subtitleC = `近7日售后上门工单数量变化`;
startDate = res.data.data.list[0].date;
endDate = res.data.data.list[res.data.data.list.length - 1].date;
state.timeRangC = `(${startDate}~${endDate})`;
} else if (state.queryType == "week") {
state.titleC = `本周(${
res.data.data.list[res.data.data.list.length - 1].date
})售后上门工单数及占比`;
state.subtitleC = `近8周售后上门工单数量变化`;
state.timeRangC = `(${state.eightWeek.startTime}~${state.eightWeek.endTime})`;
} else if (state.queryType == "month") {
state.titleC = `本月售后上门工单数及占比`;
state.subtitleC = `近6个售后上门工单数量变化`;
startDate = res.data.data.list[0].date;
endDate = res.data.data.list[res.data.data.list.length - 1].date;
state.timeRangC = `(${startDate}~${endDate})`;
} else {
state.titleC = `${state.year}售后上门工单数及占比`;
state.subtitleC = "售后上门工单数量对比变化";
}
});
};
// 售后问题统计
const handleClickDetailB = () => {
router.push({ name: "problem-statistics" });
};
// 售后工单数统计
const handleClickDetailC = () => {
router.push({ name: "visit-statistics" });
};
// 初始化
const init = () => {
getaftersaleChannelNum();
getaftersaleFaultNum();
getaftersaleAndInstallOrderNum();
};
onMounted(() => {
const today = moment();
// 计算前八周的周一的日期
const eightWeeksAgo = today.clone().subtract(7, "weeks");
const mondayOfEightWeeksAgo = eightWeeksAgo.day(1); // 1 represents Monday
state.eightWeek.startTime = mondayOfEightWeeksAgo.format("MM/DD");
state.eightWeek.endTime = today.format("MM/DD");
init();
});
</script>
<style lang="less" scoped>
@import "./index.less";
.dialog-content {
max-height: 60vh;
overflow-y:scroll;
padding: 20px;
.dia-cent {
margin-bottom: 3px;
}
}
</style>
3.效果


![[测试]ChaosBlade: 丢包、延迟、断网、磁盘、cpu占用、内存占用等资源耗尽故障注入利器--编辑中](https://img-blog.csdnimg.cn/direct/2d567cb21fea473bbfcacbba40b42885.png)