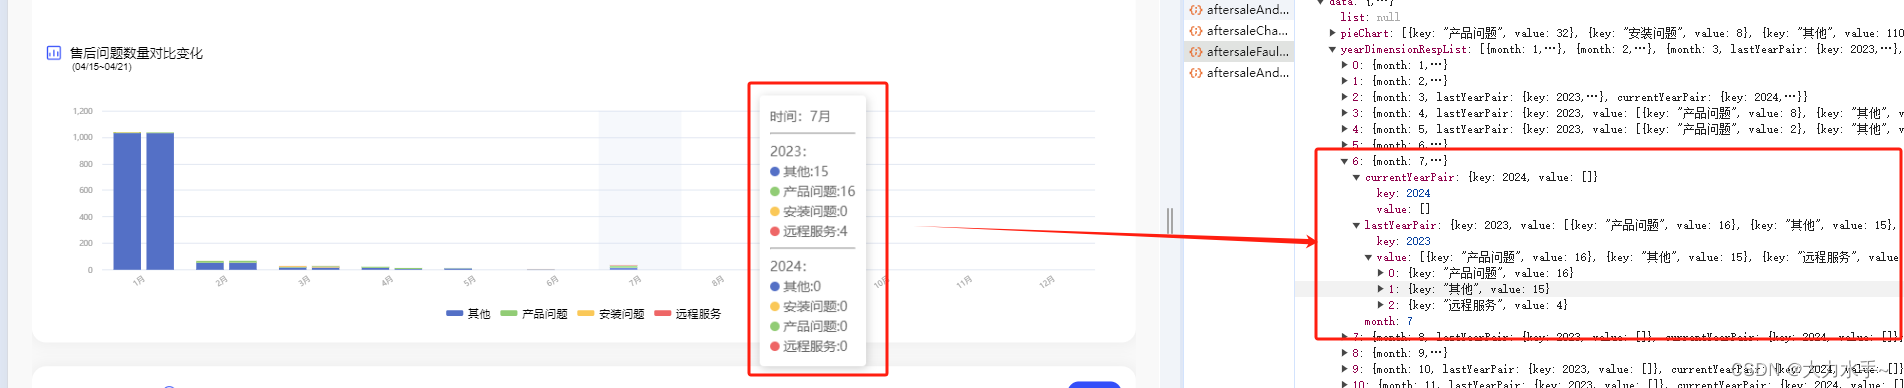
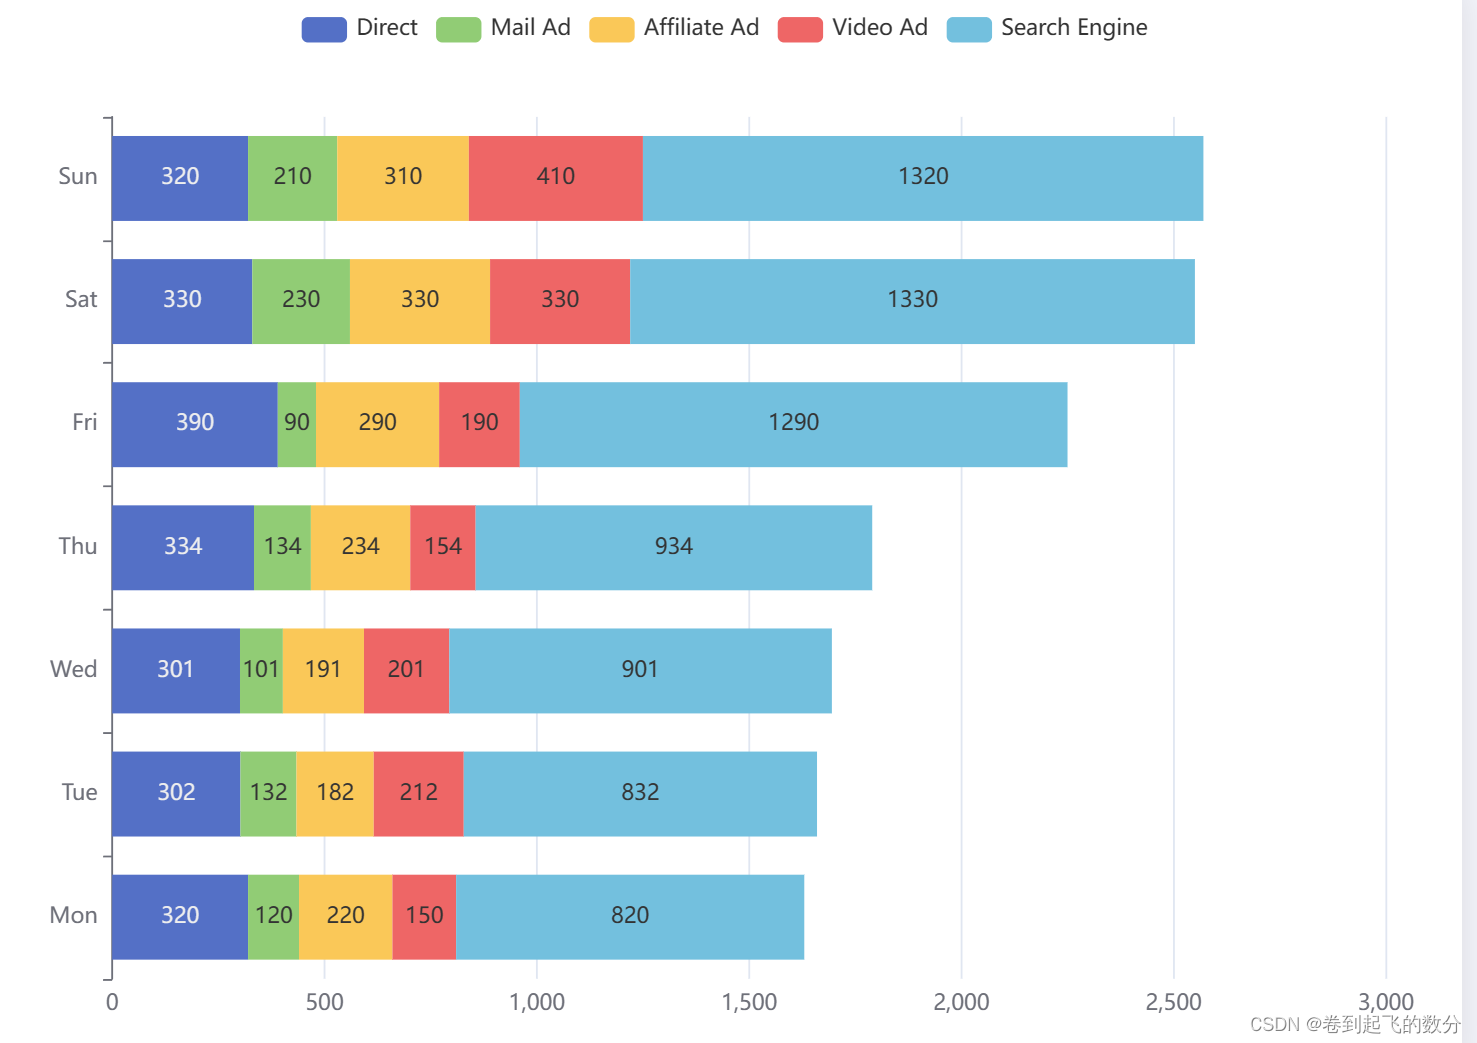
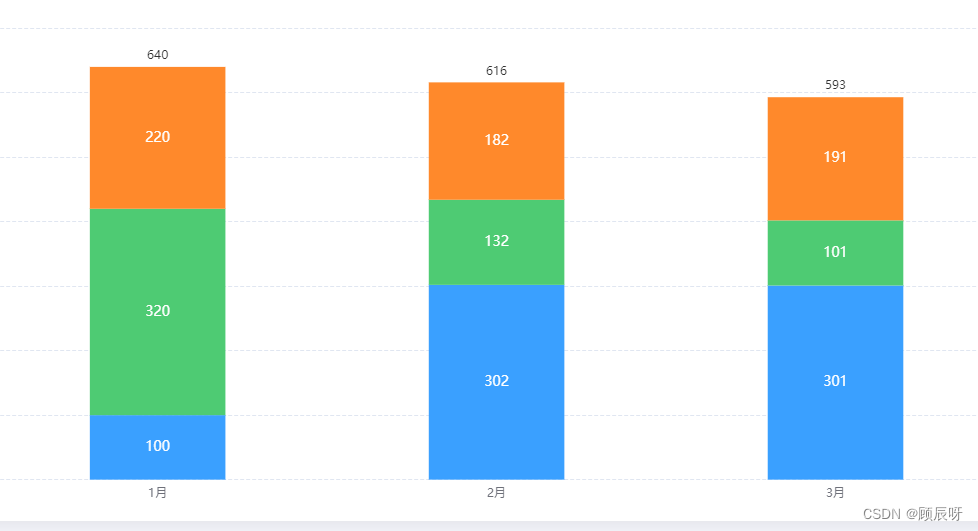
堆叠有3个,后面加了一个对象显示顶部的数据,
其实主要的代码还是在series 的第四项,需要注意的是
series的第四项中的data需要为 data: [0, 0, 0] 顶部的统计才能显示出来
增加的代码如下
{
   name: '综合',
   type: 'bar',
   stack: 'total',
   label: {
     show: true,
     position: 'top',
     formatter: (p) => {
       let arr1 =[100, 302, 301]
         let arr2 =[320, 132, 101]
         let arr3 =[220, 182, 191]
       return arr1[p.dataIndex] + arr2[p.dataIndex] + arr3[p.dataIndex]
     }
   },
   emphasis: {
     focus: 'series'
   },
   data: [0, 0, 0]
 }
完整代码如下 可以在 echarts 中直接运行
option = {
  tooltip: {
    trigger: 'axis',
    axisPointer: {
      type: 'shadow'
    }
  },
  grid: {
    left: '4%',
    right: '1%',
    bottom: '2%',
    top: '15%',
    containLabel: true
  },

  xAxis: {
    type: 'category',
    axisLine: {
      show: false
    },
    axisTick: {
      show: false
    },
    axisLabel: {
      show: true
    },
    data: ['1月', '2月', '3月']
  },
  yAxis: [
    {
      type: 'value',
      name: '(个)',
      nameTextStyle: {
        padding: [0, 0, 0, -36] // 上右下左与原位置距离
      },
      splitLine: {
        show: true,
        lineStyle: {
          type: 'dashed'
        }
      },

      axisLine: {
        show: false
      },
      axisTick: {
        show: false
      }
    }
  ],
  series: [
    {
      name: '近两个月复购客户数',
      type: 'bar',
      stack: 'total',
      barWidth: '40%',
      itemStyle: {
        color: '#3AA0FF'
      },
      label: {
        show: true,
        color: '#fff',
        fontSize: '14px',
        formatter: (params) => params.value
      },
      emphasis: {
        focus: 'series'
      },
      data: [100, 302, 301]
    },
    {
      name: '近三个月复购客户数',
      type: 'bar',
      stack: 'total',
      barWidth: '40%',
      itemStyle: {
        color: '#4ECB73'
      },
      label: {
        show: true,
        color: '#fff',
        fontSize: '14px',
        formatter: (params) => params.value
      },
      emphasis: {
        focus: 'series'
      },
      data: [320, 132, 101]
    },
    {
      show: false,
      name: '近四个月复购客户数',
      type: 'bar',
      stack: 'total',
      barWidth: '40%',
      itemStyle: {
        color: '#FF892B'
      },
      label: {
        show: true,
        color: '#fff',
        fontSize: '14px',
        formatter: (params) => params.value
      },
      emphasis: {
        focus: 'series'
      },
      data: [220, 182, 191]
    },
    {
      name: '综合',
      type: 'bar',
      stack: 'total',
      label: {
        show: true,
        position: 'top',
        formatter: (p) => {
         let arr1 =[100, 302, 301]
         let arr2 =[320, 132, 101]
         let arr3 =[220, 182, 191]
          return arr1[p.dataIndex] + arr2[p.dataIndex] + arr3[p.dataIndex];
        }
      },
      emphasis: {
        focus: 'series'
      },
      data: [0, 0, 0]
    }
  ]
};