一、介绍
    QCustomPlot是一个用于绘图和数据可视化的Qt C++小部件。它没有进一步的依赖关系,提供友好的文档帮助。这个绘图库专注于制作好看的,出版质量的2D绘图,图形和图表,以及为实时可视化应用程序提供高性能。
    QCustomPlot可以导出各种格式,如矢量化的PDF文件和光栅化的图像,如PNG, JPG和BMP。QCustomPlot是用于在应用程序中显示实时数据以及为其他媒体生成高质量图的解决方案。

二、配置
1)下载
官方网站
http://www.qcustomplot.com/
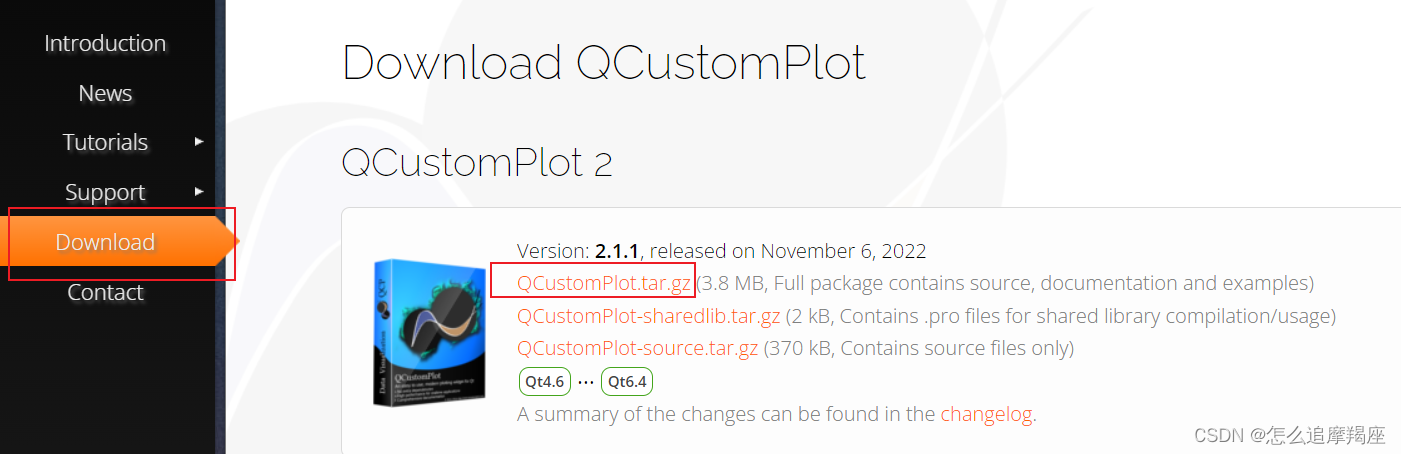
从官网下载文件,选择2.1版本以上,因为这会开始支持Qt6了。可以选择源文件+实例+说明文档全部下载,或者选择下载单动态库或纯源码,文件不大建议全部下载。

2)QtCreator配置
新建一个Qt Widgets Application工程。

把下载好的qcustomplot.h和qcustomplot.cpp放到工程下,右击项目,添加现有文件。

对话框中选择选择qcustomplot.h和qcustomplot.cpp文件添加到项目中,并在pro文件中添加Qt += printsupport。

双击mainwindows.ui进入Designer界面,新建一个widget部件。

右击widget部件,选择提升为...。

     在类名称里面输入QCustomPlot,选择“添加”,然后选择“提升”。

    这里要注意头文件路径,如果你是放在最外层(和pro文件同级),直接默认值就行。如果是放在某文件夹下,比如新建了一个custom文件夹并放置在里面,那么头文件这一栏应该是“custom/qcustomplot.h”。

提升之后,widget类已经被改成QCustomPlot。

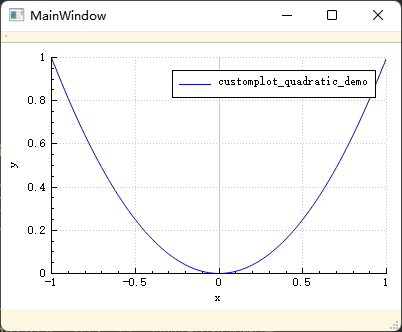
在mianwindows.cpp构造函数添加如下demo代码。
// add two new graphs and set their look:
ui->widget->addGraph();
ui->widget->graph(0)->setPen(QPen(Qt::blue)); // line color blue for first graph
ui->widget->graph(0)->setBrush(QBrush(QColor(0, 0, 255, 20))); // first graph will be filled with translucent blue
ui->widget->addGraph();
ui->widget->graph(1)->setPen(QPen(Qt::red)); // line color red for second graph
// generate some points of data (y0 for first, y1 for second graph):
QVector x(251), y0(251), y1(251);
for (int i=0; i<251; ++i)
{
x[i] = i;
y0[i] = qExp(-i/150.0)*qCos(i/10.0); // exponentially decaying cosine
y1[i] = qExp(-i/150.0); // exponential envelope
}
// configure right and top axis to show ticks but no labels:
// (see QCPAxisRect::setupFullAxesBox for a quicker method to do this)
ui->widget->xAxis2->setVisible(true);
ui->widget->xAxis2->setTickLabels(false);
ui->widget->yAxis2->setVisible(true);
ui->widget->yAxis2->setTickLabels(false);
// make left and bottom axes always transfer their ranges to right and top axes:
connect(ui->widget->xAxis, SIGNAL(rangeChanged(QCPRange)), ui->widget->xAxis2, SLOT(setRange(QCPRange)));
connect(ui->widget->yAxis, SIGNAL(rangeChanged(QCPRange)), ui->widget->yAxis2, SLOT(setRange(QCPRange)));
// pass data points to graphs:
ui->widget->graph(0)->setData(x, y0);
ui->widget->graph(1)->setData(x, y1);
// let the ranges scale themselves so graph 0 fits perfectly in the visible area:
ui->widget->graph(0)->rescaleAxes();
// same thing for graph 1, but only enlarge ranges (in case graph 1 is smaller than graph 0):
ui->widget->graph(1)->rescaleAxes(true);
// Note: we could have also just called ui->widget->rescaleAxes(); instead
// Allow user to drag axis ranges with mouse, zoom with mouse wheel and select graphs by clicking:
ui->widget->setInteractions(QCP::iRangeDrag | QCP::iRangeZoom | QCP::iSelectPlottables);
编译构建项目成功后,执行即可看到demo图表。

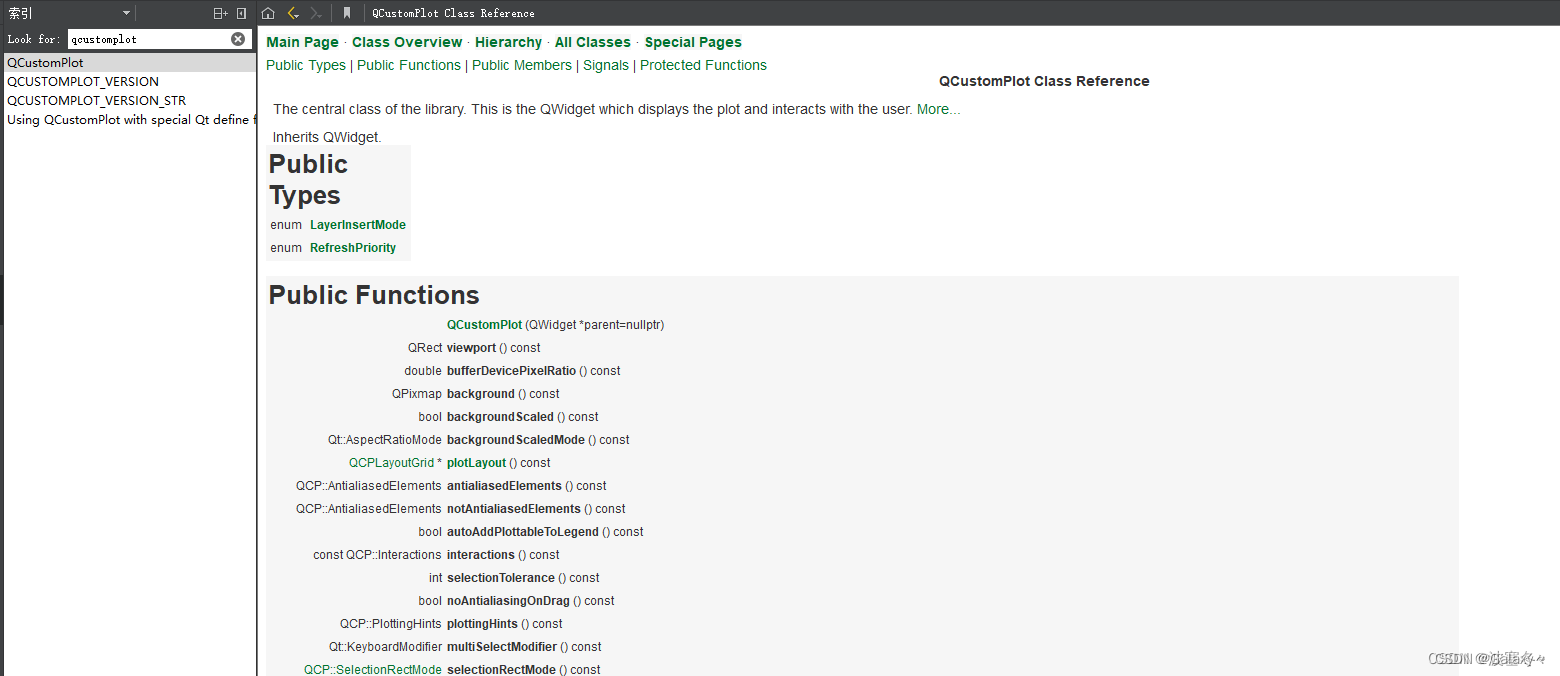
3)添加说明文档
下载的文档可以直接添加到QtCreator的帮助里面。

把文件放到 D:\Qt\Qt5.9.6\Tools\QtCreator\share\doc\qtcreator底下

QtCreator选择工具-选项。

选择-文档-添加,在弹出的界面选择把qcustomplot.qch文件加进来。

如此,我们在帮助界面搜索qcustomplot就可以直接浏览帮助文档。
三、常用功能详解
1)曲线
使用addGraph()方法新建曲线,返回一个QCPGraph对象指针,后续使用此指针或者根据索引获取指针对曲线动作。
建议使用保存对象指针方法操作曲线,因为索引容易误操作,比如当新建两条曲线的时候,删除第一条,第二条索引会从1变成0,高亮的时候索引也会有异常。
//初始化返回类指针
QCPGraph *graph1 = ui->plot->addGraph();
//根据索引获取类指针
QCPGraph *graph1 = ui->plot->graph(index)
如果你需要两条曲线在不同的坐标系,比如X轴相同,Y轴不同,那么就需要在初始化的时候指定坐标系,或者后续指定。
QCPGraph *graph1 = ui->plot->addGraph(ui->plot->xAxis,ui->plot->yAxis);
QCPGraph *graph2 = ui->plot->addGraph(ui->plot->xAxis,ui->plot->yAxis2);
//或者在addGraph之后使用
graph1->setKeyAxis(ui->plot->xAxis);
graph1->setValueAxis(ui->plot->yAxis);
graph2->setKeyAxis(ui->plot->xAxis2);
graph2->setValueAxis(ui->plot->yAxis2);
使用setData()方法设置曲线坐标数据,坐标数据使用QVector封装,使用此方法会覆盖原先的曲线。注意这里x和y的动态数组长度要一致,否则控制台会报错并失效。
QVector x0(251), y0(251);
for (int i=0; i<251; ++i)
{
x[i] = i;
y0[i] = qExp(-i/150.0)*qCos(i/10.0);
}
ui->plot->graph(0)->setData(x0,y0);//写入数据
使用addData()方法在原先基础上添加数据,适用于动态曲线,当然如果一直重新setData也是可以,不建议这么做。
ui->plot->graph(0)->addData(x0, y0)
使用clear()清空数据,但是曲线还保留着。
ui->plot->graph(0)->data()->clear();
使用setName()方法设置曲线名称,name方法返回曲线名称。
ui->plot->graph(0)->setName(QString(“graph1”));
qDebug()<Plot->graph(0)->name();
使用removeGraph()方法传入QCPGraph指针或者索引移除曲线。
ui->plot->removeGraph(0);
ui->plot->removeGraph(graph1);
设置曲线画笔颜色、宽度、样式。
ui->plot->graph(0)->setPen(QPen(QColor(120, 120, 120), 2));
设置曲线使用刷子。
ui->plot->graph(1)->setBrush(QColor(200, 200, 200, 20));

使用setChannelFillGraph()把通道2包含在1里面,这样刷子颜色就不会透视。
QCPGraph *graph2 = ui->widget->addGraph();
graph2->setData(x2, y2);
graph2->setPen(Qt::NoPen);
graph2->setBrush(QColor(200, 200, 200, 20));
graph2->setChannelFillGraph(graph1);

使用setScatterStyle()设置曲线散点的样式。
ui->plot->graph(0)->setScatterStyle(QCPScatterStyle(QCPScatterStyle::ssCircle, QPen(Qt::black, 1.5), QBrush(Qt::white), 9));

2)柱状图
实例化QCPBars()。
QCPBars *bars1 = new QCPBars(ui->widget->xAxis, ui->widget->yAxis);
使用setWidth()设置柱状图宽度
bars1->setWidth(10);
使用setPen()设置画笔
bars1->setPen(QPen(QColor(120, 120, 120), 2));
使用setBrush()设置刷子颜色填充。
bars1->setBrush(QColor(10, 140, 70, 160));
使用moveAbove()设置栏2在1的上方。
bars2->moveAbove(bars1);

3)坐标轴

使用setVisible()方法设置是否显示。
ui->plot->xAxis2->setVisible(true);
ui->plot->yAxis2->setVisible(true);
使用setTickLabels()方法设置是否显示刻度。
ui->widget->xAxis2->setTickLabels(false);
ui->widget->yAxis2->setTickLabels(false);
使用rescaleAxes()方法设置自适应坐标轴,防止因为坐标轴范围过长而出现大量无数据地带
ui->Plot->graph(0)->rescaleAxes();
使用setRange()设置坐标轴范围,使用range()获取坐标轴范围数值。
ui->plot->xAxis->setRange(0, 100);
ui->plot->yAxis->setRange(0, 100);
QCPRange XAxis_Range=ui->plot->xAxis->range();
缩放、自适应等会触发rangeChanged()信号,同步使用setRange(),保证上下、左右坐标一致。
connect(ui->plot->xAxis, SIGNAL(rangeChanged(QCPRange)), ui->plot->xAxis2, SLOT(setRange(QCPRange)));
connect(ui->plot->yAxis, SIGNAL(rangeChanged(QCPRange)), ui->plot->yAxis2, SLOT(setRange(QCPRange)));
3)样式
使用setTickLabelColor()设置坐标轴标签的颜色。
ui->plot->xAxis->setTickLabelColor(Qt::red);
ui->plot->yAxis->setTickLabelColor(Qt::red);
使用setTickPen()设置含标签的刻度的画笔的颜色、线宽和样式。
ui->widget->xAxis->setTickPen(QPen(Qt::red, 1));
ui->widget->yAxis->setTickPen(QPen(Qt::red, 1));
使用setSubTickPen()设置不含标签的刻度的画笔的颜色、线宽和样式。
ui->widget->xAxis->setSubTickPen(QPen(Qt::red, 1));
ui->widget->yAxis->setSubTickPen(QPen(Qt::red, 1));
使用setBasePen()设置坐标轴画笔的颜色、线宽和样式。
ui->plot->xAxis->setBasePen(QPen(Qt::red, 1));
ui->plot->yAxis->setBasePen(QPen(Qt::red, 1));
使用setSubGridVisible()设置是否显示二级网格。
ui->plot->xAxis->grid()->setSubGridVisible(true);
ui->plot->yAxis->grid()->setSubGridVisible(true);

使用setPen()设置网格的画笔的颜色、线宽和样式。
ui->plot->xAxis->grid()->setPen(QPen(QColor(140, 140, 140), 1, Qt::DotLine));
ui->plot->yAxis->grid()->setPen(QPen(QColor(140, 140, 140), 1, Qt::DotLine));
使用setSubGridPen()设置二级网格的画笔的颜色、线宽和样式。
ui->plot->xAxis->grid()->setSubGridPen(QPen(QColor(80, 80, 80), 1, Qt::DotLine));
ui->plot->yAxis->grid()->setSubGridPen(QPen(QColor(80, 80, 80), 1, Qt::DotLine));
使用setZeroLinePen()设置零线的画笔的颜色、线宽和样式。
ui->plot->xAxis->grid()->setZeroLinePen(Qt::NoPen);
ui->plot->yAxis->grid()->setZeroLinePen(Qt::NoPen);
使用setBackground()设置背景颜色,设置渐变色,也可以直接使用图片,纯色刷子来当背景。
QLinearGradient plotGradient;
plotGradient.setStart(0, 0);
plotGradient.setFinalStop(0, 350);
plotGradient.setColorAt(0, QColor(80, 80, 80));
plotGradient.setColorAt(1, QColor(50, 50, 50));
ui->plot->setBackground(plotGradient);
QLinearGradient axisRectGradient;
axisRectGradient.setStart(0, 0);
axisRectGradient.setFinalStop(0, 350);
axisRectGradient.setColorAt(0, QColor(80, 80, 80));
axisRectGradient.setColorAt(1, QColor(30, 30, 30));
ui->widget->axisRect()->setBackground(axisRectGradient);
使用setUpperEnding()设置上轴结束的样式。
ui->plot->xAxis->setUpperEnding(QCPLineEnding::esSpikeArrow);
ui->plot->yAxis->setUpperEnding(QCPLineEnding::esSpikeArrow);

4)图例

使用setVisible()设置图例是否显示。
ui->plot->legend->setVisible(true);
使用setFillOrder()设置图例信息的水平方向。
ui->plot->legend->setFillOrder(QCPLayoutGrid::foColumnsFirst);

使用addElement()设置图例显示的坐标、位置和比例。
ui->plot->plotLayout()->addElement(1 , 0, ui->plot->legend);

使用setBorderPen()设置图例边框颜色、线宽、样式。
ui->plot->legend->setBorderPen(QPen(QColor(140, 140, 140), 1, Qt::DotLine));
使用setRowStretchFactor()设置显示比例,图例所在框的大小。
ui->plot->plotLayout()->setRowStretchFactor(1, 0.001);
5)其他
使用setInteractions()方法设置交互策略
ui->Plot->setInteractions(QCP::iRangeDrag | QCP::iRangeZoom | QCP::iSelectPlottables);
//放大拖拽选中等枚举
enum Interaction { iRangeDrag = 0x001 //左键点击可拖动
,iRangeZoom = 0x002 //范围可通过鼠标滚轮缩放
,iMultiSelect = 0x004 //可选中多条曲线
,iSelectPlottables = 0x008 //线条可选中
,iSelectAxes = 0x010 //坐标轴可选
,iSelectLegend = 0x020 //图例是可选择的
,iSelectItems = 0x040 //可选择项(矩形、箭头、文本项等
,iSelectOther = 0x080 //所有其他对象都是可选的
};
使用replot()重新启动绘制,当你需要一条动态曲线的时候,除了动态的addData(),还需要不断的使用replot()进行后续的绘制。
ui->plot->replot();
保存成Pdf、Png、Jpg、Bmp格式文件。
bool savePdf (const QString &fileName, int width=0, int height=0, QCP::ExportPen exportPen=QCP::epAllowCosmetic, const QString &pdfCreator=QString(), const QString &pdfTitle=QString())
bool savePng (const QString &fileName, int width=0, int height=0, double scale=1.0, int quality=-1, int resolution=96, QCP::ResolutionUnit resolutionUnit=QCP::ruDotsPerInch)
bool saveJpg (const QString &fileName, int width=0, int height=0, double scale=1.0, int quality=-1, int resolution=96, QCP::ResolutionUnit resolutionUnit=QCP::ruDotsPerInch)
bool saveBmp (const QString &fileName, int width=0, int height=0, double scale=1.0, int resolution=96, QCP::ResolutionUnit resolutionUnit=QCP::ruDotsPerInch)

图例与曲线选中状态绑定。
//响应图例被选中信号
connect(ui->channelChart,&QCustomPlot::legendClick,
this,[=](QCPLegend *legend, QCPAbstractLegendItem *item, QMouseEvent *event){
m_grap_A->setSelection(ui->channelChart->legend->item(0)->selected()?
QCPDataSelection(m_grap_A->data().data()->dataRange()):
QCPDataSelection());
}
//响应曲线被选中信号
connect(ui->channelChart,&QCustomPlot::plottableClick,
this,[=](QCPAbstractPlottable *plottable, int dataIndex, QMouseEvent *event){
ui->channelChart->legend->item(0)->setSelected(m_grap_A->selected());
}

QPen样式