之前项目中涉及到了获取硬件信息内容,对CPU的温度监控有点兴趣,观察和百度发现鲁大师和驱动人生的CPU温度监控貌似是用驱动实现的,有点太高大上了,搞不懂。后面经过到处查找资料终于找到了Qt在Windows 环境下监控CPU等硬件温度/运行速度等信息的解决方法。
这一篇注意介绍QCustomPlot库绘制每两秒获取的CPU温度数据:
根据获取的Window系统的CPU温度数据,使用QCustomPlot库绘制温度折线图,包括实现x轴时间线,折现背景渐变绘图,获取温度值,每两秒实时显示温度,等涉及的QCustomPlot库的使用。
目录导读
QCustomPlot库简要介绍(文言一心)
QCustomPlot是一个功能强大、易于使用的Qt C++图形库,它提供了丰富的API和强大的功能,非常适合用于创建各种2D图形和进行数据可视化。无论是静态图形还是实时数据可视化,
QCustomPlot都能提供出色的性能和效果。
基本概述:
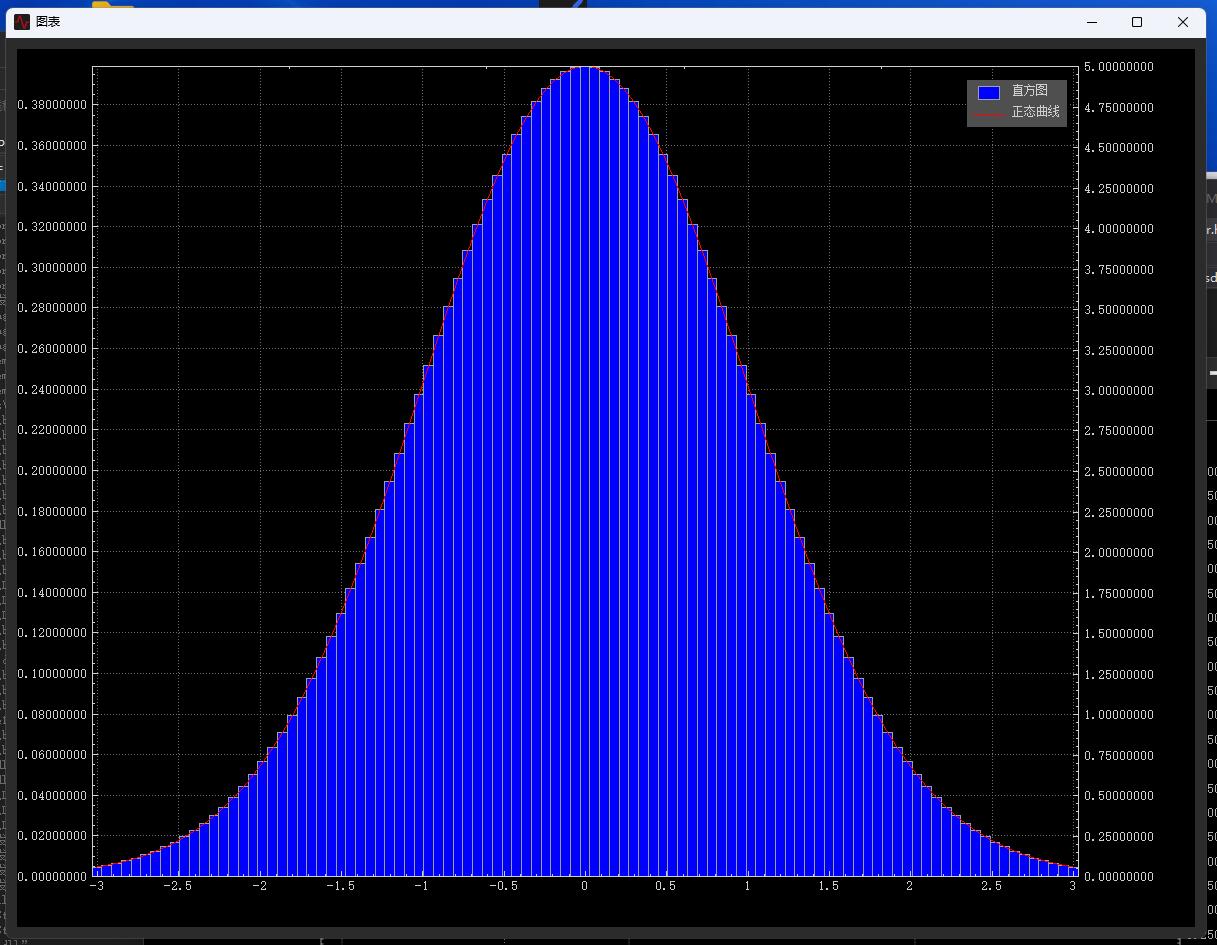
- 功能定位:QCustomPlot是一个用于创建静态或实时2D图形的C++类库,构建在Qt应用框架之上,提供了一套丰富的API用于创建各种常见的2D图形,包括散点图、曲线图、条形图、饼图、直方图等。
- 特点:QCustomPlot没有进一步的依赖关系,并且有据可查。它专注于制作美观、出版质量的2D绘图、图形和图表,以及为实时可视化应用程序提供高性能服务。
- 兼容性:QCustomPlot建立了高达Qt 6.0的兼容性(保持兼容性一直到4.6),并包括许多功能添加、错误修复和较小的改进。它需要C++11支持。
主要特性:
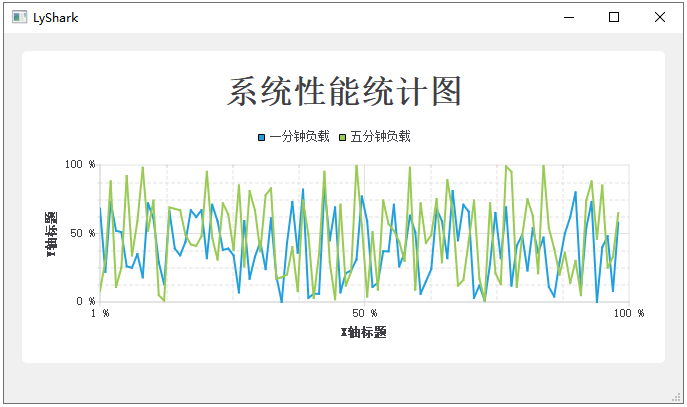
1. 支持多种图形类型: QCustomPlot支持各种类型的2D图形,如线图、散点图、条形图、饼图、直方图等。
2. 数据可视化: 支持多种数据可视化形式,如颜色映射、水平线、垂直线等。
3. 自定义轴: 用户可以在QCustomPlot中自定义轴的范围、标签、刻度线等。
4. 高亮显示和注释: 可以高亮显示图形中的特定部分,并添加注释。
5. 交互性: 支持图形的缩放、平移、选择和鼠标悬停等交互操作。
6. 实时更新: 可以实时更新图形,非常适合展示动态数据。
7. 输出功能: 用户可以将QCustomPlot中的图形保存为各种格式的图像文件(如PDF、PNG、JPG、BMP等),或直接打印出来。
8. 图层控制: 支持多图层绘制,用户可以控制各个图层的顺序和可见性。
9. 自定义图例: 可以自动为用户创建的图形创建图例,用户也可以完全控制图例的样式和位置。
使用参考:
QCustomPlot绘图类详解(大白话)
QCustomPlot 官网
示例是Window系统环境, 使用 Qt Creator 5.13.1 和Mscv2022编译器使用QCustomPlot 库绘制折线图,
只需要引用qcustomplot.h和qcustomplot.cpp文件,
以及在Pro文件中添加QT += printsupport就能直接绘制。
功能描述
根据第三方库每两秒获取的Window系统的CPU温度数据 ,使用QCustomPlot 库绘制温度折线图。
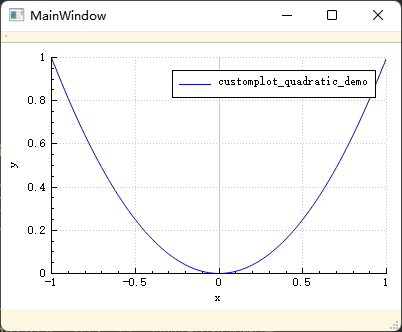
绘制样式一
参考官方interaction示例完成以下样式:

QCustomPlot 控件样式具体实现
//! 表格边框线
customPlot->xAxis->grid()->setSubGridPen(QPen(QColor(80, 80, 80), 1, Qt::DotLine));
customPlot->yAxis->grid()->setSubGridPen(QPen(QColor(80, 80, 80), 1, Qt::DotLine));
customPlot->xAxis->grid()->setSubGridVisible(true);
customPlot->yAxis->grid()->setSubGridVisible(true);

//! 设置 坐标轴是否可选,图例是否可选 实例是否可选
customPlot->setInteractions( QCP::iSelectLegend | QCP::iSelectPlottables);

//! 设置一个默认范围
customPlot->xAxis->setRange(QDateTime::currentSecsSinceEpoch()-120, QDateTime::currentSecsSinceEpoch());
customPlot->yAxis->setRange(0, 100);

//! 完全填充
customPlot->axisRect()->setupFullAxesBox();

customPlot->xAxis->setLabel("时间(S)");
customPlot->yAxis->setLabel("温度(℃)");

//! 启用图例
customPlot->legend->setVisible(true);
//    QFont legendFont = font();
//    legendFont.setPointSize(10);
//    ui->customPlot->legend->setFont(legendFont);
//    ui->customPlot->legend->setSelectedFont(legendFont);
customPlot->legend->setSelectableParts(QCPLegend::spItems); // legend box shall not be selectable, only legend items
customPlot->axisRect()->insetLayout()->setInsetAlignment(0, Qt::AlignTop|Qt::AlignLeft);

//! 设置一个绘图标题
customPlot->plotLayout()->insertRow(0);
QCPTextElement *title = new QCPTextElement(customPlot, "CPU Temperature", QFont("sans", 17, QFont::Bold));
customPlot->plotLayout()->addElement(0, 0, title);
设置X轴为时间轴,此时X轴数据对应值为 [QDateTime::currentSecsSinceEpoch()] :
 QSharedPointer<QCPAxisTickerDateTime> dateTicker(new QCPAxisTickerDateTime);
  dateTicker->setDateTimeSpec(Qt::LocalTime); // 设置日期和时间规范为协调世界时(UTC)
  dateTicker->setTickCount(5); // 设置刻度数量
  dateTicker->setDateTimeFormat("yyyy-MM-dd \n hh:mm:ss");
  customPlot->xAxis->setTicker(dateTicker);
值得注意的是:使用毫秒时间戳[QDateTime::currentMSecsSinceEpoch()]时,X轴转换成时间会混乱,而使用秒[QDateTime::currentSecsSinceEpoch()]X轴时间正常,
但是参考:qcustomplot使用&x轴显示时间 毫秒值是正常的,不知道是不是Qt版本的问题。
在QCustomPlot绘图中添加一条根据鼠标移动移动的竖线(QCPItemLine);
和添加一个点击显示内容的文字框(QCPItemText) 同时绑定到竖线的左侧显示:
	//! 初始化 一个分割线 用于定位鼠标位置
   QPointer<QCPItemLine> Service_Line=new QCPItemLine(customPlot);
    // 设置线的起点为 (5, 0)(注意这里的0可能是Y轴的最小值,也可能是其他值,取决于你的需求)
    Service_Line->start->setType(QCPItemPosition::ptPlotCoords);
    qint64 Line_x=QDateTime::currentSecsSinceEpoch()+5;
    Service_Line->start->setCoords(Line_x, 0); // X=5, Y轴最小值处
    // 设置线的终点为 (5, 1)(这里的1表示Y轴的最大值,使用轴的比例坐标)
    Service_Line->end->setType(QCPItemPosition::ptPlotCoords);
    Service_Line->end->setCoords(Line_x, 100); // X=5, Y轴最大值处

    // 设置线的颜色和线宽等属性(可选)
    Service_Line->setPen(GetCPItemLinePen(customPlot->size())); // 红色,线宽为2
    Service_Line->setVisible(true);

    //!初始化 一个文本框
    QPointer<QCPItemText> Service_Text= new QCPItemText(customPlot);//在QCustomplot中新建文字框
    Service_Text->setPositionAlignment(Qt::AlignRight|Qt::AlignTop);//文字布局:顶、左对齐
    Service_Text->position->setType(QCPItemPosition::ptAxisRectRatio);//位置类型(当前轴范围的比例为单位/实际坐标为单位)
    Service_Text->position->setCoords(0.4, 0.05); //把文字框放在X轴的中间,Y轴的最顶部
    Service_Text->setText("Text Item Demo");
    Service_Text->setPen(QPen(Qt::white)); //字体颜色
    Service_Text->setPadding(QMargins(2,2,2,2));
    Service_Text->position->setParentAnchorX(Service_Line->anchor("start"));
    Service_Text->setColor(Qt::white);
    Service_Text->setBrush(QColor("#383F5B"));
    Service_Text->setVisible(false);
参考:QCustomPlot系列(6)-在图中插入文本框/直线箭头/图片/矩形/椭圆/游标等
- 使用QLinearGradient 实现渐进效果:
给(QCPItemLine)竖线添加一个从上到下,从白色到黑色在到白色的渐进效果画笔;
QPen InitPlotDefaultStyle::GetCPItemLinePen(QSize size)
{
    //! 设置渐进
    //! 因为 QLinearGradient 需要设置高度大小 所以需要动态修改,参考:
    //! QGradient(渐变填充): https://blog.csdn.net/qq_45303986/article/details/127934344
    //!
    QLinearGradient gradient(0, 15, 0, size.height()-25); // 从 (0,0) 到 (100,100) 的渐变
    gradient.setColorAt(0, QColor(255, 255, 255, 0));
    gradient.setColorAt(0.5, Qt::black);
    gradient.setColorAt(1, QColor(255, 255, 255, 0));
    // 创建一个 QBrush 并设置渐变
    QBrush brush(gradient);

    QPen Pen;
    Pen.setColor(Qt::black);
    Pen.setWidth(3);
    Pen.setBrush(brush);
    return Pen;
}
注意:
在使用QLinearGradient 实现渐变效果时,需要设置QCustomPlot控件的高度,这意味着需要在QCustomPlot控件大小发生变化时,刷新画笔;
需要在QCustomPlot 控件的resizeEvent事件中添加一个resizeChange信号
/*! \internal

  Event handler for a resize of the QCustomPlot widget. The viewport (which becomes the outer rect
  of mPlotLayout) is resized appropriately. Finally a \ref replot is performed.
*/
void QCustomPlot::resizeEvent(QResizeEvent *event)
{
  Q_UNUSED(event)
  // resize and repaint the buffer:
  setViewport(rect());
  replot(rpQueuedRefresh); // queued refresh is important here, to prevent painting issues in some contexts (e.g. MDI subwindow)

  // update add
  emit resizeChange(event->size());
}
然后绑定信号实时修改绘制的画笔:
//! 控件大小改变
//connect(customPlot,&QCustomPlot::resizeChange,this,&InitPlotDefaultStyle::Slots_resizeChange);
void InitPlotDefaultStyle::Slots_resizeChange(QSize size)
{
	if(!Service_Line.isNull())
	    Service_Line->setPen(GetCPItemLinePen(size));

	//! 折线图下面的渐变
	for(int i=0;i<graphs.count();i++)
	{
	    graphs[i]->setBrush(GetGraphsBrush(customPlot->size(),colorPen[i]));
	}
}
同样使用QLinearGradient 实现折线到白色透明的一个渐变,同时在大小改变 resizeChange信号时刷新画笔刷子;
QBrush InitPlotDefaultStyle::GetGraphsBrush(QSize size,QColor color)
{
    //! 创建渐进效果
    QLinearGradient gradient(0, 10, 0, size.height()-20); // 从 (0,0) 到 (100,100) 的渐变
    gradient.setColorAt(0, color); // 起点颜色为红色
    gradient.setColorAt(1, QColor(255, 255, 255, 0)); // 终点颜色为透明
    //! 创建一个 QBrush 并设置渐变
    QBrush brush(gradient);
    return brush;
}
初始化每个CPU核心对应的QCPGraph绘图,并随机颜色,设置绘图图层和渐变效果。
void InitPlotDefaultStyle::InitGrap(QStringList keys)
{
    KeysV.clear();
    //! 记录每条折线图对映画笔颜色,用于渐变
    colorPen.clear();
    //! 保存每个折线的 QCPGraph*
    graphs.clear();

    //! 图例名称
    KeysV.append(keys);
    for(int i=0;i<KeysV.count();i++)
    {
        QCPGraph *graph1 = customPlot->addGraph();

        //! 随机颜色
        QColor pencolor=QColor(std::rand()%245+10, std::rand()%245+10, std::rand()%245+10);
        colorPen.append(pencolor);

        //! 设置画笔
        QPen graphPen;
        graphPen.setColor(pencolor);
        graphPen.setWidthF(2);
        graph1->setPen(graphPen);
        //!  圆点
        graph1->setScatterStyle(QCPScatterStyle(QCPScatterStyle::ssCircle, QPen(Qt::black, 1.5), QBrush(Qt::white), 2));
        //! 随机点样式
//        if (std::rand()%100 > 50)
//        graph1->setScatterStyle(QCPScatterStyle((QCPScatterStyle::ScatterShape)(std::rand()%14+1),5));

        //! 设置渐进绘图 从线向下绘图
        graph1->setBrush(GetGraphsBrush(customPlot->size(),pencolor));
        graph1->setName(KeysV[i]);
        graph1->setLineStyle((QCPGraph::lsLine));

        //! 设置所在图层
        customPlot->addLayer(QString(KeysV[i]).toStdString().c_str(), customPlot->layer("main"), QCustomPlot::limAbove);
        graph1->setLayer(QString(KeysV[i]).toStdString().c_str());

        graphs.append(graph1);
    }
    customPlot->replot();

}
绑定每两秒监测线程传来的数据,
void InitPlotDefaultStyle::AddDataToCpuKeyValue(qint64 row,QList<double> Data)
{
    customPlot->xAxis->setRange(row,120, Qt::AlignRight);
    for (int i = 0; (i < Data.count() && i < customPlot->graphCount()); ++i) {
        customPlot->graph(i)->addData(row, Data[i]);
    }
    customPlot->replot();
}
值得注意的是设置X轴的 setRange 使最新的内容始终显示在最右边,
120为整个x轴显示间隔120秒内的数据:
customPlot->xAxis->setRange(row,120, Qt::AlignRight);
row 为 QDateTime::currentSecsSinceEpoch() 数据。
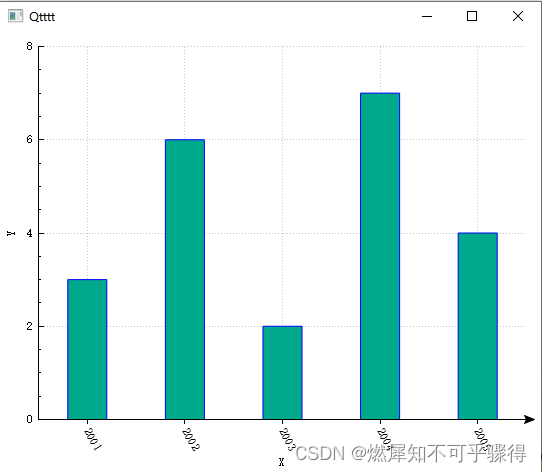
绘制样式二
参考官方的axis-tags示例完成以下样式,显示CPU最新温度:

在上面 QCustomPlot 控件样式的基础上进行修改
void InitPlotDetailStyle::InitGrap(QStringList keys)
{

    KeysV.clear();
    colorPen.clear();
    graphs.clear();
    KeysV.append(keys);
    for(int i=0;i<KeysV.count();i++)
    {
//        customPlot->axisRect()->axis(QCPAxis::atRight, i)->setPadding(30);
        QCPGraph *graph1 = customPlot->addGraph();

        //! 随机颜色
        QColor pencolor=QColor(std::rand()%245+10, std::rand()%245+10, std::rand()%245+10);
        colorPen.append(pencolor);

        //! 设置画笔
        QPen graphPen;
        graphPen.setColor(pencolor);
        graphPen.setWidthF(2);
        graph1->setPen(graphPen);

        QCPAxis * tagAxis= customPlot->axisRect()->addAxis(QCPAxis::atRight);
        tagAxis->setRange(0,100);
        tagAxis->setTickLabels(false);
        tagAxis->setPadding(55);
        // create tags with newly introduced AxisTag class (see axistag.h/.cpp):
        AxisTag* mTag1 = new AxisTag(tagAxis);
        mTag1->setPen(graphPen);
        //! QList<QPointer<AxisTag>>
        graphs_AxisTag.append(mTag1);

        //!  圆点
        graph1->setScatterStyle(QCPScatterStyle(QCPScatterStyle::ssCircle, QPen(Qt::black, 1.5), QBrush(Qt::white), 2));
        //! 随机点样式
//        if (std::rand()%100 > 50)
//        graph1->setScatterStyle(QCPScatterStyle((QCPScatterStyle::ScatterShape)(std::rand()%14+1),5));

        //! 设置渐进绘图 从线向下绘图
        graph1->setBrush(GetGraphsBrush(customPlot->size(),pencolor));
        graph1->setName(KeysV[i]);
        graph1->setLineStyle((QCPGraph::lsLine));

        //! 设置所在图层
        customPlot->addLayer(QString(KeysV[i]).toStdString().c_str(), customPlot->layer("main"), QCustomPlot::limAbove);
        graph1->setLayer(QString(KeysV[i]).toStdString().c_str());

        graphs.append(graph1);
    }
    customPlot->replot();

}
AxisTag 类是官方示例中的 "axistag.h"文件中的类,
与上面初始化QCPGraph类 不同的是
每添加一条折线图就需要在右边添加一个Y轴,并赋值给AxisTag类:
customPlot->axisRect()->addAxis(QCPAxis::atRight)
修改绑定数据的同时,修改 AxisTag类的值;
void InitPlotDetailStyle::AddDataToCpuKeyValue(qint64 row,QList<double> Data)
{
    customPlot->xAxis->setRange(row,120, Qt::AlignRight);
    for (int i = 0; (i < Data.count() && i < customPlot->graphCount()); ++i) {
        customPlot->graph(i)->addData(row, Data[i]);

        graphs_AxisTag[i]->updatePosition(Data[i]);
        graphs_AxisTag[i]->setText(QString::number(Data[i], 'f', 2));
    }
    customPlot->replot();

}


![[ICS] Inferno(地狱) ETH/IP未授权访问,远程控制工控设备利用工具](https://img-blog.csdnimg.cn/img_convert/92c2e92a91b4f29ca1fb22112176dd24.jpeg)