1. 前言:
随着科技的进步,互联网发展,能网上办理的就网上办理,按装一个app客户端,连接后台服务,只要是有网络就OK.便捷,快速,省事.但随之而来的是pc端上安装的应用越来越多,系统资源越来越不够用.这也一定程度上对应用程序有一定的要求,除了实现其功能外,性能也是需要关注的.
2. 目的
有了前言背景,那也不难理解,本文编写的目的即如何关注监测应用进程的性能.一般来说这也是跟业务脱不开关系.指标其实很简单与服务器性能指标相同还会更简单一些,比如cpu,内存使用率等.场景也就是核心的业务场景.比如一个应用具有杀毒,基线扫描与修复功能等,那就需要关注在杀毒或是基线扫描与修复时其进程使用cpu与内存使用情况,还有一个就是稳定性,在没有进行业务逻辑操作时,长时间的挂着应用会对系统有何影响等.
3. 实现方式
目标明确了,那就是如何实现,本文会使用比较流行常用的监控工具,有完整的操作手册,还支持跨平台操作.那就是当仁不让的工具"prometheus+grafana",工具是现成的,就是数据采集跟服务器端还是有一定的差别的.这里实现的是在pc端采集数据主动推送到prometheus进而再在grafana里展现出来.
最终展示出来的结果如下:

3.1. 环境准备
python环境,prometheus+grafana服务器
3.2. 具体操作
首先是使用python调用prometheus_client客户端函数,使用数据推送到prometheus pushgateway里,下面为python实现获取本地应用进程使用cpu,内存数据,然后推送到prometheus pushgateway.
3.2.1. python脚本
# -*- coding: utf-8 -*-
# @Time    : 2024-3-30
# @Author  : zhh
# @Version :
# @File    : app_perf.py
# @Software: PyCharm

# pip install psutil matplotlib prometheus_client
import time
import threading
import psutil
# import matplotlib.pyplot as plt
from prometheus_client import CollectorRegistry, Counter, Gauge, push_to_gateway
import os
from datetime import datetime
import platform
import socket

# 获取当前系统基本信息
def get_local_ip():
    try:
        # 获取当前系统类型system_type
        system_type = platform.system()
        # 创建一个Socket对象
        s = socket.socket(socket.AF_INET, socket.SOCK_DGRAM)
        # 获取当前系统名
        fqdn = socket.getfqdn()
        # 连接到远程主机,这里选择Google的DNS服务器
        s.connect(("8.8.8.8", 80))
        # 获取本地IP地址
        local_ip = s.getsockname()[0]
        # 关闭Socket连接
        s.close()
        return fqdn, system_type, local_ip,
    except Exception as e:
        print("获取系统信息出错:", e)
        return None
def pushgetway(cpu,mem,process):
    fqdn,system_type,local_ip=get_local_ip()
    registry = CollectorRegistry()
    if system_type=="Linux":
        process = process+"Linux"
    # 定义获取cpu
    c = Gauge('cpu_usage', 'get cpu usage', ['processName','platform','instance','hostname','hostIP'], registry=registry)
    c.labels(processName=process,platform=system_type,instance="",hostname=fqdn,hostIP=local_ip).set(cpu)  # +1
    # 定义获取memroy
    m = Gauge('memory_usage', 'get mem usage', ['processName','platform','instance','hostname','hostIP'], registry=registry)
    m.labels(processName=process,platform=system_type,instance="",hostname=fqdn,hostIP=local_ip).set(mem)  # -10

    push_to_gateway('10.90.21.12:9091', job=process, registry=registry)
def get_process_info(process_name):
    pid = None
    num_cores = psutil.cpu_count(logical=True)
    for proc in psutil.process_iter(['pid', 'name']):
        if proc.info['name'] == process_name:
            pid = proc.info['pid']
            break

    if pid is not None:
        process = psutil.Process(pid)
        cpu_percent = process.cpu_percent(interval=1)
        # total_cpu_percent = cpu_percent / num_cores
        # memory_percent = process.memory_percent()
        # return cpu_percent, memory_percent
        # 获取内存信息(返回字节数)
        memory_info = process.memory_info()
        # 获取进程的rss即物理内存,将字节数转换为MB
        memory_in_mb = memory_info.rss / (1024 * 1024)
        # print(f"当前进程使用的内存: {memory_in_mb:.2f} MB")
        return cpu_percent, memory_in_mb
    else:
        return None, None
# 写入时间def write_file(process,cpu,mem):
#     # print(process,cpu,mem)
#     # 获取当前执行工作的绝对路径
#     current_path = os.path.abspath(os.getcwd())
#     file_path = os.path.join("", current_path, process+"_perf.txt")
#     # print('Current Working Directory:', file_path)
#     # 获取当前日期和时间
#     current_datetime = datetime.now()
#     # 格式化时间为指定格式
#     formatted_time = current_datetime.strftime("%Y-%m-%dT%H:%M:%S")
#     # print('Current Date and Time:', formatted_time)
#
#     # 打开一个txt文件,如果文件不存在会自动创建并追加数据
#     with open(file_path, 'a') as file:
#         content = formatted_time + " " + str(cpu) + " " + str(mem) + "\n"
#         # 追加数据到文件
#         file.write(content)
#     # print('Additional data has been saved to example.txt')、cpu、memory到执行目录的app_perf.txt文件中


# 定义一个函数,作为线程要执行的任务
def task(process):
    cpu_percent, memory_in_mb = get_process_info(process)
    print("*****",process,cpu_percent,memory_in_mb)
    if cpu_percent is not None:
        # print("***task****",process, cpu_percent, memory_in_mb)
        pushgetway(cpu_percent, memory_in_mb, process)
        # write_file(process,cpu_percent, memory_in_mb)


# Press the green button in the gutter to run the script.
if __name__ == '__main__':
    fqdn, system_type, local_ip = get_local_ip()
    if system_type=="Darwin":
        process_name = ["CAZeroTrust", "com.chiansecurity.caztpmac.helper", "CASAviraService",
                        "FileService","NetAccess","CASBaseEndpointSecurity"]  # macOS替换成你要监控的进程名
    elif system_type=="Windows":
        process_name = ["caztpaui.exe", "caztpasvc.exe", "caztpawh.exe", "caztpAV.exe","caztpasw.exe"]

    elif system_type == "Linux":
        process_name = ["caztp", "CAZeroTrust", "catray"]

    while True:
        # 创建多个线程并启动
        threads = []
        for i in range(len(process_name)):
            t = threading.Thread(target=task, args=(process_name[i],))
            threads.append(t)
            t.start()

        # 等待所有线程执行完毕
        for t in threads:
            t.join()

        # print("All threads have finished.")
        # break
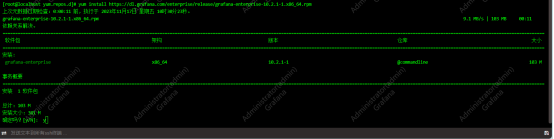
3.2.2. prometheus+grafana服务器搭建
在此使用的是macOS系统,当时下载了个docker桌面应用,启动后自动的就有docker-compose组件.只需做好配置文件,直接启动docker-compose即可.
需要注意的也就是两个配置文件:docker-compose.yml, prometheus.yml
version: "3"
services:
  prometheus:
    image: prom/prometheus:v2.36.2
    container_name: prometheus
    volumes:
      - ./prometheus.yml:/etc/prometheus/prometheus.yml
      - ./data/prometheus_data:/prometheus
    ports:
    - "9090:9090"

  grafana:
    image: grafana/grafana:9.0.1
    container_name: grafana
    volumes:
      - ./data/grafana_data:/var/lib/grafana
      #- ./grafana/provisioning:/etc/grafana/provisioning
    environment:
      - GF_SECURITY_ADMIN_USER=admin
      - GF_SECURITY_ADMIN_PASSWORD=hogwarts
      - GF_USERS_ALLOW_SIGN_UP=false
    ports:
      - "3000:3000"

  influxdb:
    image: influxdb:1.8.10
    container_name: influxdb
    ports:
      - "8086:8086"
    volumes:
      - ./data/influxdb_data:/var/lib/influxdb
Prometheus.yml文件内容如下:
# my global config
global:
  scrape_interval: 15s # Set the scrape interval to every 15 seconds. Default is every 1 minute.
  evaluation_interval: 15s # Evaluate rules every 15 seconds. The default is every 1 minute.
  # scrape_timeout is set to the global default (10s).

# Alertmanager configuration
alerting:
  alertmanagers:
    - static_configs:
        - targets:
          # - alertmanager:9093

# Load rules once and periodically evaluate them according to the global 'evaluation_interval'.
rule_files:
  # - "first_rules.yml"
  # - "second_rules.yml"

# A scrape configuration containing exactly one endpoint to scrape:
# Here it's Prometheus itself.
scrape_configs:
  # The job name is added as a label `job=<job_name>` to any timeseries scraped from this config.
  - job_name: "prometheus"

    # metrics_path defaults to '/metrics'
    # scheme defaults to 'http'.

    static_configs:
      - targets: ["localhost:9090"]

  - job_name: redis_exporter
    static_configs:
      - targets:
        - 10.1.1.11:9121

  - job_name: node_exporter
    static_configs:
      - targets:
        - 10.1.1.11:9100

  - job_name: pushgateway
    static_configs:
      - targets:
        - pushgateway:9091
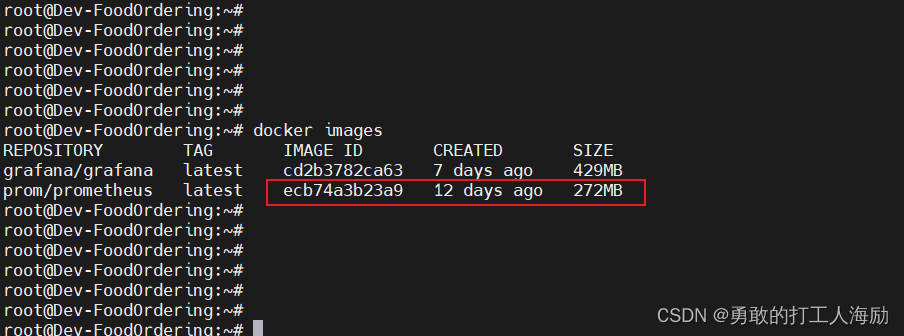
启动docker-compose
创建文件夹,把上面的文件放入到文件夹中,再创建一个空的data数据存储文件夹.如"/docker/monitoring"

cd /docker/monitoring #进入到此文件夹下
docker-compose up -d #执行一键启动docker-compose ,数据文件夹data,配置文件docker-compose.yml与prometheus.yml配置正确

启动成功后在浏览器中输入"http://10.90.21.12:9090/targets?search="

在浏览器输入"http://10.90.21.12:9091/"即可看到各客户端推送的数据


3.2.3. 数据源与面板展示配置
浏览器输入"http://10.90.21.12:3000/"打开grafana,进行数据源与展示的数据面板配置

面板是自定义的面板:


4. 其他
无

![[zabbix] 分布式<span style='color:red;'>应用</span>之<span style='color:red;'>监控</span>平台zabbix<span style='color:red;'>的</span>认识<span style='color:red;'>与</span><span style='color:red;'>搭</span><span style='color:red;'>建</span>](https://img-blog.csdnimg.cn/direct/fff1d695608b413c84fca578470c826d.png)