Title
题目
Automatic scan range for dose-reduced multiphase CT imaging of theliver utilizing CNNs and Gaussian models
自动扫描范围在减少剂量多相CT肝脏成像中的应用:基于CNN和高斯模型
01
文献速递介绍
肝癌是全球癌症死亡的第四大原因,每年全球约有100万例新病例(Bray等人,2018)。肝癌在东亚、东南亚和非洲等发展中国家的发病率显著增加(McGlynn和London,2011)。尽管MRI有时作为一种低辐射暴露的成像模式用于肝癌诊断,但多期CT扫描由于成本低和时间效率高通常是首选。然而,CT使用电离辐射,因此与肝脏检查相关。在我们的肝脏范围检测实验中,LRS在较低端和较高端的缺失肝脏范围分别为7.8毫米和2.1毫米。这种不对称性可以通过下部肝脏形状较窄、而上部肝脏形状较圆来解释,导致肝脏检测性能的差异。我们推测这些值也取决于数据集的质量和切片间距。然而,我们建议进一步的研究需要调整这些值以获得更好的准确性;我们预计这种差异可能不超过扫描中的一两个切片。
肝脏运动是影响多期CT肝脏成像后续扫描范围的主要因素之一。解剖学上,肝脏运动主要受呼吸运动驱动。我们没有尝试从单张CT图像中估计呼吸状态。正如Demircioğlu等人(2021)的研究报告中所述。
Abstract
摘要
肝脏多期CT扫描在多种临床应用中被广泛使用;然而,CT扫描的辐射暴露给患者带来了非常重要的癌症风险。可以通过确定第一扫描阶段中感兴趣目标位置来减少辐射剂量,即决定后续扫描的扫描范围。本研究旨在提出和评估一种自动确定多期CT扫描扫描范围的方法。我们的策略首先是应用基于CNN的方法在2D切片中检测肝脏,并使用肝脏范围搜索算法在侦察体积中检测肝脏范围。通过将高斯肝脏运动模型中获得的安全边界添加到侦察所确定的扫描范围,可以获得后续扫描的目标肝脏扫描范围。实验使用来自多家医院的657个多期CT体积进行。实验结果显示,所提出的肝脏检测方法平均能够在一秒钟内检测出224个3D体积中的223个肝脏,平均交集联盟率、壁距离和质心距离分别为85.5%、5.7毫米和9.7毫米。此外,所提出的肝脏检测方法在肝脏检测准确性方面与最先进的3D肝脏检测器相当,但需要更少的处理时间。此外,我们将肝脏扫描范围生成方法应用于来自两家医院的46名患者的射频消融和Y-90经动脉放射性栓塞(选择性内放射治疗)干预中获得的肝脏CT图像。结果显示,自动扫描范围生成方法相比Y-90经动脉放射性栓塞手动操作可以平均降低14.5%(2.56毫西弗)的有效辐射剂量,而对于来自射频消融干预的CT图像,性能没有统计学显著差异(p = 0.81)。最后,三名放射科医生评估原始图像和范围减少图像,以评估范围减少方法对其临床决策的影响。我们得出结论,自动肝脏扫描范围生成方法能够高精度地减少相比手动操作的过度辐射,而不影响临床决策。
Method
方法
2.1. Data, annotations and preprocessingFor our study, we used 657 abdominal CT images from threesources. The first dataset is retrospectively reused from our previous study (Luu et al., 2018; 2021) which contains diagnostic(EMC**diag subset, 202 volumes) and intra-interventional (EMC**intrasubset, 147 volumes) CT images in RFA liver cancer treatmentof 51 patients in Erasmus MC, Rotterdam. The diagnostic scanswere performed under either a three or four-phase protocol (LipPauwels et al., 2012) while the radiographer, with the aim of minimizing the liver scan range, scanned the interventional imagesmanually. All images where the scan range did not cover the wholeliver were excluded in the test phase of this study because thefield of view of these images focuses on the ablator at the current tumor rather than on the whole liver. The second dataset contains 210 contrast enhanced CT volumes of the liver, portal venous phase, which are publicly available from the LiTS Challenge(LiT S dataset) (Bilic et al., 2019) and Mayo Clinic (Mayo dataset)(McCollough et al., 2017). The third dataset contains the three/fourphase contrast enhanced CT diagnostic and follow-up images fromY-90 SIRT treatment of 36 liver cancer patients in Hanoi’s Hospital-108 (H108 dataset), which was retrospectively collected in our previous study Mai et al. (2021). For 29 of the patients in the H108dataset, the diagnostics images are available (H108**diag subset) andfor 14 of the patients the follow-up, post treatment CT images(H108**post subset) acquired one to three months after the intervention are available. All the data was anonymized before being usedin this study. The dataset from EMC, Mayo and H108 were acquiredunder a low radiation dose protocol (Mai et al., 2021; Hoang et al.,2019; Lip-Pauwels et al., 2012) while the LiT S dataset was acquiredunder regular dose protocol. The characteristics of the datasets aredescribed in detail in Table 1.
在我们的研究中,我们使用了来自三个来源的657张腹部CT图像。第一个数据集是从我们之前的研究中重新使用的(Luu等人,2018年;2021年),包括来自鹿特丹伊拉斯姆斯医学中心的51名肝癌患者在RFA治疗中的诊断(EMC diag子集,202卷)和介入性(EMC intra子集,147卷)CT图像。诊断扫描根据三相或四相协议进行(Lip-Pauwels等人,2012年),而放射技师在手动扫描介入图像时旨在最小化肝脏扫描范围。
第二个数据集包含210个增强CT肝脏体积的图像,为公开的LiTS挑战(LiTS数据集)(Bilic等人,2019年)和梅奥诊所(Mayo数据集)(McCollough等人,2017年)提供。这些图像处于门静脉期。第三个数据集包含36名肝癌患者在河内108医院接受Y-90 SIRT治疗的三/四相增强CT诊断和随访图像(H108数据集),这些数据集在我们之前的研究中进行了回顾性收集(Mai等人,2021年)。H108数据集中的29名患者有诊断图像可用(H108 diag子集),14名患者有随访治疗后1-3个月获取的CT图像可用(H108 post子集)。所有数据在使用前均已匿名化。来自EMC、Mayo和H108的数据集是根据低辐射剂量协议获取的(Mai等人,2021年;Hoang等人,2019年;Lip-Pauwels等人,2012年),而LiTS数据集则是根据常规剂量协议获取的。这些数据集的详细特征在表1中有详细描述。
Conclusion
结论
In this study, we have proposed and evaluated an novel methodfor automatically generating scan ranges of the liver in multiphaseCT images, and showed that machine-learning techniques are veryeffective in determining the scan range in multiphase CT scans inclinical practice. The method is based on a CNN model (YOLOv4)for detecting the liver in 2D slices, and LRS for fast liver range detection in a scout volume. Additionally, we estimate the liver motion range in the scan range generation using Gaussian models. Experiments on datasets from several hospitals showed that the liverdetection can be performed within one second and the accuracy iscomparable to the best state-of-the-art CNN detectors of the liverin CT images. The evaluation on the potential to reduce the scanrange showed that the machine-generated scan range is not statistically different to the scan range manually obtained by the radiographer when the imaging focuses on the liver, while the methodcan significantly reduce the effective radiation dose in each sessionof scans by 14.5% on average, when the imaging does not only focus on the liver. Additionally, three medical experts concluded thatthe range reduction in both the arterial and delayed phase doesnot affect the clinical decisions.
本研究提出并评估了一种新颖的方法,用于自动在多期CT图像中生成肝脏的扫描范围,并展示了机器学习技术在临床实践中确定多期CT扫描中肝脏扫描范围的有效性。该方法基于CNN模型(YOLOv4)在2D切片中检测肝脏,并使用LRS在预扫描体积中快速检测肝脏范围。此外,我们利用高斯模型估计扫描范围内的肝脏运动范围。在来自多家医院的数据集上的实验显示,肝脏检测可以在一秒内完成,并且准确性与CT图像中最先进的CNN检测器相当。关于减少扫描范围的潜力评估显示,机器生成的扫描范围与放射技师手动获取的扫描范围在聚焦于肝脏成像时没有统计学上的差异,而在不仅聚焦于肝脏成像时,该方法平均可以显著减少每次扫描的有效辐射剂量达到14.5%。此外,三位医学专家得出结论,动脉期和延迟期的范围缩减不会影响临床决策。
Figure
图
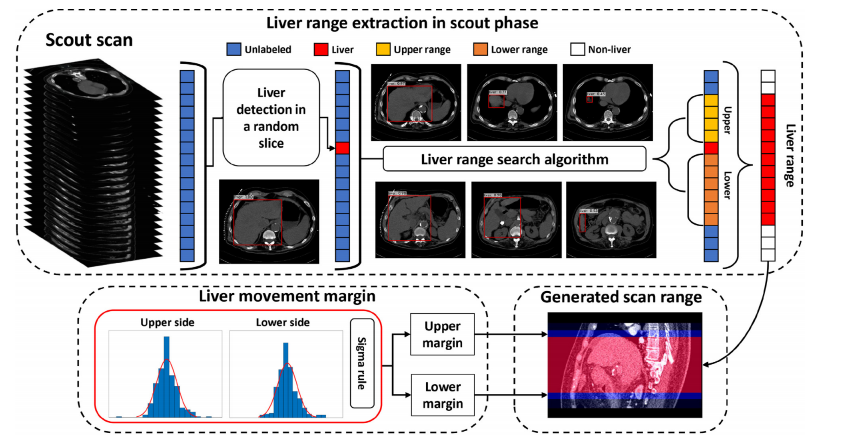
Fig. 1. Block diagram of the proposed method for delineating the scan range in multiphase CT imaging of the liver.
图1. 提出的多期CT肝脏成像扫描范围划定方法的块图。
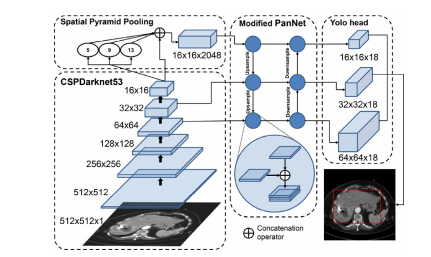
Fig. 2. Architecture of YOLOv4 for the task of liver detection in a 2D CT image.
图2. YOLOv4在2D CT图像中用于肝脏检测的架构。
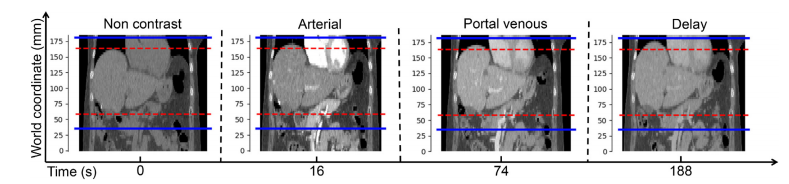
Fig. 3. The liver motion in a multiphase CT image of the liver: the scans were performed at four specific time points. The red dashed lines depict the live range in the firstCT image and the blue solid lines indicate the delineated scan range. Note that in this study, we applied the delineated scan range on the arterial image and delayed imagebased on the Goldman’s protocol.
图3. 肝脏多期CT图像中的肝脏运动:扫描在四个特定时间点进行。红色虚线表示第一个CT图像中的实时范围,蓝色实线表示划定的扫描范围。请注意,在本研究中,我们根据Goldman协议将划定的扫描范围应用于动脉期图像和延迟期图像。
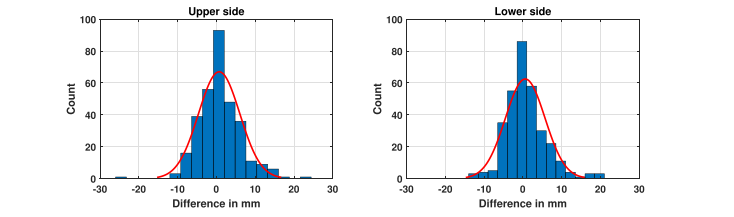
Fig. 4. The distribution and Gaussian fitting of the motion w.r.t. the upper and the lower liver among the phases of the CT scanning.
图4. 在CT扫描的各个阶段中,关于上肝和下肝运动的分布及高斯拟合。
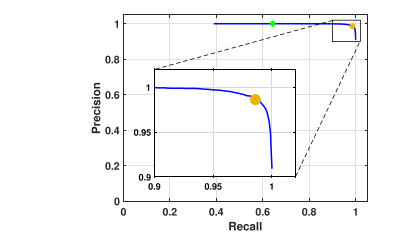
Fig. 5. Precision-Recall curve w.r.t. confidence scores of the liver detection usingYOLOv4 on the validation dataset. The blue point is at confidence score of 0.95 (precision and recall of 1 and 0.64, respectively) while the yellow point is at confidencescore of 0.1 (precision and recall of 0.98 and 0.98, respectively).
图5. 使用YOLOv4在验证数据集上进行肝脏检测的精确率-召回率曲线,关于置信度分数。蓝色点位于置信度为0.95(精确率为1,召回率为0.64),而黄色点位于置信度为0.1(精确率为0.98,召回率为0.98)。
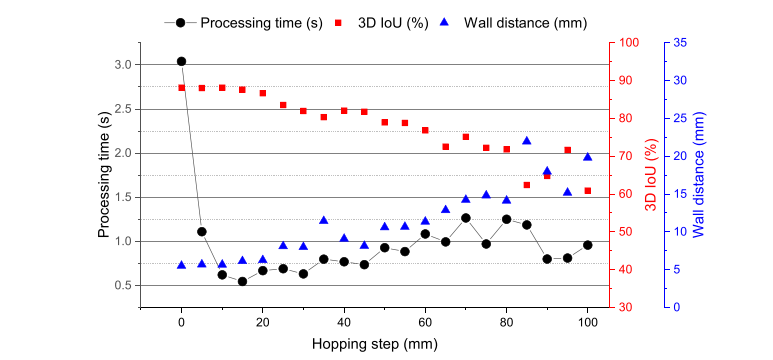
Fig. 6. The effect of varying the number of hopping step HS in LRS algorithm on the accuracy of the liver detection and processing time.
图6. 在LRS算法中变化跳跃步数HS对肝脏检测精度和处理时间的影响。
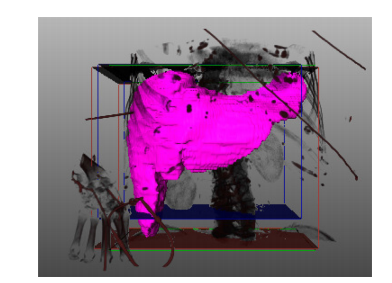
Fig. 7. An example of 3D bounding box liver detections on an intra-interventionalCT image of the liver: the green lines illustrate the ground truth of the upper andthe lower liver bounding box. The dark blue planes denote the upper and lowerextents of the liver bounding box detection by Modified 3D faster R-CNN (Xu et al.,2019b), while the dark red planes show the upper and the lower liver bounding boxdetermined by LRS.
图7. 肝脏介入术中CT图像上的3D边界框肝脏检测示例:绿色线显示上肝和下肝边界框的真实情况。深蓝色平面表示修改的3D Faster R-CNN(Xu等人,2019b)检测到的肝脏边界框的上下界限,而深红色平面显示LRS确定的上肝和下肝边界框。
Table
表
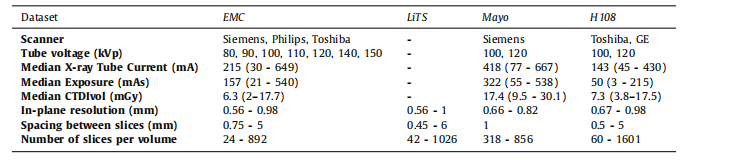
Table 1The detailed characteristics of each of the datasets.
表1每个数据集的详细特征。
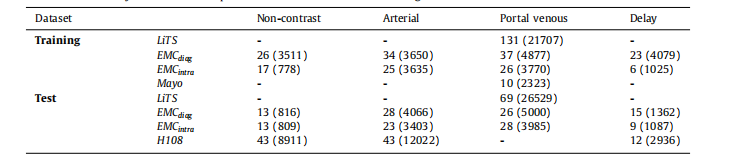
Table 2The number of CT images used for training CNN models for liver detection and testing/evaluation of the models and the proposedmethod in this study. The numbers in parentheses are the number of 2D images.
表2用于训练肝脏检测CNN模型以及本研究中模型测试/评估的CT图像数量。括号中的数字表示2D图像的数量。
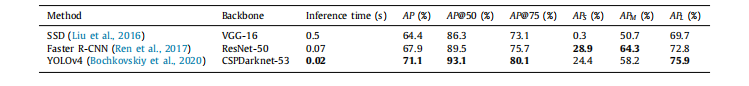
Table 3Comparison of the speed and accuracy of well-known 2D object detectors on the test dataset (LiTS and EMC datasets). The experiment was carriedout using GPU GTX 1080 Ti.
表3在测试数据集(LiTS和EMC数据集)上比较知名的2D物体检测器的速度和准确性。实验使用GPU GTX 1080 Ti进行。
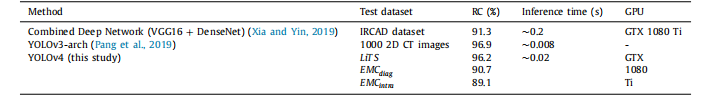
Table 4Comparison of the precision and inference time of the state-of-the-art 2D liver detection methods on CT images. The RC of YOLOv4 is computed withthe IoU at higher than 50% (Xia and Yin, 2019).
表4对CT图像上最先进的2D肝脏检测方法的精度和推断时间进行比较。YOLOv4的RC是在IoU大于50%条件下计算的(Xia和Yin,2019年)。
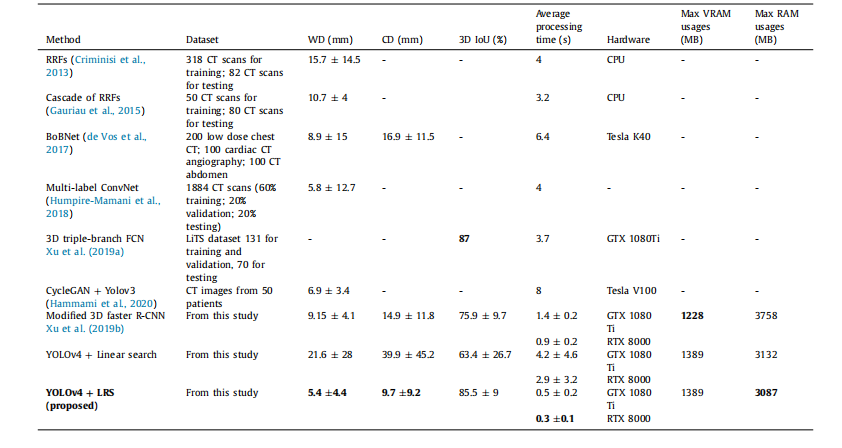
Table 5Comparison of the state-of-the art 3D bounding box liver localization on CT volume. The experiment is on LRS without adding MLU and MLL values. The upper part of thetable (above the thick line) is the list of the reported results from the original papers. The results in the lower part are experimentally carried out in this study using thetest dataset and the same hardware.
表5对CT体积上最先进的3D边界框肝脏定位方法进行比较。实验在LRS中未添加MLU和MLL*值。表的上半部分(粗线以上)是原始论文中报告的结果列表。下半部分的结果是使用相同硬件和测试数据集在本研究中实验得出的。
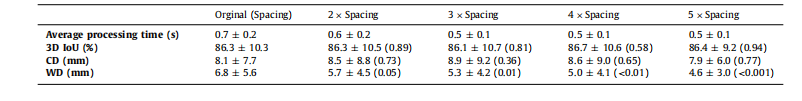
Table 6Evaluation on the performance of LRS on CT volume w.r.t. various slice spacings (without addding MLU and MLL). The numbers in the parentheses are the p-values(T-test) compared to the original detections. The experiment was carried out using GPU GTX 1080 Ti.
表6对不同切片间距条件下LRS在CT体积上性能的评估(未添加MLU和MLL)。括号中的数字是与原始检测相比的p值(T检验)。实验使用GPU GTX 1080 Ti进行。
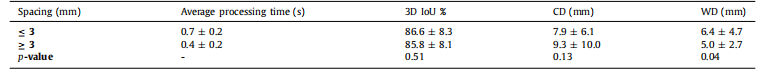
Table 7Analysis on the effect of different slice spacing on the accuracy of the 3D liver detection using LRS. The experiment was carried out using GPU GTX 1080 Ti.
表7对使用LRS进行3D肝脏检测精度影响的不同切片间距分析。实验使用GPU GTX 1080 Ti进行。
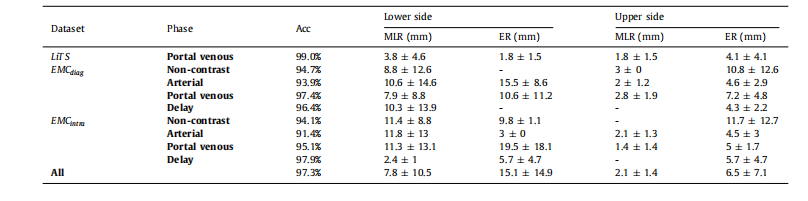
Table 8Qualitative evaluation results of LRS (without adding MLU and MLL values) for liver range detection on the LiT S and EMC datasets.
表8LRS在LiTS和EMC数据集上进行肝脏范围检测的定性评估结果(未添加MLU和MLL值)。
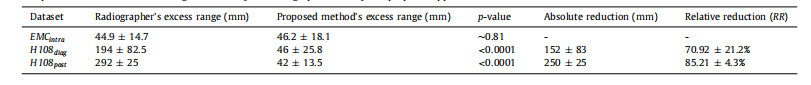
Table 9Comparison of the mean excess range obtained by the radiographers and by the proposed approach.
表9放射技师和提议方法获得的平均多余范围比较。