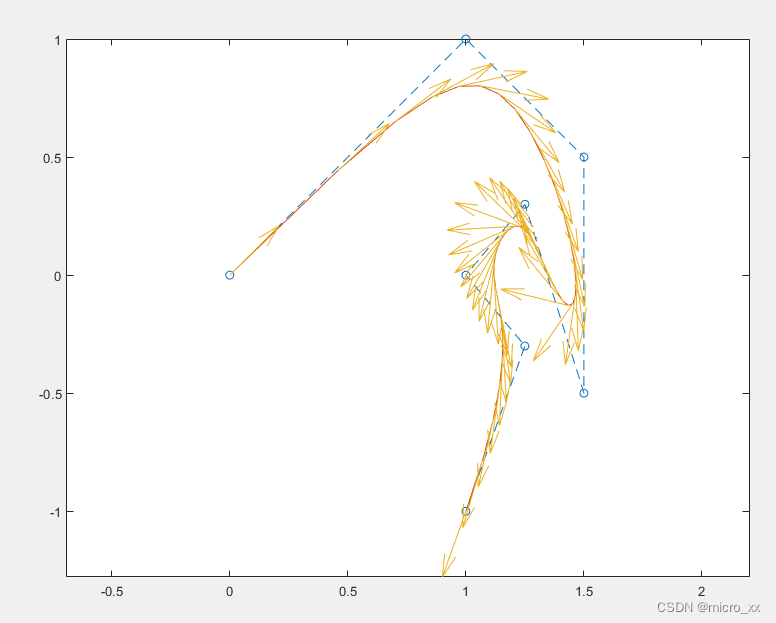
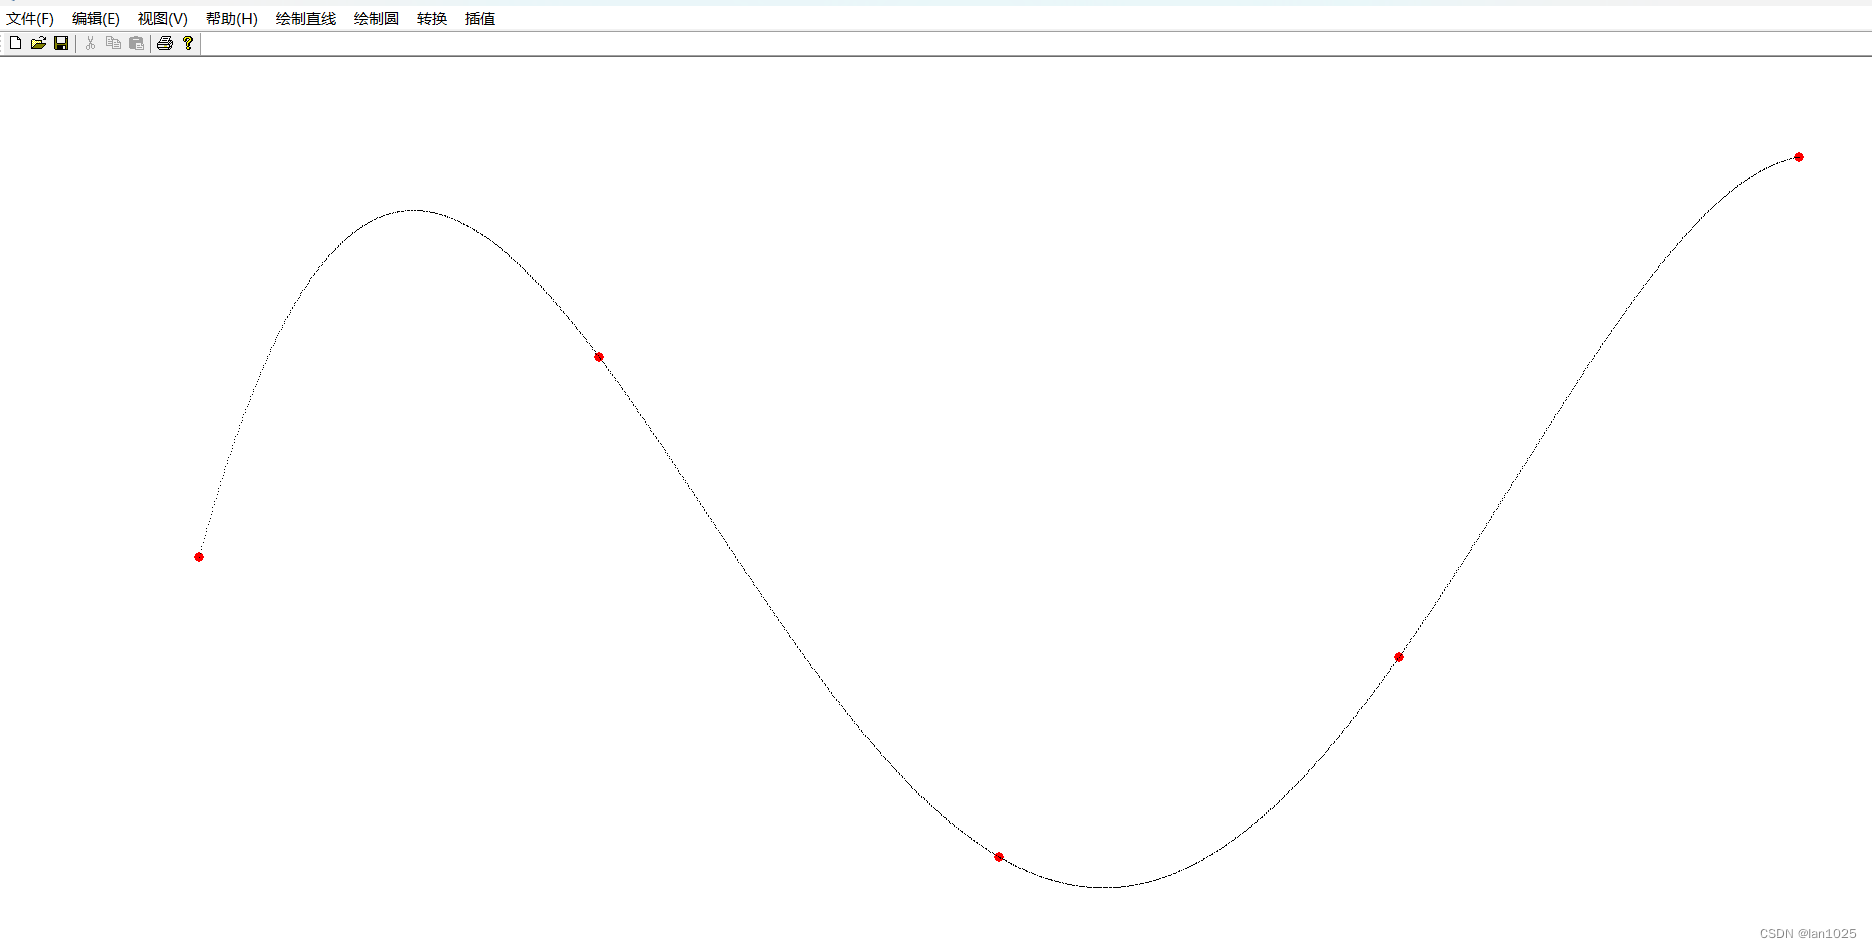
编写 test_x3_3x.py 如下
# -*- coding: utf-8 -*-
""" 绘制函数 y = x^3+3x+4 在 -3<=x<=3 的曲线 """
import numpy as np
from matplotlib import pyplot as plt

# 用于正常显示中文标题,负号
plt.rcParams['font.sans-serif'] = ['SimHei']
plt.rcParams['axes.unicode_minus'] = False

x = np.arange(-3., 3., 0.01)
y = np.power(x,3) -3.0*x +4

# 可视化
fig = plt.figure()
axes = fig.add_subplot(111)
axes.plot(x, y) # 画曲线
#axes.axis('scaled') # 用缩尺制图
axes.axis('equal')
plt.title('函数 y = x^3+3x+4 的曲线')
plt.xlabel('x')
plt.ylabel('f(x)')
plt.grid()
plt.show()
运行 python test_x3_3x.py

编写 test_x3_3x2_3x.py 如下
# -*- coding: utf-8 -*-
""" 绘制函数 y = x^3-3x^2+3x+1 在 -1<=x<=1 的曲线 """
import numpy as np
from matplotlib import pyplot as plt

# 用于正常显示中文标题,负号
plt.rcParams['font.sans-serif'] = ['SimHei']
plt.rcParams['axes.unicode_minus'] = False

x = np.arange(-1., 1., 0.01)
y = np.power(x,3) -3.0*np.power(x,2) +3.0*x +1

# 可视化
fig = plt.figure()
axes = fig.add_subplot(111)
axes.plot(x, y) # 画曲线
#axes.axis('scaled') # 用缩尺制图
axes.axis('equal')
plt.title('函数 y = x^3-3x^2+3x+1 的曲线')
plt.xlabel('x')
plt.ylabel('y')
plt.grid()
plt.show()
运行 python test_x3_3x2_3x.py


![[FPGA]-时序传输模型分析](https://i-blog.csdnimg.cn/direct/82ed5179fb7f42c8b355aeee79b96669.png#pic_center)


![厦门站 - [ACM独立出版] 2024年虚拟现实、图像和信号处理国际学术会议(ICVISP 2024)火热征稿中,诚邀参会!](https://img-blog.csdnimg.cn/img_convert/67b64be0ec3791a39b833c5bd583a1a4.png)


