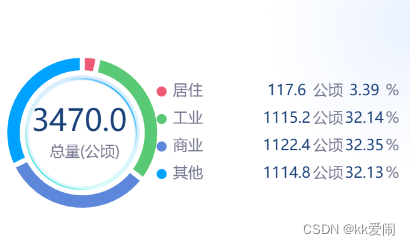
样式图

代码
export const hotOptions = {
animationEasingUpdate: "bounceIn",
top: "10%",
bottom: "10%",
series: [
{
type: "graph",
layout: "force",
force: {
repulsion: 0,
gravity: 0.1,
layoutAnimation: true,
edgeLength: [10, 50],
},
roam: true,
label: {
position: ["50%", "50%"],
normal: {
show: true,
textStyle: {
align: "center",
rich: {
a: {
fontWeight: 500,
fontSize: 17,
color: "#c9e0ff",
},
b: {
fontWeight: 400,
fontSize: 12,
lineHeight: 30,
color: "#99b4da",
},
},
},
formatter: function (value) {
const arr = ["{a|" + value.value + "}", "\n", "{b|" + value.name + "}"];
return arr.join("");
},
},
},
data: [],
},
],
};
<div
id="hotChart"
style="width: 100%; height: 95%"
></div>
import { hotOptions } from "./hotOption";
hotChart: null,
async initHotChart() {
this.hotChart = echarts.init(document.getElementById("hotChart"));
const option = deepCopy(hotOptions);
await 你的请求api().then((res) => {
if (res.success) {
const list = res.data;
const { bubbleData, repulsion } = this.bubbleData(list, ["name", "num"]);
option.series[0].data = bubbleData;
option.series[0].force.repulsion = repulsion;
}
});
},
bubbleData(data, format, dom) {
let [maxValue, temp] = [0, []];
data.forEach((item) => {
temp.push(item[format[1]]);
});
maxValue = Math.max.apply(null, temp);
let Symbol = ["blue", "purple", "green"];
let bakeSymbol = [...Symbol];
let bubbleData = [];
let basicSize = 100;
let repulsion = 380;
if (data.length >= 5 && data.length < 10) {
basicSize = 80;
repulsion = 280;
} else {
basicSize = 70;
repulsion = 230;
}
for (let item of data) {
if (!bakeSymbol.length) bakeSymbol = [...Symbol];
let SymbolSet = new Set(bakeSymbol);
let curIndex = Math.round(Math.random() * (SymbolSet.size - 1));
let curSymbol = bakeSymbol[curIndex];
SymbolSet.delete(curSymbol);
bakeSymbol = [...SymbolSet];
let size = (item[format[1]] * basicSize * 2) / maxValue;
if (size < basicSize) size = basicSize;
bubbleData.push({
name: item[format[0]],
value: item[format[1]],
symbolSize: size,
symbol: `image://图片地址/${curSymbol}.png`,
});
}
return { bubbleData, repulsion };
}


![代码随想录算法训练营第67天:图论5[1]](https://img-blog.csdnimg.cn/img_convert/f7d2141120bd185d26651e21d78589fd.png)