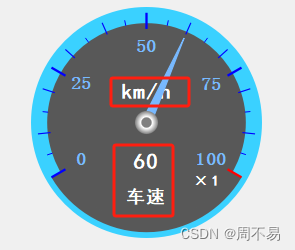
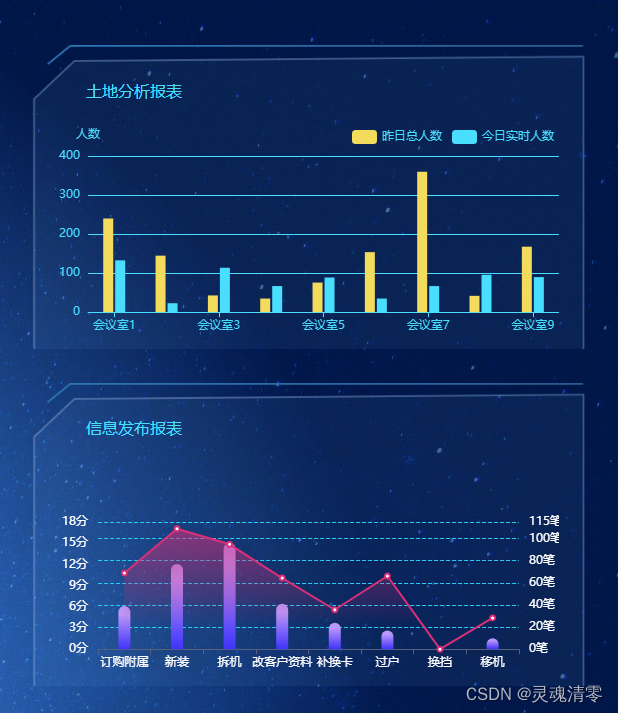
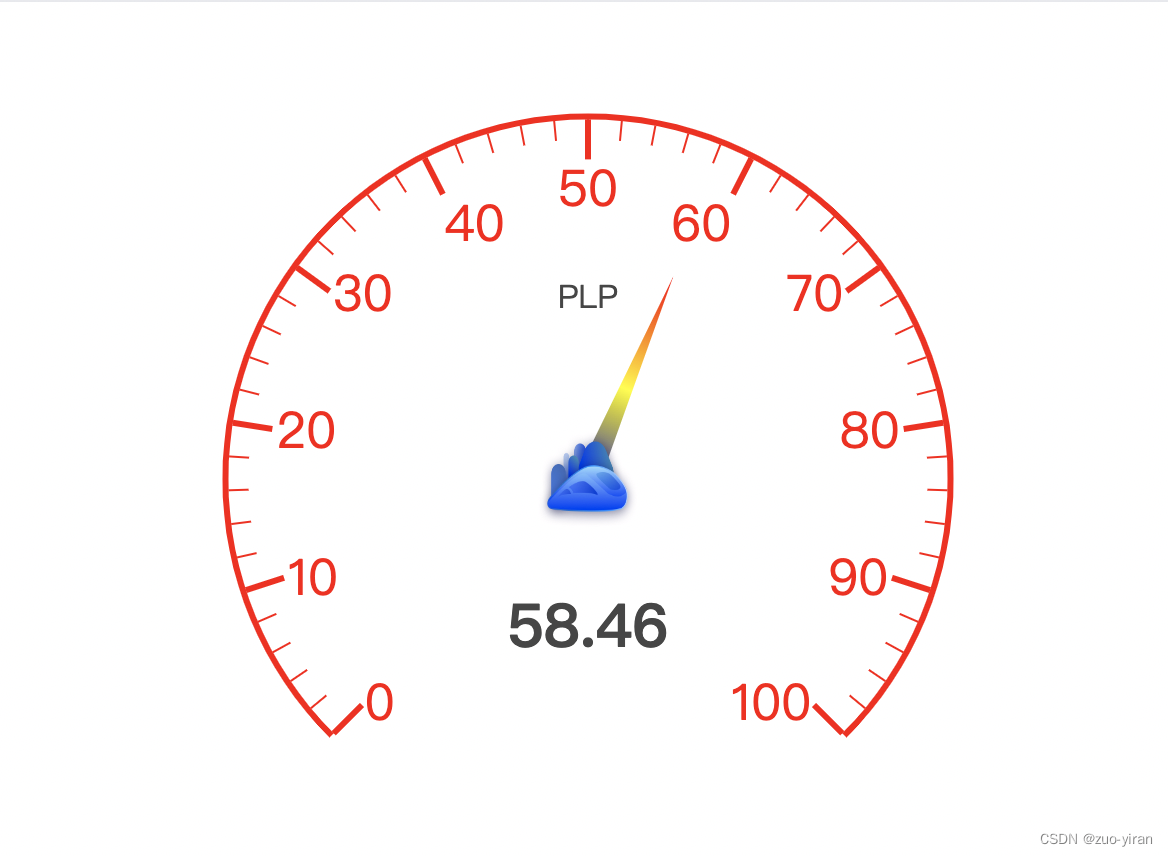
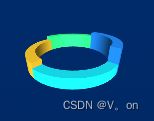
vue3+echart图表之仪表盘gauge

1.效果图

2.html

父组件

<div class="gauge">
                                <div>
                                    <gaugeOne>

                                    </gaugeOne>
                                </div>
                                <div>
                                    <gaugeTwo>

                                    </gaugeTwo>
                                </div>

                            </div>

import gaugeOne from '@/components/gaugeOne.vue' 
import gaugeTwo from '@/components/gaugeTwo.vue' 

子组件

gaugeOne子组件

<template>
    <!-- 为 ECharts 准备一个定义了宽高的 DOM -->
    <div id="main"
         style="width: 160px;height:160px;"></div>
</template>
<script setup>
     import * as echarts from 'echarts';
     import {reactive,onMounted,defineProps} from 'vue';
     import common from '../utils/common.js'
    //  const props = defineProps(['data'])
    //  var initData = props.data
    //  console.log(initData,'initData')
    let gaugeChar = reactive({})
    const initChart = () =>{
         var chartDom = document.getElementById('main');
         var myChart = echarts.init(chartDom);
         gaugeChar = myChart
         var option;
        
        option = {
            //graphic组件给echart中插入自定义的内容,图形,文字,图片
        graphic: {
            type: 'text',
            left: '25%',
            top: '80%',
            style: {
            text: '上月分类正确率',
            textAlign: 'center',
            fill: '#fff',
            fontSize: common.nowSize(12),
            },
        },
        series: [
        {
            type: 'gauge',
            // 控制表盘大小
            radius: "75%",
            //  仪表盘轴线相关配置 
            axisLine: {
                lineStyle: {
                width: 3,
                color: [
                    [0.3, '#67e0e3'],
                    [0.7, '#37a2da'],
                    [1, '#fd666d']
                ]
                }
            },
            //指针颜色自适应
            pointer: {
                itemStyle: {
                color: 'auto'
                }
            },
            //小刻度相关  
            axisTick: {
                show:false,
                length: 8,
                lineStyle: {
                color: '#fff',
                width: 2
                }
            },
            //分割线样式相关
            splitLine: {
                length: 5,
                distance: 0,
                lineStyle: {
                width: 2,
                color: '#999'
                }
            },
            // 大刻度相关      
            axisLabel: {
                distance: 10,
                fontSize: 10,
                color: 'inherit',
            },
            //仪表盘详情数据相关
            detail: {
                color: 'inherit',
                // 是否显示数据
                // show: false,
                // textStyle: {
                fontSize: 12,
                // 数据相对于仪表盘位置偏移
                offsetCenter: ['0%', '50%']
                // }
            },
            data: [
                {
                value: 90,
                }
            ]
          }   
        ]
};
option.series[0].data[0].value = 100
        option && myChart.setOption(option);
    }
        onMounted(()=>{
                initChart();
                 window.addEventListener('resize', function () {
         gaugeChar.resize()
    })
        }) 
</script> 
<style>
</style>

gaugeTwo子组件

<template>
    <!-- 为 ECharts 准备一个定义了宽高的 DOM -->
    <div id="main"
         style="width: 160px;height:160px;"></div>
</template>
<script setup>
     import * as echarts from 'echarts';
     import {reactive,onMounted,defineProps} from 'vue';
     import common from '../utils/common.js'
    //  const props = defineProps(['data'])
    //  var initData = props.data
    //  console.log(initData,'initData')
    let gaugeChar = reactive({})
    const initChart = () =>{
         var chartDom = document.getElementById('main');
         var myChart = echarts.init(chartDom);
         gaugeChar = myChart
         var option;
        
        option = {
            //graphic组件给echart中插入自定义的内容,图形,文字,图片
        graphic: {
            type: 'text',
            left: '25%',
            top: '80%',
            style: {
            text: '上月分类正确率',
            textAlign: 'center',
            fill: '#fff',
            fontSize: common.nowSize(12),
            },
        },
        series: [
        {
            type: 'gauge',
            // 控制表盘大小
            radius: "75%",
            //  仪表盘轴线相关配置 
            axisLine: {
                lineStyle: {
                width: 3,
                color: [
                    [0.3, '#67e0e3'],
                    [0.7, '#37a2da'],
                    [1, '#fd666d']
                ]
                }
            },
            //指针颜色自适应
            pointer: {
                itemStyle: {
                color: 'auto'
                }
            },
            //小刻度相关  
            axisTick: {
                show:false,
                length: 8,
                lineStyle: {
                color: '#fff',
                width: 2
                }
            },
            //分割线样式相关
            splitLine: {
                length: 5,
                distance: 0,
                lineStyle: {
                width: 2,
                color: '#999'
                }
            },
            // 大刻度相关      
            axisLabel: {
                distance: 10,
                fontSize: 10,
                color: 'inherit',
            },
            //仪表盘详情数据相关
            detail: {
                color: 'inherit',
                // 是否显示数据
                // show: false,
                // textStyle: {
                fontSize: 12,
                // 数据相对于仪表盘位置偏移
                offsetCenter: ['0%', '50%']
                // }
            },
            data: [
                {
                value: 90,
                }
            ]
          }   
        ]
};
option.series[0].data[0].value = 100
        option && myChart.setOption(option);
    }
        onMounted(()=>{
                initChart();
                 window.addEventListener('resize', function () {
         gaugeChar.resize()
    })
        }) 
</script> 
<style>
</style>

相关推荐

  1. 基于 Vue 3 封装一个 ECharts 图表组件

    2023-12-23 10:14:05       7 阅读

最近更新

  1. TCP协议是安全的吗?

    2023-12-23 10:14:05       18 阅读
  2. 阿里云服务器执行yum,一直下载docker-ce-stable失败

    2023-12-23 10:14:05       19 阅读
  3. 【Python教程】压缩PDF文件大小

    2023-12-23 10:14:05       18 阅读
  4. 通过文章id递归查询所有评论(xml)

    2023-12-23 10:14:05       20 阅读

热门阅读

  1. 做接口测试时需要验证数据库么?

    2023-12-23 10:14:05       38 阅读
  2. Linux中硬盘(IDE、SCSI)的命名规则

    2023-12-23 10:14:05       41 阅读
  3. ceph集群搭建详细教程(ceph-deploy)

    2023-12-23 10:14:05       36 阅读
  4. MAC 安装nginx

    2023-12-23 10:14:05       35 阅读
  5. cmake常用函数

    2023-12-23 10:14:05       31 阅读
  6. log4j日志切割原理

    2023-12-23 10:14:05       36 阅读