使用Python绘制堆积面积图
- 堆积面积图
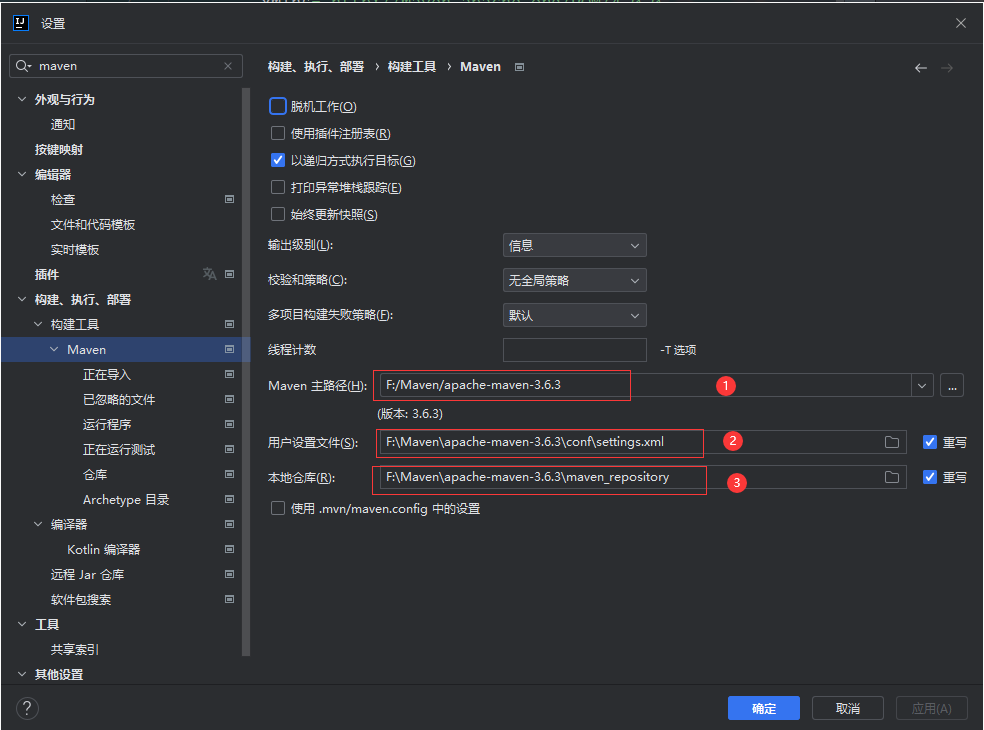
- 效果
- 代码
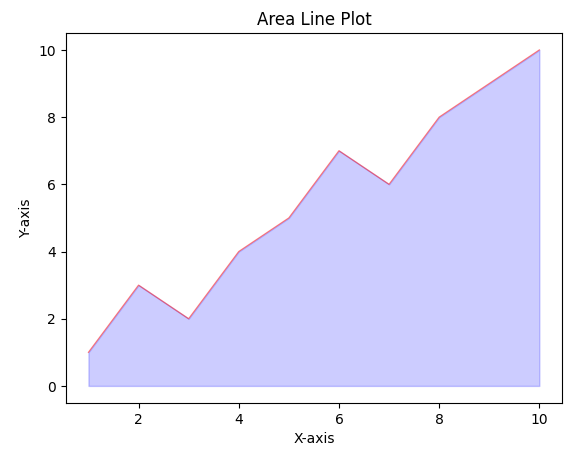
堆积面积图
堆积面积图是面积图的一种扩展,通过堆积多个区域展示不同类别数据的累积变化。常用于显示不同部分对整体的贡献。
效果
[外链图片转存失败,源站可能有防盗链机制,建议将图片保存下来直接上传(img-pQbW4Fbd-1720675937351)(https://i-blog.csdnimg.cn/direct/4b22181bcb334d079a40dac13fb55b1f.png)]
代码
import matplotlib.pyplot as plt
from pylab import *
mpl.rcParams['font.sans-serif']=['SimHei']
# 示例数据
years = [2015, 2016, 2017, 2018, 2019]
category1 = [10, 15, 20, 25, 30]
category2 = [5, 10, 15, 20, 25]

# 绘制堆积面积图
plt.fill_between(years, category1, color="skyblue", alpha=0.4)
plt.fill_between(years, [i+j for i, j in zip(category1, category2)], category1, color="lightgreen", alpha=0.4)

# 设置标签和标题
plt.xlabel('Year')
plt.ylabel('Value')
plt.title('堆积面积图')

plt.show()