一、代码
import matplotlib.pyplot as plt
import numpy as np
# 数据设定
N = 10
menMeans = (20, 35,20, 35,20, 35,20, 35,20, 35)
womenMeans = (25, 32,25, 32,25, 32,25, 32,25, 32)
# 绘制堆积柱状图
ind = np.arange(N)
width = 0.35
#创建图形和子图
fig, ax = plt.subplots()
p1 = ax.bar(ind, menMeans, width)
p2 = ax.bar(ind, womenMeans, width, bottom=menMeans)
ax.axhline(0, color='grey', linewidth=0.8)
ax.set_ylabel('数量',fontproperties=zhfont)
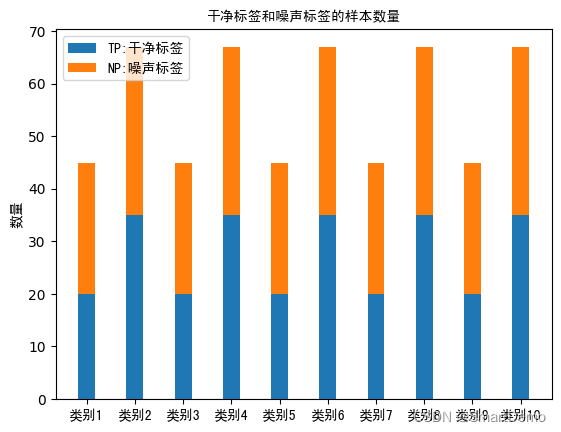
ax.set_title('干净标签和噪声标签的样本数量',fontproperties=zhfont)
ax.set_xticks(ind)
ax.set_xticklabels(('类别1', '类别2','类别3','类别4','类别5','类别6','类别7','类别8','类别9','类别10'),fontproperties=zhfont)
ax.legend((p1[0], p2[0]), ('TP:干净标签', 'NP:噪声标签'),prop=zhfont)
# 显示图形
plt.show()二、结果


![【Web】记录[长城杯 2022 高校组]b4bycoffee题目复现](https://img-blog.csdnimg.cn/direct/3bf42e271d21439fb192500224975bdc.png)