使用 NearestNeighbors 进行点云分析
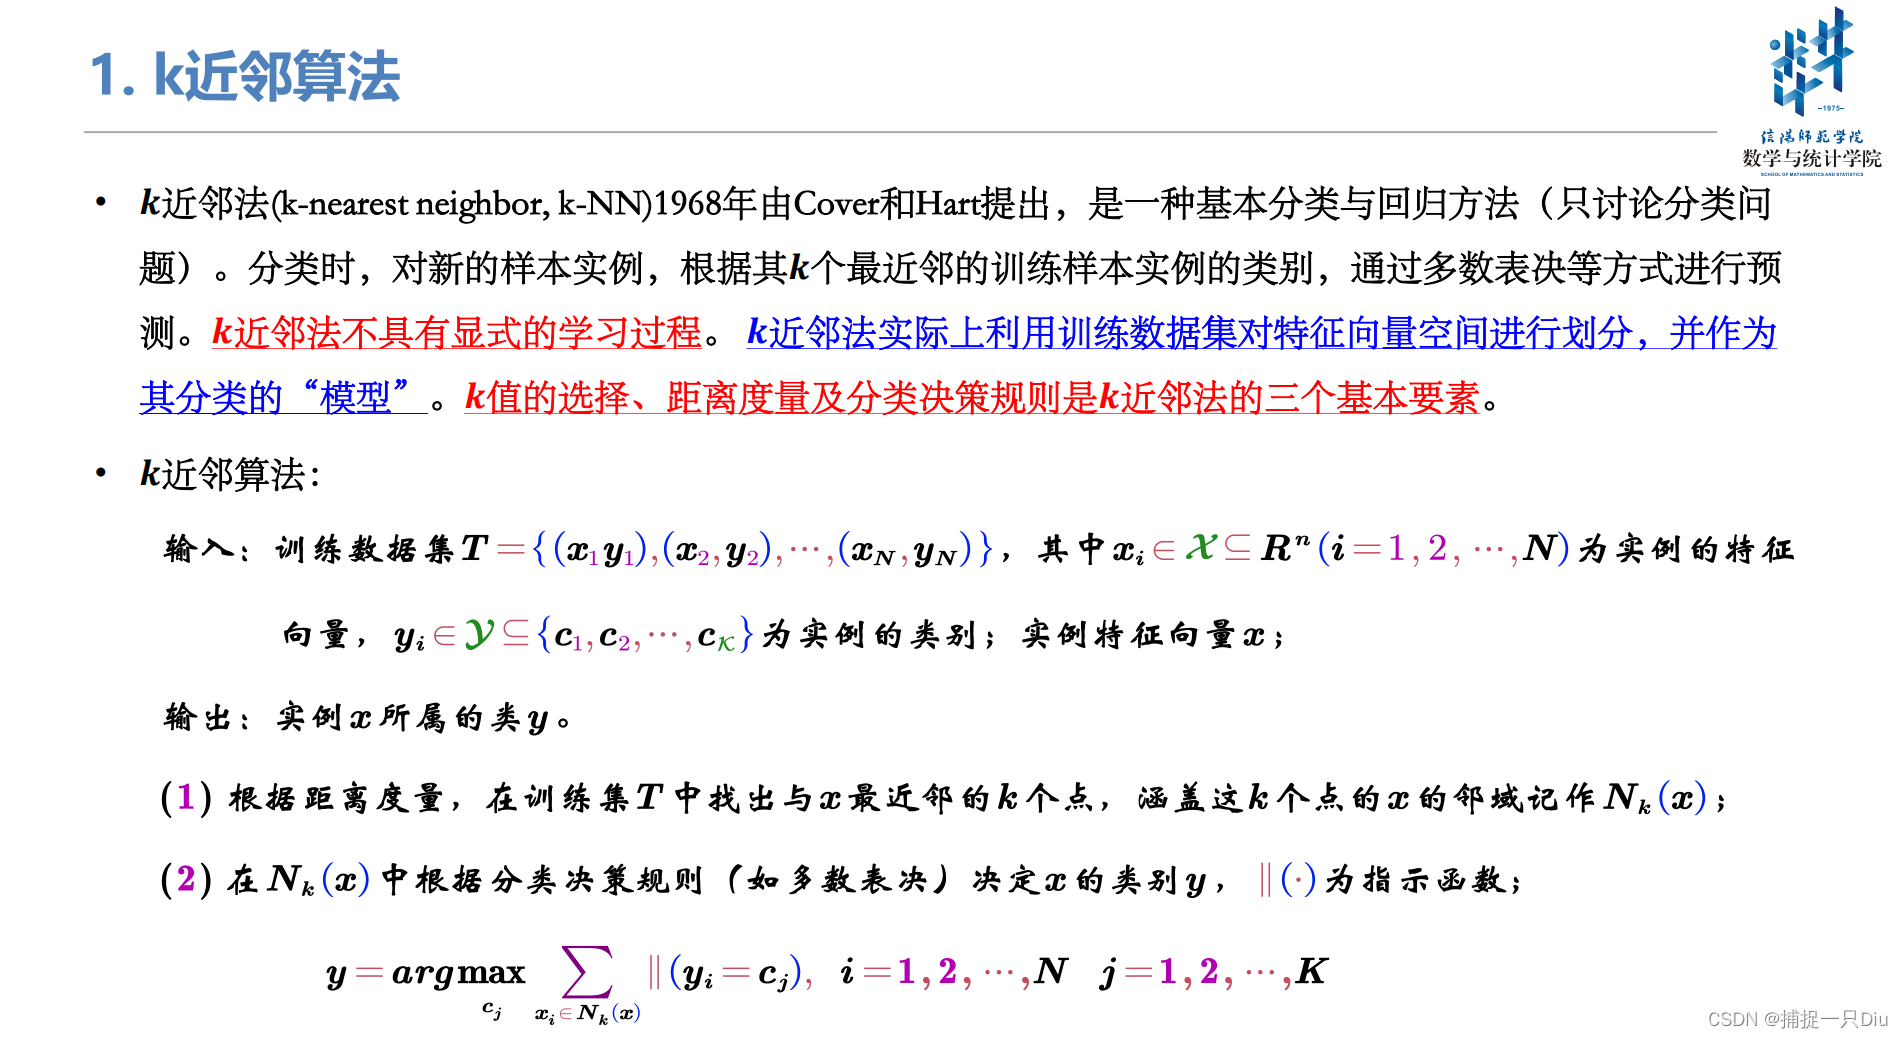
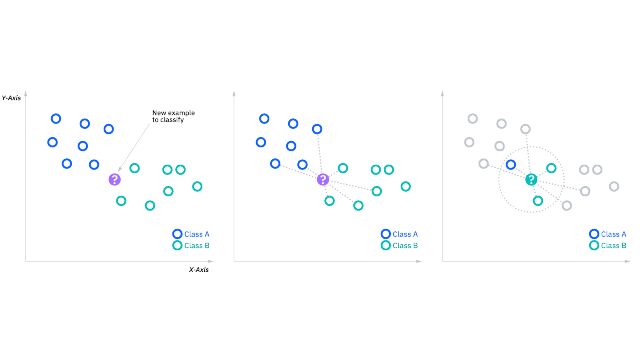
在数据分析和机器学习领域,最近邻算法(Nearest Neighbors)是一种常用的非参数方法。它广泛应用于分类、回归和聚类分析等任务。下面将介绍如何使用 scikit-learn 库中的 NearestNeighbors 类来进行点云数据的处理,并通过 Open3D 库进行可视化展示。

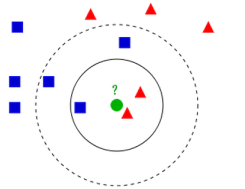
最近邻算法简介
最近邻算法是一种基于距离的算法,它通过计算数据点之间的距离来查找给定数据点的最近邻居。常用的距离度量包括欧氏距离、曼哈顿距离和余弦相似度等。最近邻算法的优点在于简单易懂且无需假设数据的分布形式,适用于各种类型的数据。
代码示例
使用 NearestNeighbors 查找点云数据的最近邻,并使用 Open3D 进行可视化。

步骤一:导入必要的库
import open3d as o3d
import numpy as np
from sklearn.neighbors import NearestNeighbors
import time
步骤二:定义函数来创建点与点之间的连接线
def create_lines_from_points(points, k_neighbors=6, color=[0, 1, 0]):
    if len(points) < 2:
        return None

    start_time = time.time()
    neighbors = NearestNeighbors(n_neighbors=k_neighbors)
    neighbors.fit(points)
    distances, indices = neighbors.kneighbors(points)
    end_time = time.time()
    print(f"Nearest neighbors computation time: {end_time - start_time:.4f} seconds")

    start_time = time.time()
    lines = []
    for i in range(len(points)):
        for j in indices[i]:
            if i < j:  # 避免重复的线
                lines.append([i, j])
    end_time = time.time()
    print(f"Line creation time: {end_time - start_time:.4f} seconds")

    colors = [color for i in range(len(lines))]

    line_set = o3d.geometry.LineSet()
    line_set.points = o3d.utility.Vector3dVector(points)
    line_set.lines = o3d.utility.Vector2iVector(lines)
    line_set.colors = o3d.utility.Vector3dVector(colors)
    return line_set
步骤三:加载点云数据
使用点云数据文件 .pcd 的内容。
pcd_file = """\
VERSION 0.7
FIELDS x y z
SIZE 4 4 4
TYPE F F F
COUNT 1 1 1
WIDTH 28
HEIGHT 1
VIEWPOINT 0 0 0 1 0 0 0
POINTS 28
DATA ascii
0.301945 -0.1810271 1.407832
0.3025161 -0.1733161 1.322455
0.3003909 -0.167791 1.717239
0.2926154 -0.1333728 1.246899
0.2981626 -0.1311488 1.376031
0.300947 -0.1268353 1.719725
0.2944916 -0.1170874 1.545582
0.3008177 -0.09701672 1.395218
0.2989618 -0.08497152 1.699149
0.3039065 -0.07092351 1.32867
0.3031552 -0.05290076 1.509094
0.2906472 0.02252534 1.617192
0.2972519 0.02116165 1.457043
0.3024158 0.02067187 1.402361
0.2987708 0.01975626 1.286629
0.3014581 0.06462696 1.304869
0.289153 0.1107126 1.859879
0.2879259 0.1625713 1.583842
0.2952633 0.1989845 1.431798
0.3078183 -0.1622952 1.816048
0.3001072 -0.147239 1.970708
0.2990342 -0.1194922 1.950798
0.2979593 -0.09225944 1.931052
0.2929263 0.02492997 1.965327
0.3061717 0.1117098 1.621875
0.3004842 0.03407142 1.999085
0.3023082 -0.1527775 1.553968
0.3008434 0.250506 1.55337
"""

# 解析点云数据
lines = pcd_file.strip().split("\n")
points = []
for line in lines[11:]:
    points.append([float(value) for value in line.split()])
points = np.array(points)
步骤四:创建连接线并进行可视化
# 创建连接线并进行可视化
line_set = create_lines_from_points(points, k_neighbors=6, color=[0, 1, 0])
o3d.visualization.draw_geometries([line_set])
结论
以上展示了如何使用 scikit-learn 中的 NearestNeighbors 类来计算点云数据的最近邻,并使用 Open3D 库将结果进行可视化。这种方法可以用于点云数据的分析、物体检测以及3D建模等多个领域。
完整代码
import open3d as o3d
import numpy as np
from sklearn.neighbors import NearestNeighbors
import time

def create_lines_from_points(points, k_neighbors=6, color=[0, 1, 0]):
    if len(points) < 2:
        return None

    start_time = time.time()
    neighbors = NearestNeighbors(n_neighbors=k_neighbors)
    neighbors.fit(points)
    distances, indices = neighbors.kneighbors(points)
    end_time = time.time()
    print(f"Nearest neighbors computation time: {end_time - start_time:.4f} seconds")

    start_time = time.time()
    lines = []
    for i in range(len(points)):
        for j in indices[i]:
            if i < j:  # avoid duplicate lines
                lines.append([i, j])
    end_time = time.time()
    print(f"Line creation time: {end_time - start_time:.4f} seconds")

    colors = [color for i in range(len(lines))]

    line_set = o3d.geometry.LineSet()
    line_set.points = o3d.utility.Vector3dVector(points)
    line_set.lines = o3d.utility.Vector2iVector(lines)
    line_set.colors = o3d.utility.Vector3dVector(colors)
    return line_set

# Load point cloud data from a .pcd file
pcd_file = """\
VERSION 0.7
FIELDS x y z
SIZE 4 4 4
TYPE F F F
COUNT 1 1 1
WIDTH 28
HEIGHT 1
VIEWPOINT 0 0 0 1 0 0 0
POINTS 28
DATA ascii
0.301945 -0.1810271 1.407832
0.3025161 -0.1733161 1.322455
0.3003909 -0.167791 1.717239
0.2926154 -0.1333728 1.246899
0.2981626 -0.1311488 1.376031
0.300947 -0.1268353 1.719725
0.2944916 -0.1170874 1.545582
0.3008177 -0.09701672 1.395218
0.2989618 -0.08497152 1.699149
0.3039065 -0.07092351 1.32867
0.3031552 -0.05290076 1.509094
0.2906472 0.02252534 1.617192
0.2972519 0.02116165 1.457043
0.3024158 0.02067187 1.402361
0.2987708 0.01975626 1.286629
0.3014581 0.06462696 1.304869
0.289153 0.1107126 1.859879
0.2879259 0.1625713 1.583842
0.2952633 0.1989845 1.431798
0.3078183 -0.1622952 1.816048
0.3001072 -0.147239 1.970708
0.2990342 -0.1194922 1.950798
0.2979593 -0.09225944 1.931052
0.2929263 0.02492997 1.965327
0.3061717 0.1117098 1.621875
0.3004842 0.03407142 1.999085
0.3023082 -0.1527775 1.553968
0.3008434 0.250506 1.55337
"""

# Parse the point cloud data
lines = pcd_file.strip().split("\n")
points = []
for line in lines[11:]:
    points.append([float(value) for value in line.split()])
points = np.array(points)

# Create lines from points and visualize
line_set = create_lines_from_points(points, k_neighbors=6, color=[0, 1, 0])
o3d.visualization.draw_geometries([line_set])


![[ACM独立出版]2024年虚拟现实、图像和信号处理国际学术会议(ICVISP 2024)](https://img-blog.csdnimg.cn/img_convert/67b64be0ec3791a39b833c5bd583a1a4.png)