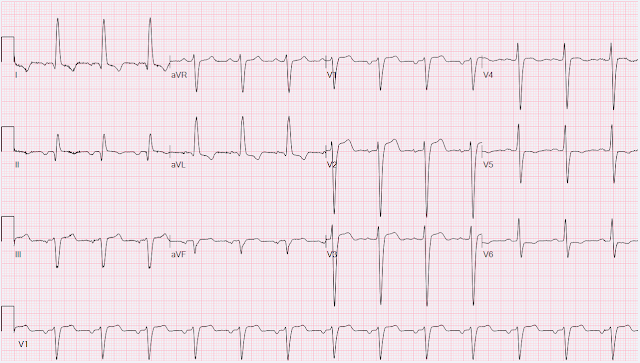
心血管疾病是一种常见病,严重影响人们的健康及日常生活。 近年来随着人们生活习惯的不断变化,心血管疾病对人们影响愈加明显,发病率呈现出逐年攀升的趋势,心血管疾病是中国城乡居民死亡的首要原因。心电图ECG已被广泛用于研究心跳活动。作为一种无创的方法,ECG的相关研究为了解心脏的功能提供了便利。对心电图进行有效分析可以为心血管疾病的诊断和防治提供丰富的信息,进而大大减缓心血管疾病对人们生活的影响。
心电信号分割是心电图解读的第一步,通过心电信号分割,有助于进一步对运动员心脏健康状况进行分析,进而减少运动员受伤、致病及运动中猝死的风险。
from typing import Union,List, Tuple# get signal with wfdb library# using an indexdef get_signal(index:int, as_p_signal:bool=True) -> Union[wfdb.Record, np.ndarray]:record = wfdb.rdrecord(DATA_FOLDER + "/" + str(index))assert type(record) is wfdb.Recordif as_p_signal:assert type(record.p_signal) is np.ndarrayreturn record.p_signalreturn record# get annotations given the ecg leaddef get_annotations(index:int, lead, as_sample=True) -> Union[wfdb.Annotation, np.ndarray]:annotations = wfdb.rdann(DATA_FOLDER +"/" + str(index), extension = lead)if as_sample:return np.array(annotations.sample)return annotations# get a full EGC with 12 leadsdef get_full_ecg(index:int):signal = get_signal(index)annotations = [get_annotations(index, lead) for lead in LEADS]return signal, annotationsdef get_single_lead_ecg(index, lead) -> Tuple[np.ndarray, np.ndarray]:"""return and ecg signal and its annotationsboth as ndarray"""signal = get_signal(index)assert type(signal) is np.ndarraysignal = signal[:, LEADS.index(lead)]samples = get_annotations(index, lead)assert type(samples) is np.ndarrayreturn signal, samplesdef get_annotations_symbols(index, lead):ann = get_annotations(index, lead, as_sample=False)return ann.symboldef paired_annotation_sample_and_symbol(index, lead):annotations_symbols = get_annotations_symbols(index, lead)annotations_sample = get_annotations(index, lead)return zip(annotations_sample, annotations_symbols)def get_single_lead_ecg_with_symbols(index, lead):"""return and ecg signal and its annotationsboth as ndarray"""signal = get_signal(index)assert type(signal) is np.ndarraysignal = signal[:, LEADS.index(lead)]data = paired_annotation_sample_and_symbol(index, lead)return signal, np.array(list(data))# plot single lead ecg with annotationsdef plot_single_lead_ecg(index, lead):signal, samples = get_single_lead_ecg(index, lead)fig, ax = plt.subplots(figsize = (28, 3))ax.plot(signal)ax.scatter(samples, signal[samples], c = 'r', marker = 'o')# now plot every lead with annotationsdef plot_signal_with_annotation(index):signal, samples = get_full_ecg(index)# extract sample from annotationswfdb.plot_items(signal, samples )
plot_signal_with_annotation(index = 199)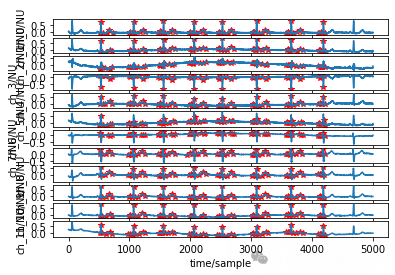
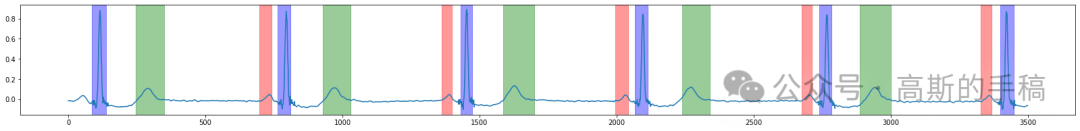
class EGCSignal:"""This class has 4 main purposes:1. To store the signal and its annotations2. To cut the signal once at the beginning and once at the end3. To plot the ECG in different ways4. To convert the annotation in a one hot encodingNote that doesn't store the entire ECG, but only one leadAlso has a method to initialize the class without explicitly passing the signal and annotationsbut with the index and lead of the record"""def __init__(self, signal, time_points, symbol, categories = None):self.signal:np.ndarray = signalself.time_points:np.ndarray = time_pointsself.symbols:list[str] = symbolself.symbol_to_category = {'N': 0,'t': 1,'p': 2}self.category_to_symbol = {0: 'N',1: 't',2: 'p'}self.categories = categories if categories is not None else self.symbols_to_category()self._cut_beginning( 550)self._cut_end( 3500)def __getitem__(self, key):return self.signal[key]def __len__(self):return len(self.signal)def _cut_beginning(self, start_point):self.signal = self.signal[start_point:]self.categories = self.categories[start_point:]# now have to check if time_points and symbols are also to cutif start_point > self.time_points[0]:# get the index of the first time point greater than start_pointindex = np.argmax(self.time_points > start_point)self.time_points = self.time_points[index:]self.symbols = self.symbols[index:]self.time_points = self.time_points - start_point# check the cut pointif self.categories[0] != -1:# if the first symbol is a ')' then i have to prepend a '(' and a letter from self.category_to_symbolif self.symbols[0] == ')':self.symbols = ['('] + [self.category_to_symbol[self.categories[0]]] + self.symbolsself.time_points = np.concatenate(([0,1], self.time_points))elif self.symbols[0] in self.symbol_to_category:# just prepend '('self.symbols = ['('] + self.symbolsself.time_points = np.concatenate(([0], self.time_points))def _cut_end(self, end_point):self.signal = self.signal[:end_point]self.categories = self.categories[:end_point]index = self.time_points[self.time_points < self.signal.size].sizeself.time_points = self.time_points[:index]self.symbols = self.symbols[:index]# check the cut pointif self.categories[-1] != -1:# if the last symbol is a '(' then i have to append a ')' and a letter from self.category_to_symbolif self.symbols[-1] == '(':self.symbols = self.symbols + [self.category_to_symbol[self.categories[-1]]] + [')']self.time_points = np.concatenate((self.time_points, [self.signal.size - 1, self.signal.size ]))elif self.symbols[-1] in self.symbol_to_category:# just append ')'self.symbols = self.symbols + [')']self.time_points = np.concatenate((self.time_points, [self.signal.size]))def plot(self, ax=None):if ax is None:fig, ax = plt.subplots(figsize = (28, 3))ax.plot(self.signal)def plot_with_time_point(self):fig, ax = plt.subplots(figsize = (28, 3))self.plot(ax)ax.scatter(self.time_points, self.signal[self.time_points], c = 'r', marker = 'o')def plot_with_segments(self):fig, ax = plt.subplots(figsize = (28, 3))self.plot(ax)for start, symbol, end in grouped(self.time_points, 3):i = np.nonzero(self.time_points == symbol)[0][0]current_symbol = self.symbols[i]color = SEGMENT_TO_COLOR[current_symbol]ax.axvspan(start, end, color=color, alpha=0.4)def symbols_to_category(self):"""converts the symbols list in a numpy array of integerssame length as the signal"""# first instantiate an array of -1 same length as the signalcategory = np.full(len(self.signal), -1)# now fill the array with the known categoryfor section in grouped(self.time_points):# unpack the sectionstart, peak, end = section# get the category given the peaki = np.nonzero(self.time_points == peak)[0][0]current_symbol = self.symbols[i]category[start:end] = self.symbol_to_category[current_symbol]return category@staticmethoddef from_index_and_lead(index, lead):return EGCSignal(get_signal(index)[:, LEADS.index(lead)],get_annotations(index, lead),get_annotations_symbols(index, lead) )EGCSignal.from_index_and_lead(1, LEADS[0]).plot_with_segments()
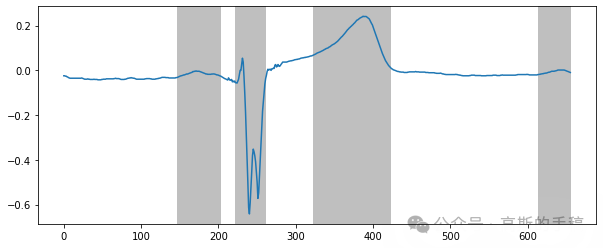
# plot categories on ecgsignal = X_test[ecg_index]categories = np.argmax(Y_test[ecg_index], axis=1)predicted_categories = np.argmax(Y_test_pred[ecg_index], axis=1)# get time point where category changestime_points = np.where(categories[:-1] != categories[1:])[0]# chek if category was at beginning or endif categories[0] != 0:# if category was at beginning, add first time pointtime_points = np.append(0, time_points)if categories[-1] != 0:# if category was at end, add last time pointtime_points = np.append(time_points, len(categories))# plot the signalplt.figure(figsize=(10, 4))plt.plot(signal)for b,e in grouped(time_points, 2):plt.axvspan(b, e, facecolor='0.5', alpha=0.5)
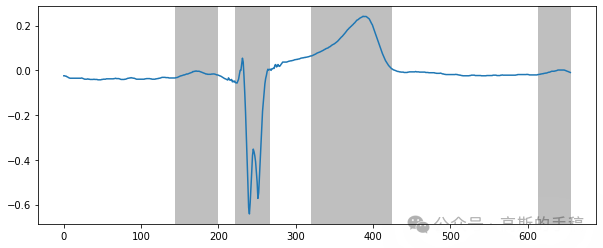
signal = X_test[ecg_index]categories = np.argmax(Y_test[ecg_index], axis=1)predicted_categories = np.argmax(Y_test_pred[ecg_index], axis=1)# get time point where category changestime_points = np.where(predicted_categories[:-1] != predicted_categories[1:])[0]# chek if category was at beginning or endif predicted_categories[0] != 0:# if category was at beginning, add first time pointtime_points = np.append(0, time_points)if predicted_categories[-1] != 0:# if category was at end, add last time pointtime_points = np.append(time_points, len(predicted_categories))# plot the signalplt.figure(figsize=(10, 4))plt.plot(signal)for b,e in grouped(time_points, 2):plt.axvspan(b, e, facecolor='0.5', alpha=0.5)
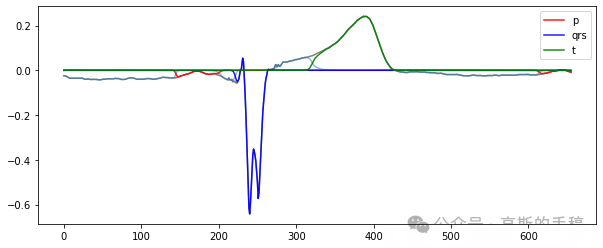
plt.figure(figsize=(10, 4))plt.plot(signal, color = "gray")plt.plot(pred[:,0]*signal, alpha=0.5) # predicted not interestingplt.plot(pred[:,3]*signal, alpha=0.9, label= "p", c=SEGMENT_TO_COLOR['p']) # predicted pplt.plot(pred[:,1]*signal, alpha=0.9, label= "qrs", c=SEGMENT_TO_COLOR['N']) # predicted qrsplt.plot(pred[:,2]*signal, alpha=0.9, label= "t", c=SEGMENT_TO_COLOR['t']) # predicted tplt.legend(loc='upper right',ncol=1,)
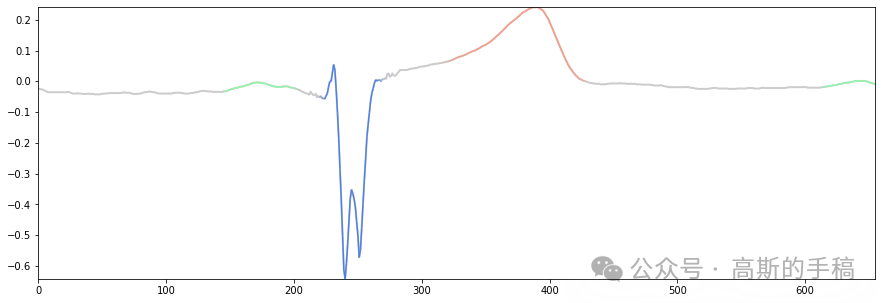
from matplotlib.collections import LineCollectionfrom matplotlib.colors import ListedColormapx = np.arange(len(signal))t = np.linspace(0,1,x.shape[0]) # your "time" variablelightblue = [(0.3, 0.5, 0.9, 0.99 * p) for p in pred[:,1]]lightred = [(0.99, 0.6, 0.5, 0.99 * p) for p in pred[:,2]]lightgreen = [(0.55, 0.99, 0.66, 0.99 * p) for p in pred[:,3]]# set up a list of (x,y) pointspoints = np.array([x,signal]).transpose().reshape(-1,1,2)segs = np.concatenate([points[:-1],points[1:]],axis=1)# make the collection of segmentslcblue = LineCollection(segs, cmap=ListedColormap( lightblue))lcblue.set_array(t)lcred = LineCollection(segs, cmap=ListedColormap( lightred))lcred.set_array(t)lcgreen = LineCollection(segs, cmap=ListedColormap( lightgreen))lcgreen.set_array(t)# plot the collectionplt.figure(figsize=(15, 5))plt.plot(signal, alpha = 0.4, linewidth = 2, color='gray')plt.gca().add_collection(lcblue) # add the collection to the plotplt.gca().add_collection(lcred) # add the collection to the plotplt.gca().add_collection(lcgreen) # add the collection to the plotplt.xlim(x.min(), x.max()) # line collections don't auto-scale the plotplt.ylim(signal.min(), signal.max())
工学博士,担任《Mechanical System and Signal Processing》《中国电机工程学报》《控制与决策》等期刊审稿专家,擅长领域:现代信号处理,机器学习,深度学习,数字孪生,时间序列分析,设备缺陷检测、设备异常检测、设备智能故障诊断与健康管理PHM等。