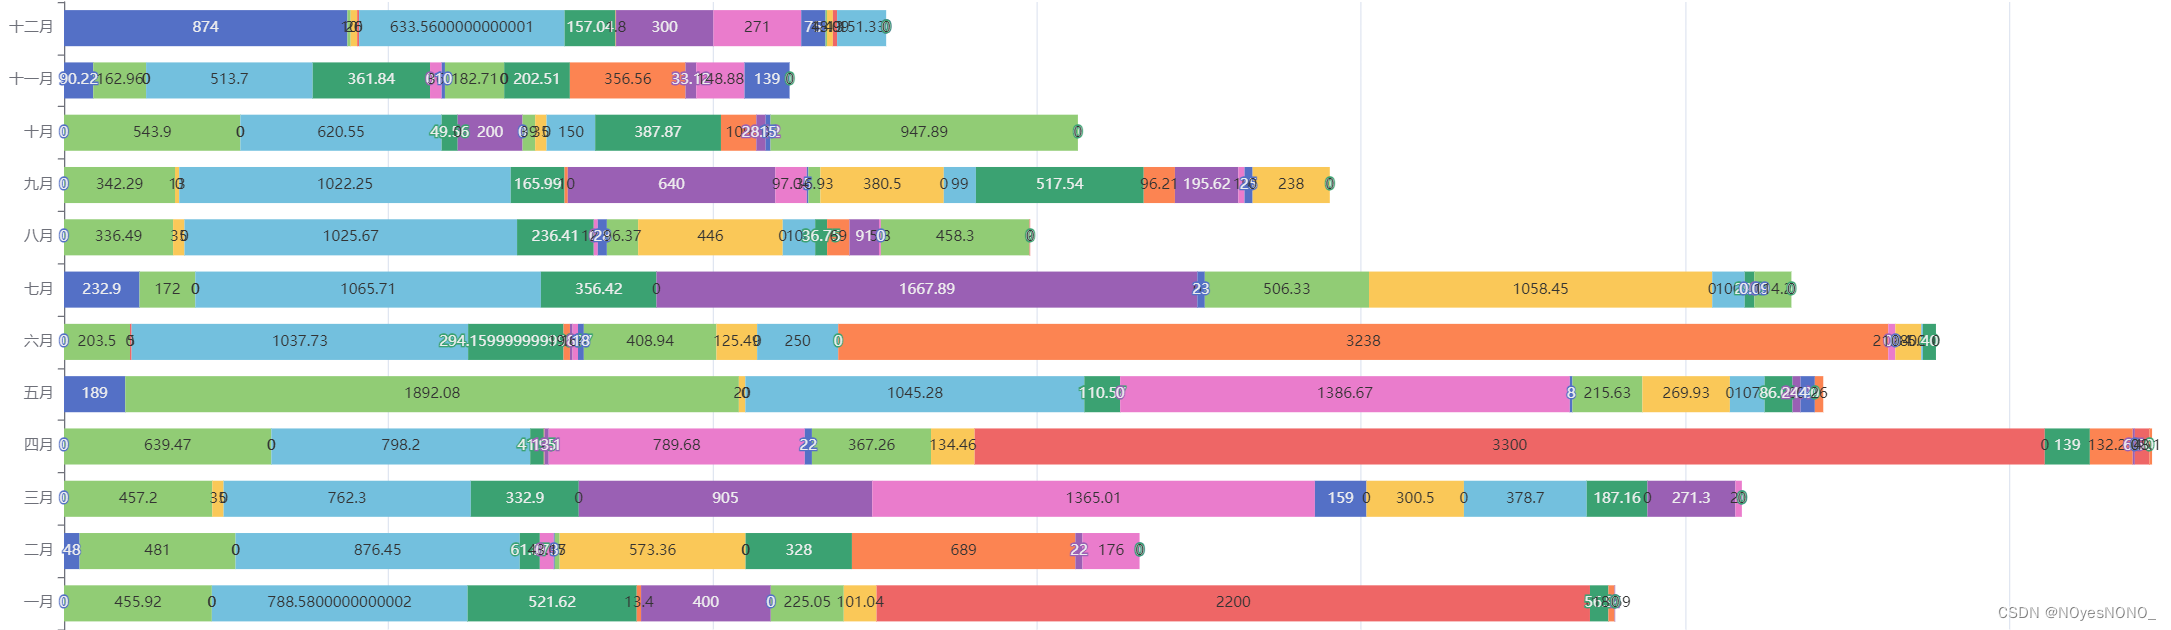
效果图
初始化注意
setOption的函数定义,option是指图表的配置项和数据,notMerge是指是否不跟之前设置的 option 进行合并。默认为 false。即表示合并。如果为 true,表示所有组件都会被删除,然后根据新option 创建所有新组件
//  setOption(option, notMerge, lazyUpdate)
myChart.value.setOption(option.value, true);
代码
const myChart = ref(null);
// 指定图表的配置项和数据
let option = ref({
	color: ["rgba(252, 219, 110, 1)"],
	tooltip: {
		trigger: "axis",
		backgroundColor: "rgba(88, 104, 121, 1)", // 提示框浮层的背景颜色。
		borderColor: "rgba(88, 104, 121, 1)", // 提示框浮层的边框颜色。
		borderWidth: 1, // 提示框浮层的边框宽。
		padding: 6, // 提示框浮层内边距,
		textStyle: {
			// 提示框浮层的文本样式。
			color: "#fff",
			fontStyle: "normal",
			fontWeight: "normal",
			fontFamily: "sans-serif",
			fontSize: 14
		},
		axisPointer: {
			type: "cross",
			animation: false,
			label: {
				backgroundColor: "rgba(60, 72, 85, 0.7)"
			}
		}
	},
	grid: {
		left: "2%",
		right: "4%",
		bottom: "10%",
		top: "20%",
		containLabel: true
	},
	legend: {
		con: "circle",
		itemWidth: 5,
		itemHeight: 5,
		orient: "horizontal",
		top: "5%",
		right: "auto",
		textStyle: { color: "#fff", fontSize: 14 }
	},
	xAxis: {
		type: "category",
		data: [],
		axisLine: {
			show: false
		},
		axisLabel: {
			fontSize: 12,
			color: "#9E9E9E"
		},
		axisTick: {
			show: false
		}
	},
	yAxis: [
		{
			type: "value",
			min: 0,
			minInterval: 1,
			splitArea: {
				show: false
			},
			axisLine: {
				show: false
			},
			axisTick: {
				show: false
			},
			splitLine: {
				lineStyle: {
					color: "#676767",
					type: "dashed" // dotted 虚线
				}
			},
			axisLabel: {
				fontSize: 12,
				color: "#9E9E9E",
				fontFamily: "Bebas"
			}
		},
		{
			type: "value",
			axisLine: {
				show: false
			},
			axisTick: {
				show: false
			},
			splitLine: {
				show: false
			},
			axisLabel: {
				fontSize: 12,
				formatter: "{value}%", // 右侧Y轴文字显示
				fontFamily: "Bebas",
				color: "#6A93B9"
			},
			splitArea: {
				show: false
			}
		}
	],
	series: [
		{
			type: "bar",
			barWidth: 8,
			itemStyle: { barBorderRadius: [8, 8, 8, 8] },
			data: []
		}
	]
});
// 获取对应的x轴 y轴的值
const getBarData = async () => {
   //  发送接口
	let res = await workNumApi({ code: activeIndex.value });
	console.log(res, "柱状图数据");

	option.value.xAxis.data = res.data.xAxis;
	option.value.series[0].data = res.data.yAxis;
	// 因为会进行切换  所以要判断是不是初始进来
	if (myChart.value) {
		myChart.value.setOption(option.value, true);
	}
};
const init = () => {
	myChart.value = echarts.init(numberOfFlights.value);
	// 使用刚指定的配置项和数据显示图表。
	myChart.value.setOption(option.value, true);
};