目录
8,UMAP/tSNE降维(保存pbmc_tutorial.rds)
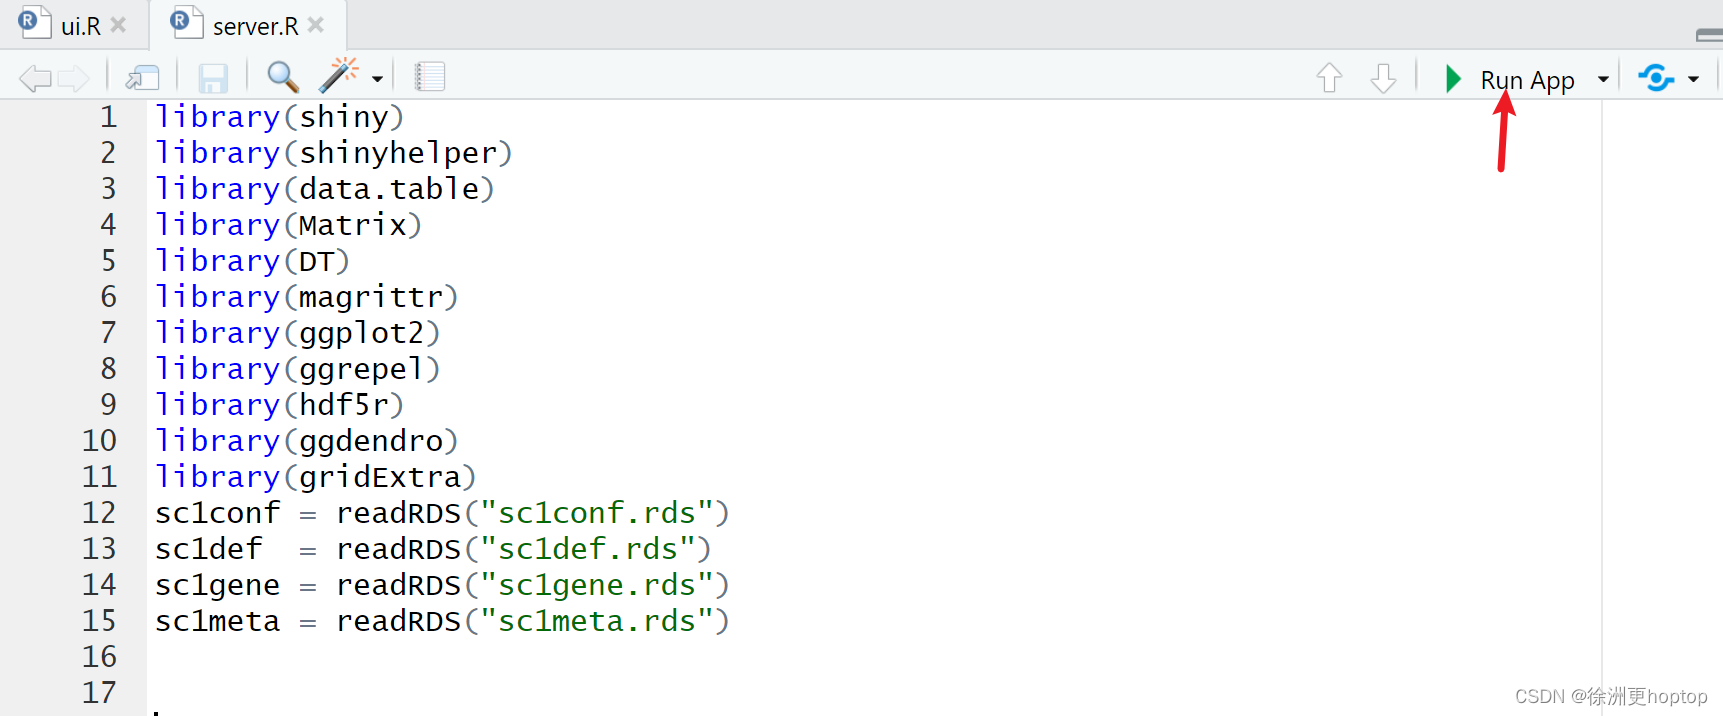
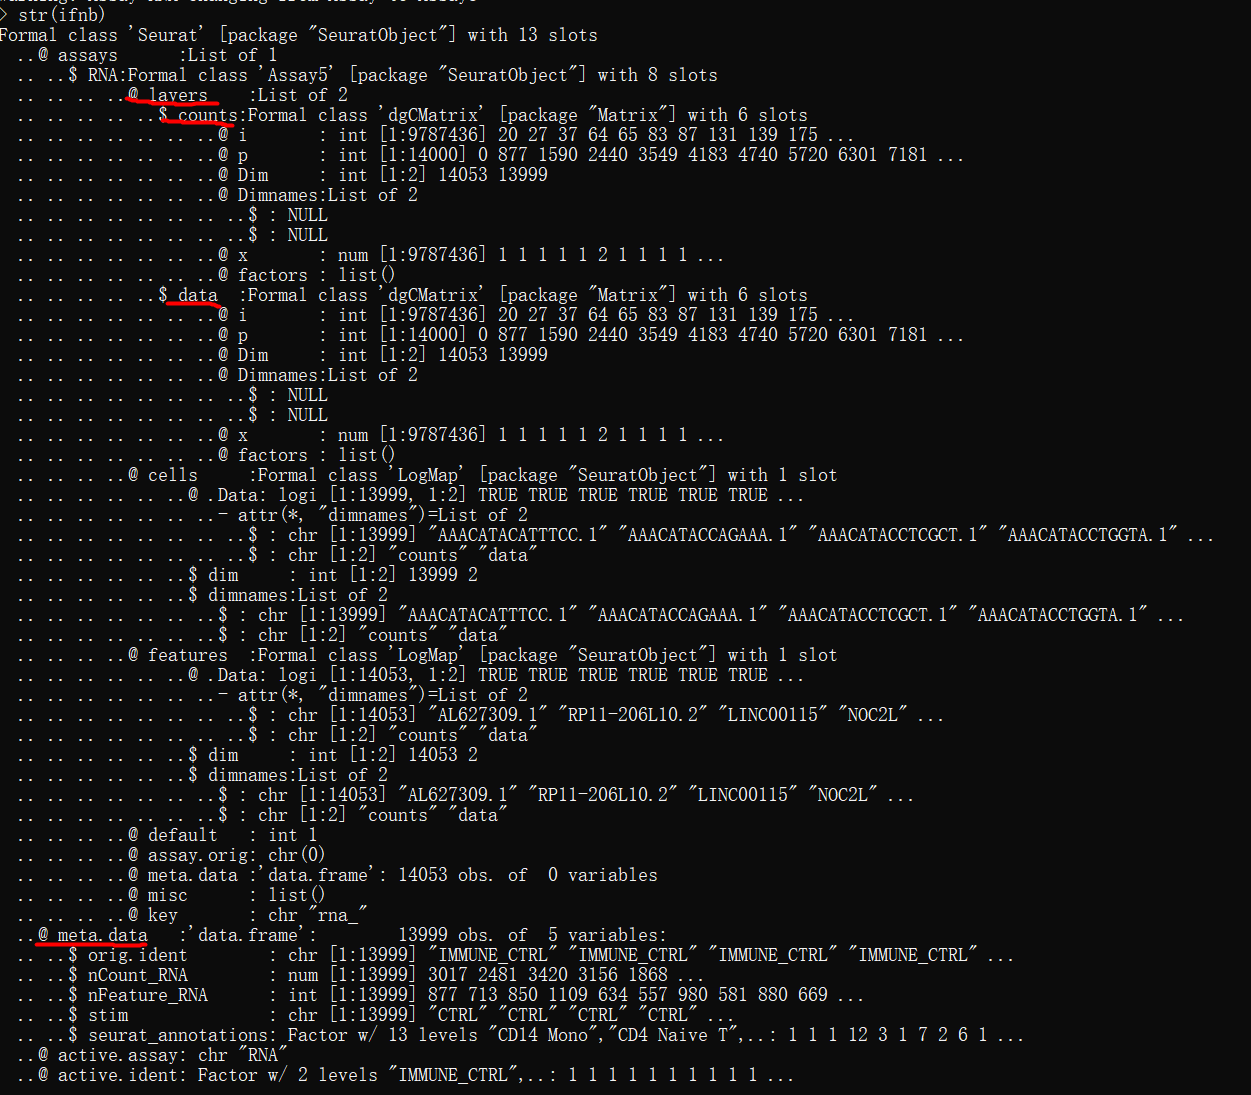
1,数据读取
rm(list = ls())
library(dplyr)
library(Seurat)
library(patchwork)
# Load the PBMC dataset :注意需要将文件解压后才能读取处理
#解压后包括三个文件barcodes.tsv;genes.tsv ;matrix.mtx
pbmc.data <- Read10X(data.dir = "D:/2024年5月30日pbmc流程/pbmc3k_filtered_gene_bc_matrices")
# #用原始数据(非规范化数据)初始化Seurat对象
pbmc <- CreateSeuratObject(counts = pbmc.data,
                           project = "pbmc3k",
                           min.cells = 3, # min.cell:每个feature至少在多少个细胞中表达(feature=gene)
                           min.features = 200) # min.features:每个细胞中至少有多少个feature被检测到
pbmc
2,线粒体基因查看
# The [[ operator can add columns to object metadata. This is a great place to stash QC stats
pbmc[["percent.mt"]] <- PercentageFeatureSet(pbmc, pattern = "^MT-")#计算线粒体比例
#We filter cells that have unique feature counts over 2,500 or less than 200
#We filter cells that have >5% mitochondrial counts
VlnPlot(pbmc, features = c("nFeature_RNA", "nCount_RNA", "percent.mt"), ncol = 3)
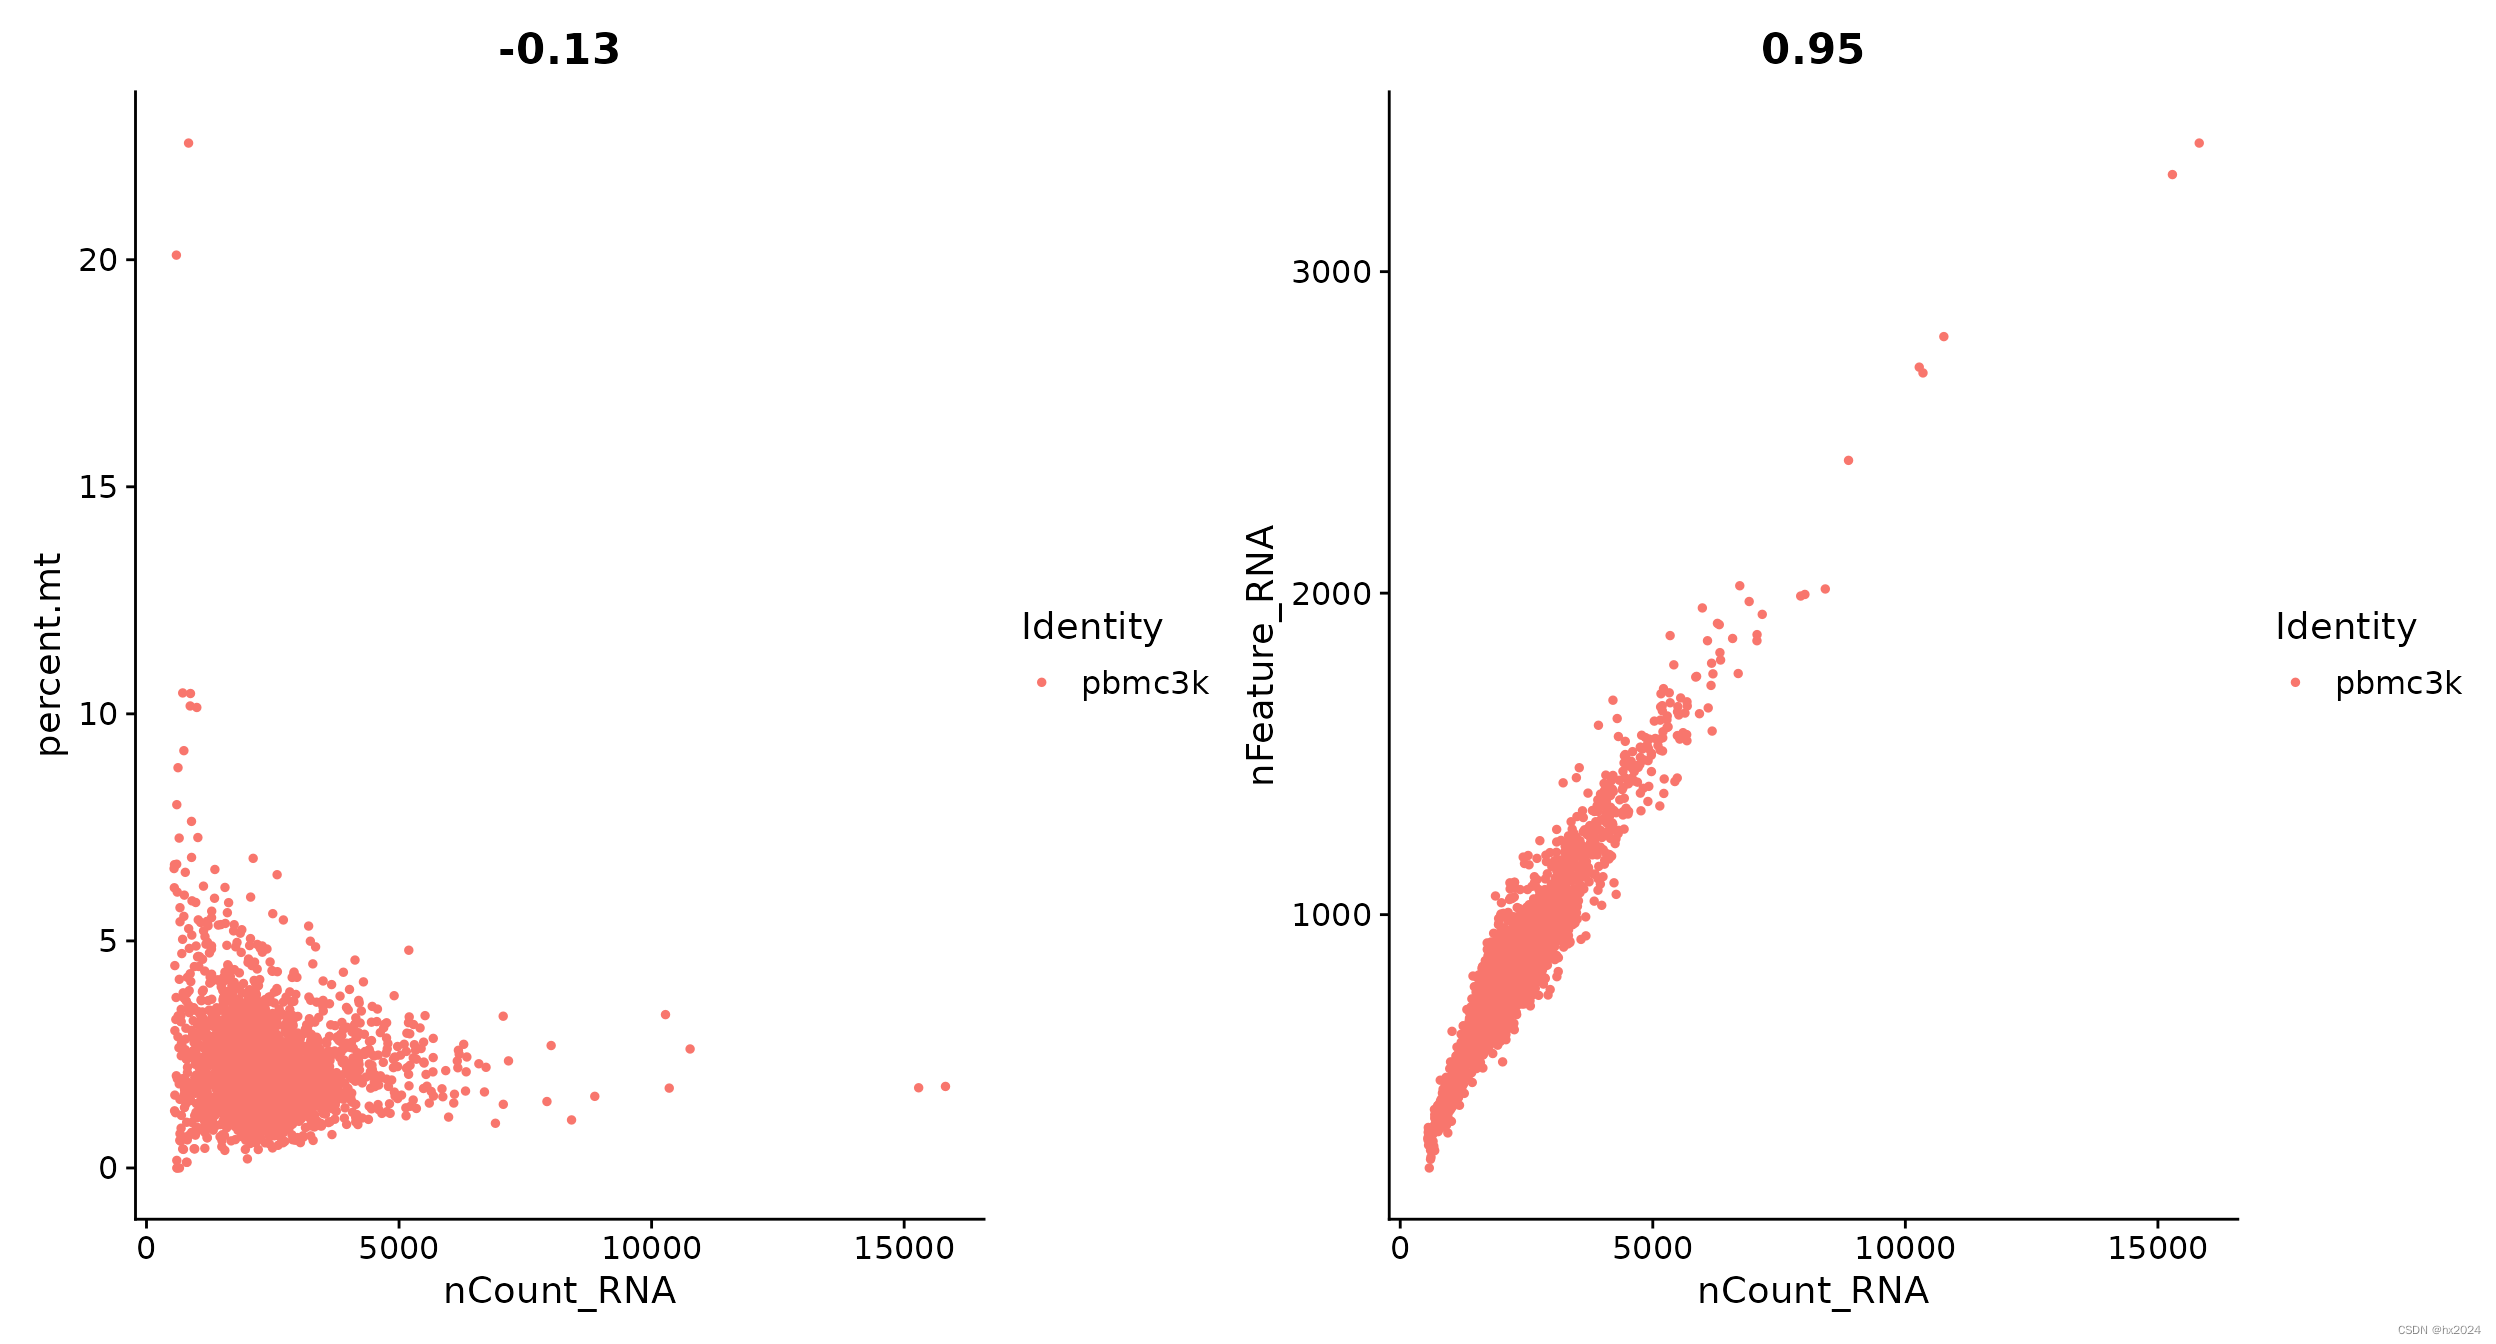
#功能散点图通常用于可视化功能之间的关系
#用于对象计算的任何内容,即对象元数据中的列、PC分数等
plot1 <- FeatureScatter(pbmc, feature1 = "nCount_RNA", feature2 = "percent.mt")
plot2 <- FeatureScatter(pbmc, feature1 = "nCount_RNA", feature2 = "nFeature_RNA")
plot1 + plot2
过滤
#过滤
pbmc <- subset(pbmc, subset = nFeature_RNA > 200 & nFeature_RNA < 2500 & percent.mt < 5)
pbmc
3,数据标准化
#数据标准化:
pbmc <- NormalizeData(pbmc, normalization.method = "LogNormalize", scale.factor = 10000)
#pbmc <- NormalizeData(pbmc)#可以使用替代
4,识别高变基因
#识别高变基因
pbmc <- FindVariableFeatures(pbmc, selection.method = "vst", nfeatures = 2000)#返回2000个高变基因
# Identify the 10 most highly variable genes
top10 <- head(VariableFeatures(pbmc), 10)
top10
# plot variable features with and without labels
plot1 <- VariableFeaturePlot(pbmc)
#plot2 <- LabelPoints(plot = plot1, points = top10, repel = TRUE)
#这里关于绘制散点图注释关于重叠的参数设置可以为0
plot2 <- LabelPoints(plot = plot1, points = top10, repel = 0)
plot1 + plot2

5,进行数据归一化
all.genes <- rownames(pbmc)
pbmc <- ScaleData(pbmc, features = all.genes)
注意:设置参数features是因为ScaleData默认处理前面鉴定的差异基因。这一步怎么做都不会影响到后续pca和聚类,但是会影响做热图。Scale并不会影响降维的结构,也就是说不影响数据的分布。
6,进行线性降维
#进行线性降维
pbmc <- RunPCA(pbmc, features = VariableFeatures(object = pbmc))
#检查及可视化PCA结果
print(pbmc[["pca"]], dims = 1:5, nfeatures = 5)
VizDimLoadings(pbmc, dims = 1:2, reduction = "pca")
DimPlot(pbmc, reduction = "pca") + NoLegend()
DimHeatmap(pbmc, dims = 1, cells = 500, balanced = TRUE)

7,确定细胞簇
#确定单细胞降维维度(簇数)
ElbowPlot(pbmc)#用肘线图确定曲线折线处

pbmc <- FindNeighbors(pbmc, dims = 1:10)
pbmc <- FindClusters(pbmc, resolution = 0.5)
## 查看前5分析细胞聚类数ID
head(Idents(pbmc), 5)
## 查看每个类别多少个细胞
table(pbmc@meta.data$seurat_clusters)#每个类别细胞越来越少
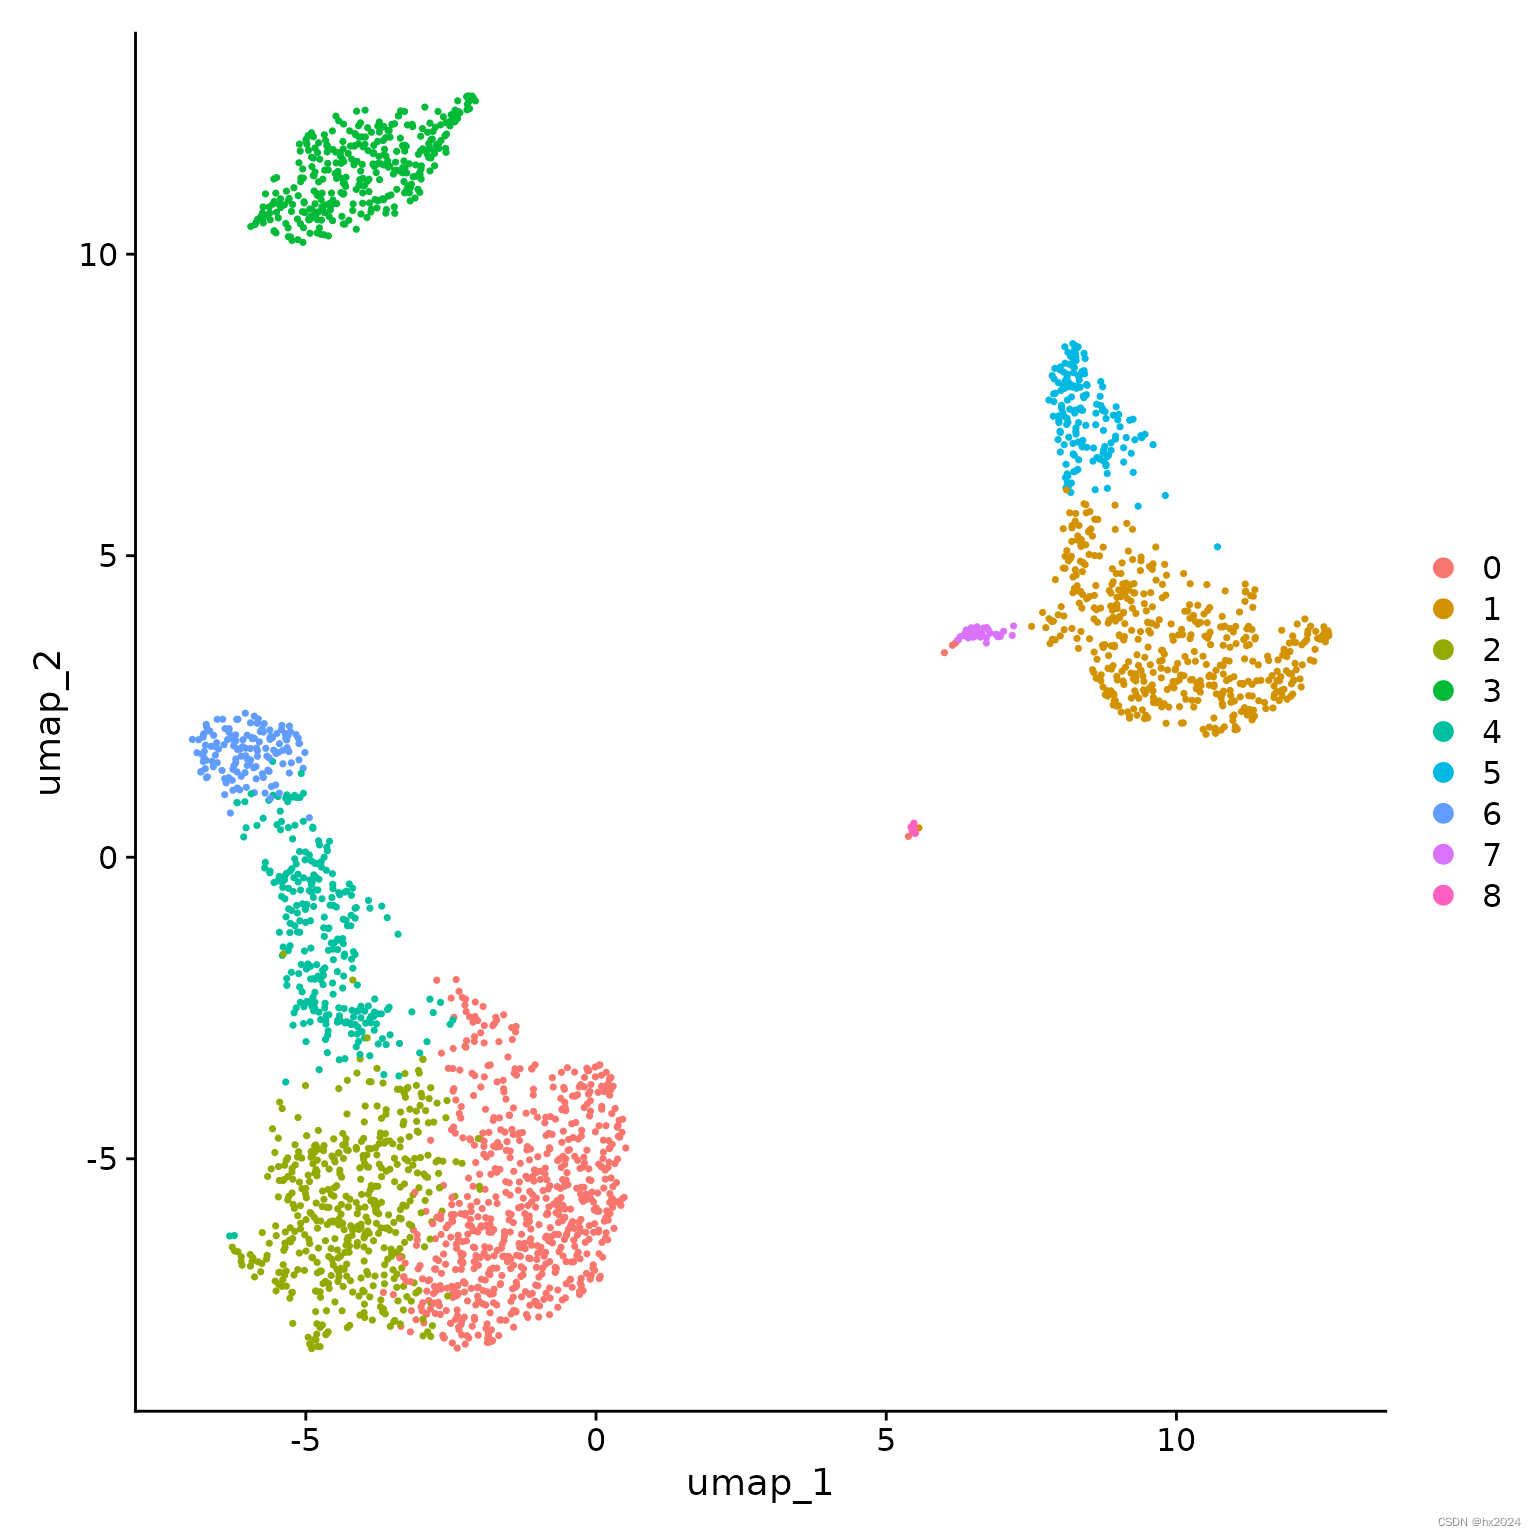
8,UMAP/tSNE降维(保存pbmc_tutorial.rds)
pbmc <- RunUMAP(pbmc, dims = 1:10)
DimPlot(pbmc, reduction = "umap")
#保存过滤及质控降维后的数据集(这里可以不用添加保存路径)
saveRDS(pbmc, file = "pbmc_tutorial.rds")#https://www.jianshu.com/p/aca662db800e
补充:降维复现镜像
为什么你画的Seurat包PCA图与别人的方向不一致?-腾讯云开发者社区-腾讯云 (tencent.com)
使用随机的是这个函数,随机参数为maxit
maxit:maximum number of iterations
但是发现这个函数最后使用的C/C++代码…
除了RunPCA函数之外,Seurat包中使用了随机种子的还有RunTSNE函数,默认为seed.use = 1,RunUMAP,默认为seed.use = 42,这两个函数再使用RunUMAP时回遇到画出来的图不一致,RunTSNE倒是没有遇见过很明显不一样的时候。
总结
挖到最后,发现还是有点说不通,没给找到一个合理的解释。
总之,如果你发现自己在使用Seurat包重复某一文章或者别人的教程还是官网的示例时,发现自己画出来的图与原有的方向呈镜像或者上下颠倒,可以试着改一下这个随机种子。
9,分析差异基因
rm(list = ls())
library(dplyr)
library(Seurat)
library(patchwork)
pbmc <- readRDS("pbmc_tutorial.rds")
#DimPlot(pbmc, reduction = "umap")##降维可视化优点镜像

#寻找差异表达基因
# find all markers of cluster 2
cluster2.markers <- FindMarkers(pbmc, ident.1 = 2)
head(cluster2.markers, n = 5)

# find all markers distinguishing cluster 5 from clusters 0 and 3
cluster5.markers <- FindMarkers(pbmc, ident.1 = 5, ident.2 = c(0, 3))
head(cluster5.markers, n = 5)

pbmc.markers <- FindAllMarkers(pbmc, only.pos = TRUE)
pbmc.markers %>%
  group_by(cluster) %>%
  dplyr::filter(avg_log2FC > 1)

#Seurat可以通过参数test.use设定检验差异表达的方法
cluster0.markers <- FindMarkers(pbmc, ident.1 = 0, logfc.threshold = 0.25,
                                test.use = "roc", only.pos = TRUE)
10,可视化基因
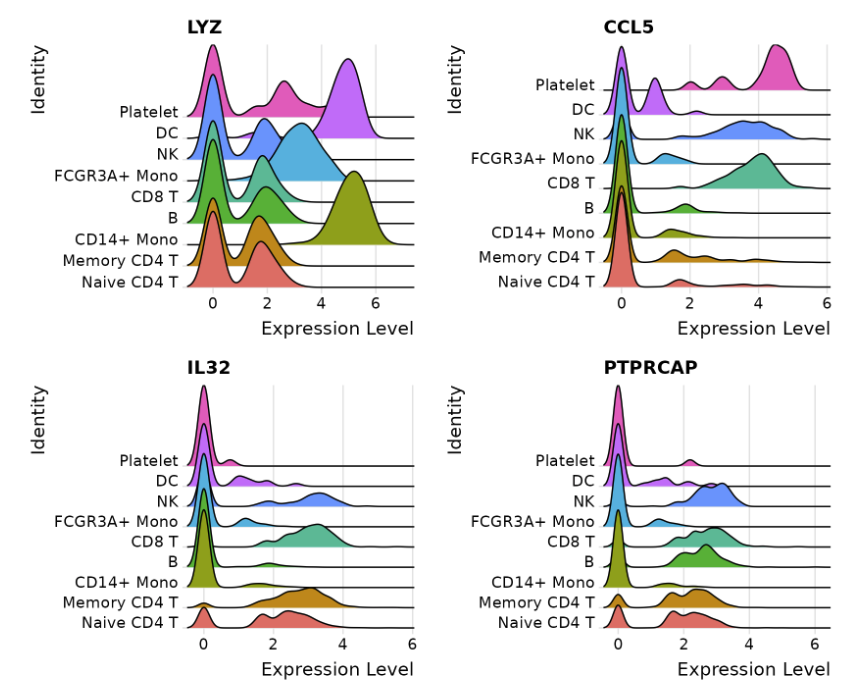
#可视化标记基因:VlnPlot基因表达分布;FeaturePlot在tSNE 中展示
VlnPlot(pbmc, features = c("MS4A1", "CD79A"))
# you can plot raw counts as well
VlnPlot(pbmc, features = c("NKG7", "PF4"), slot = "counts", log = TRUE)
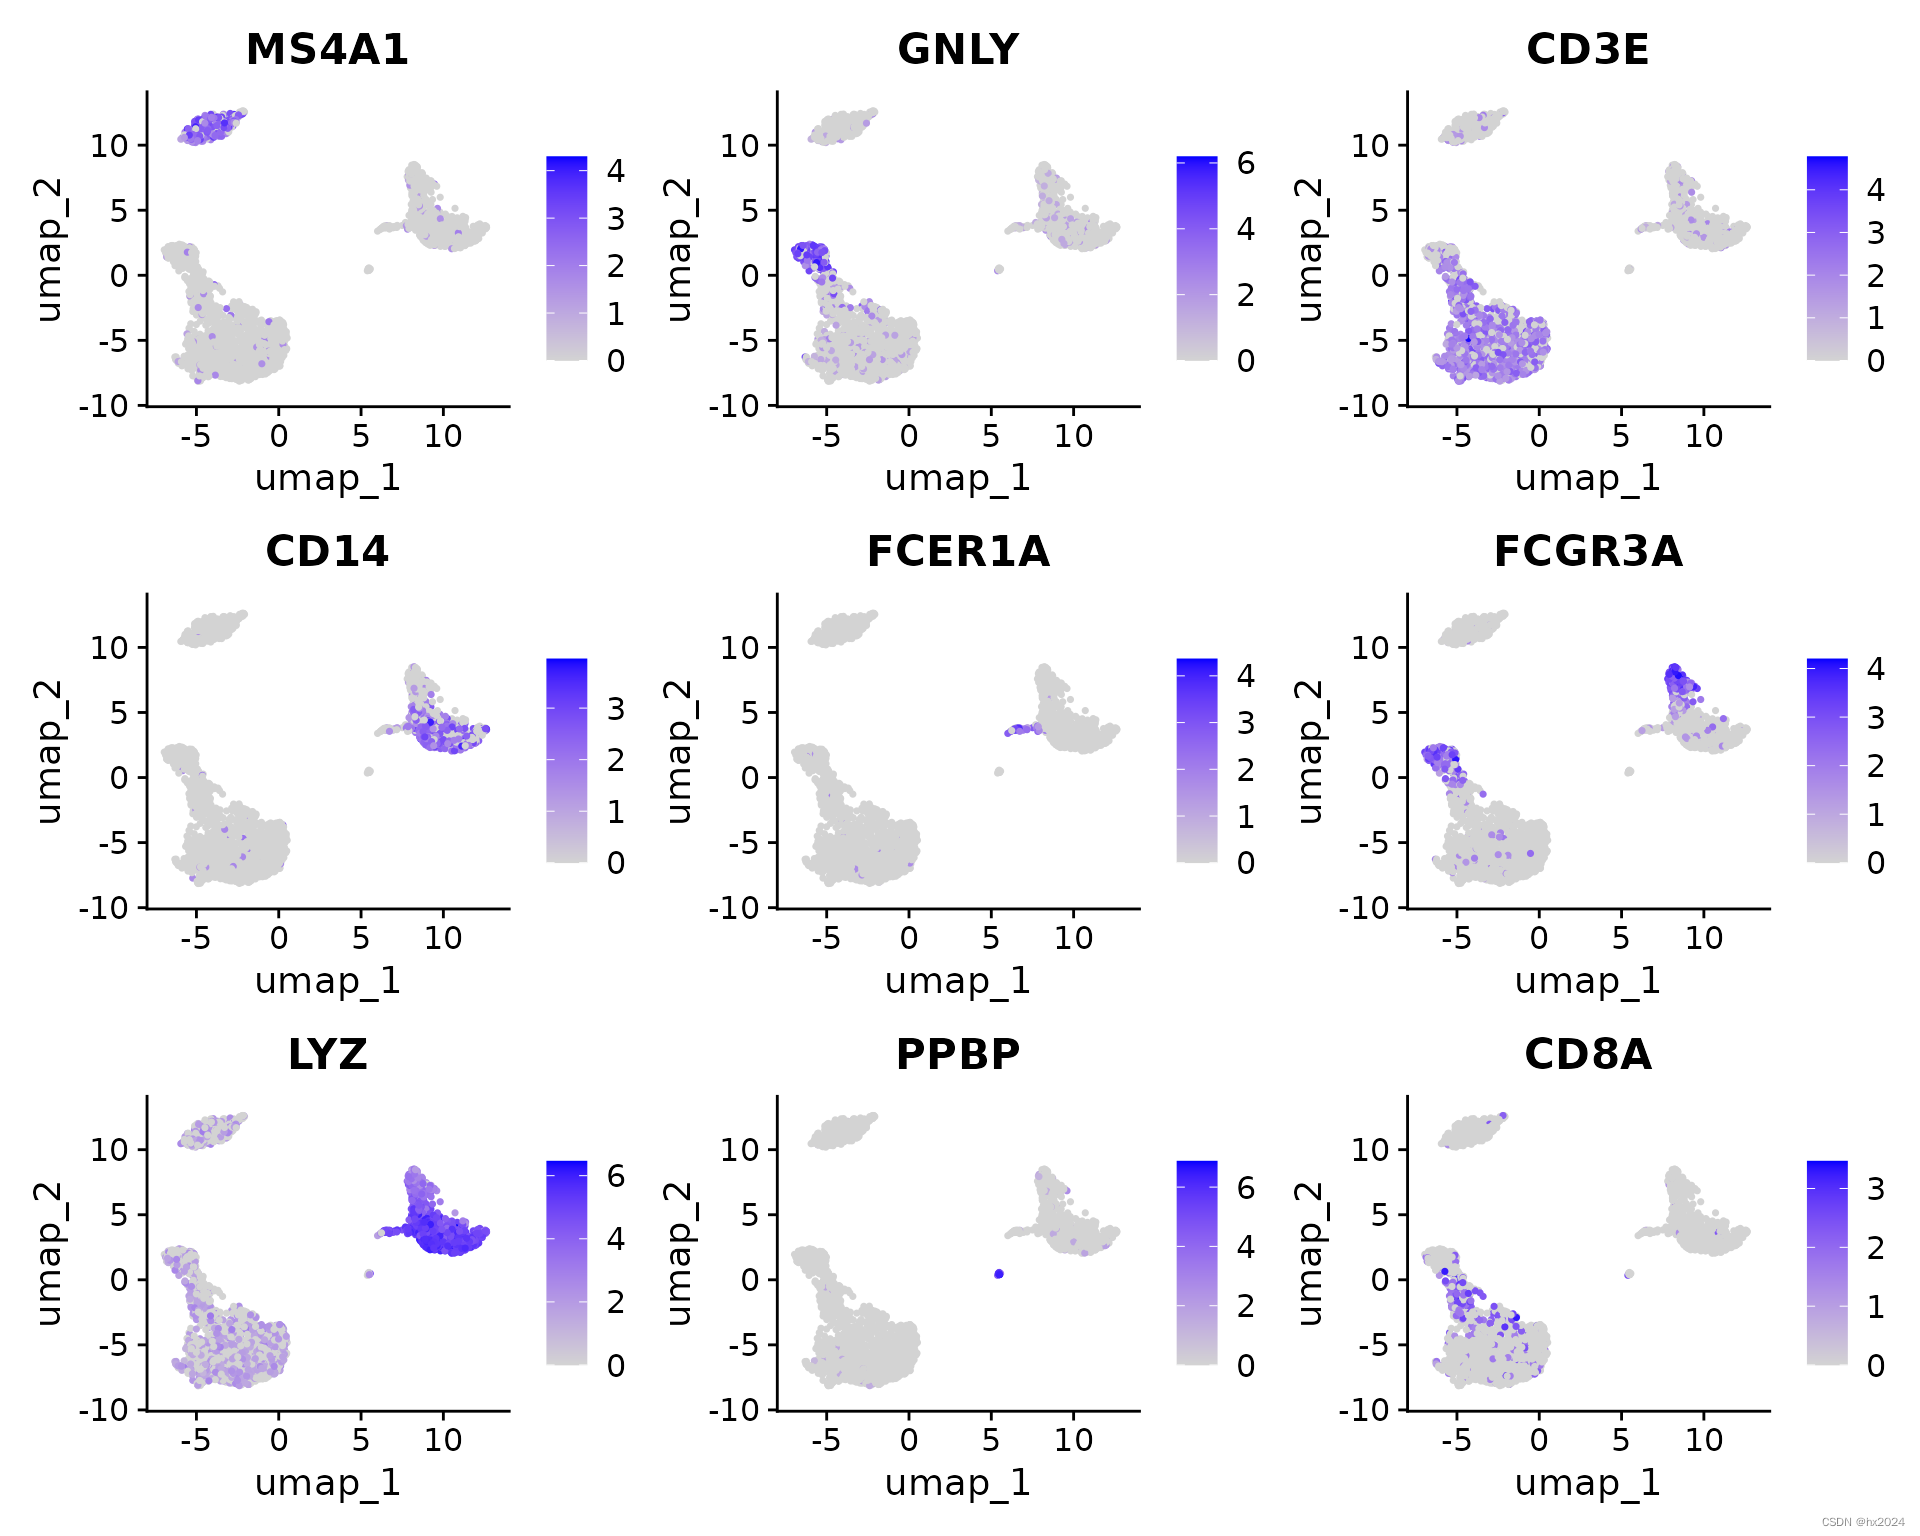
#降维展示
FeaturePlot(pbmc, features = c("MS4A1", "GNLY", "CD3E", "CD14", "FCER1A",
"FCGR3A", "LYZ", "PPBP","CD8A"))
#DoHeatmap为指定的细胞和基因花表达热图
pbmc.markers %>%
group_by(cluster) %>%
dplyr::filter(avg_log2FC > 1) %>%
slice_head(n = 10) %>%
ungroup() -> top10
DoHeatmap(pbmc, features = top10$gene) + NoLegend()
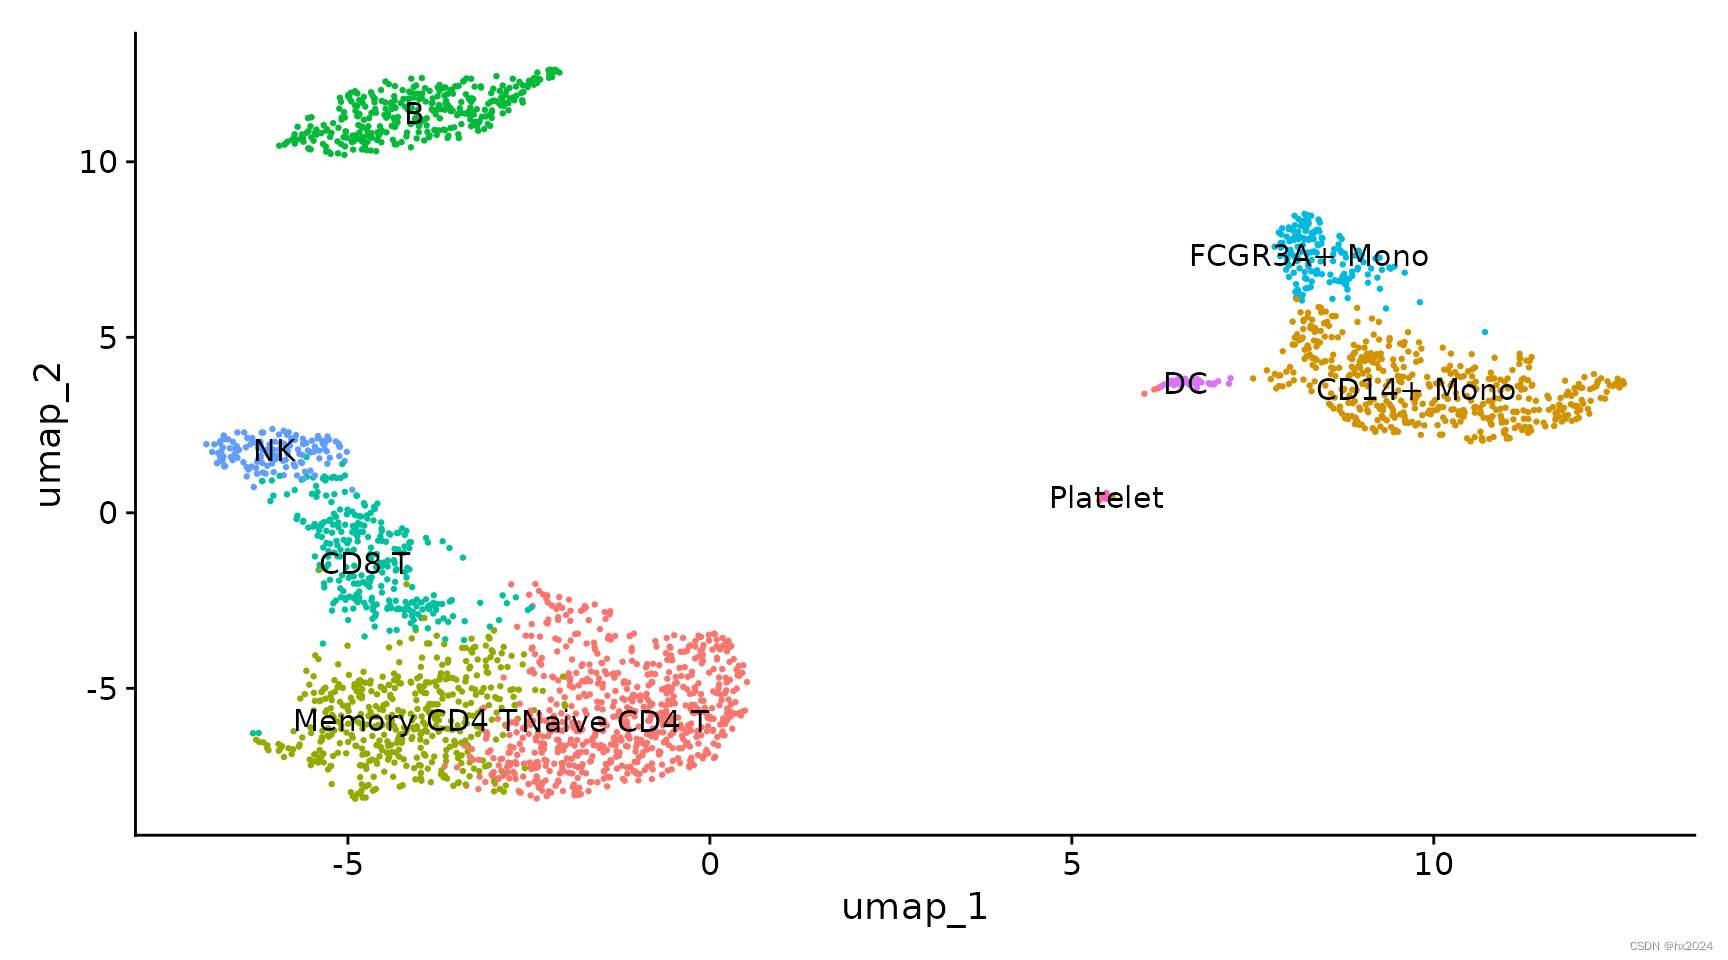
11,定义细胞类群
| Cluster ID | Markers | Cell Type |
|---|---|---|
| 0 | IL7R, CCR7 | Naive CD4+ T |
| 1 | CD14, LYZ | CD14+ Mono |
| 2 | IL7R, S100A4 | Memory CD4+ |
| 3 | MS4A1 | B |
| 4 | CD8A | CD8+ T |
| 5 | FCGR3A, MS4A7 | FCGR3A+ Mono |
| 6 | GNLY, NKG7 | NK |
| 7 | FCER1A, CST3 | DC |
| 8 | PPBP | Platelet |
#为聚类分配单元类型标识
new.cluster.ids <- c("Naive CD4 T", "CD14+ Mono", "Memory CD4 T", "B", "CD8 T", "FCGR3A+ Mono",
                     "NK", "DC", "Platelet")
names(new.cluster.ids) <- levels(pbmc)
pbmc <- RenameIdents(pbmc, new.cluster.ids)
DimPlot(pbmc, reduction = "umap", label = TRUE, pt.size = 0.5) + NoLegend()

#进行图片保存
#library(ggplot2)
#plot <- DimPlot(pbmc, reduction = "umap", label = TRUE, label.size = 4.5) + xlab("UMAP 1") + ylab("UMAP 2") +
#  theme(axis.title = element_text(size = 18), legend.text = element_text(size = 18)) + guides(colour = guide_legend(override.aes = list(size = 10)))
#ggsave(filename = "../output/images/pbmc3k_umap.jpg", height = 7, width = 12, plot = plot, quality = 50)
saveRDS(pbmc, file = "pbmc3k_final.rds")#用于cellchat准备
参考: