library(Seurat)
library(SeuratData)
library(patchwork)
# install dataset
InstallData("ifnb")
# load dataset
ifnb <- LoadData("ifnb")
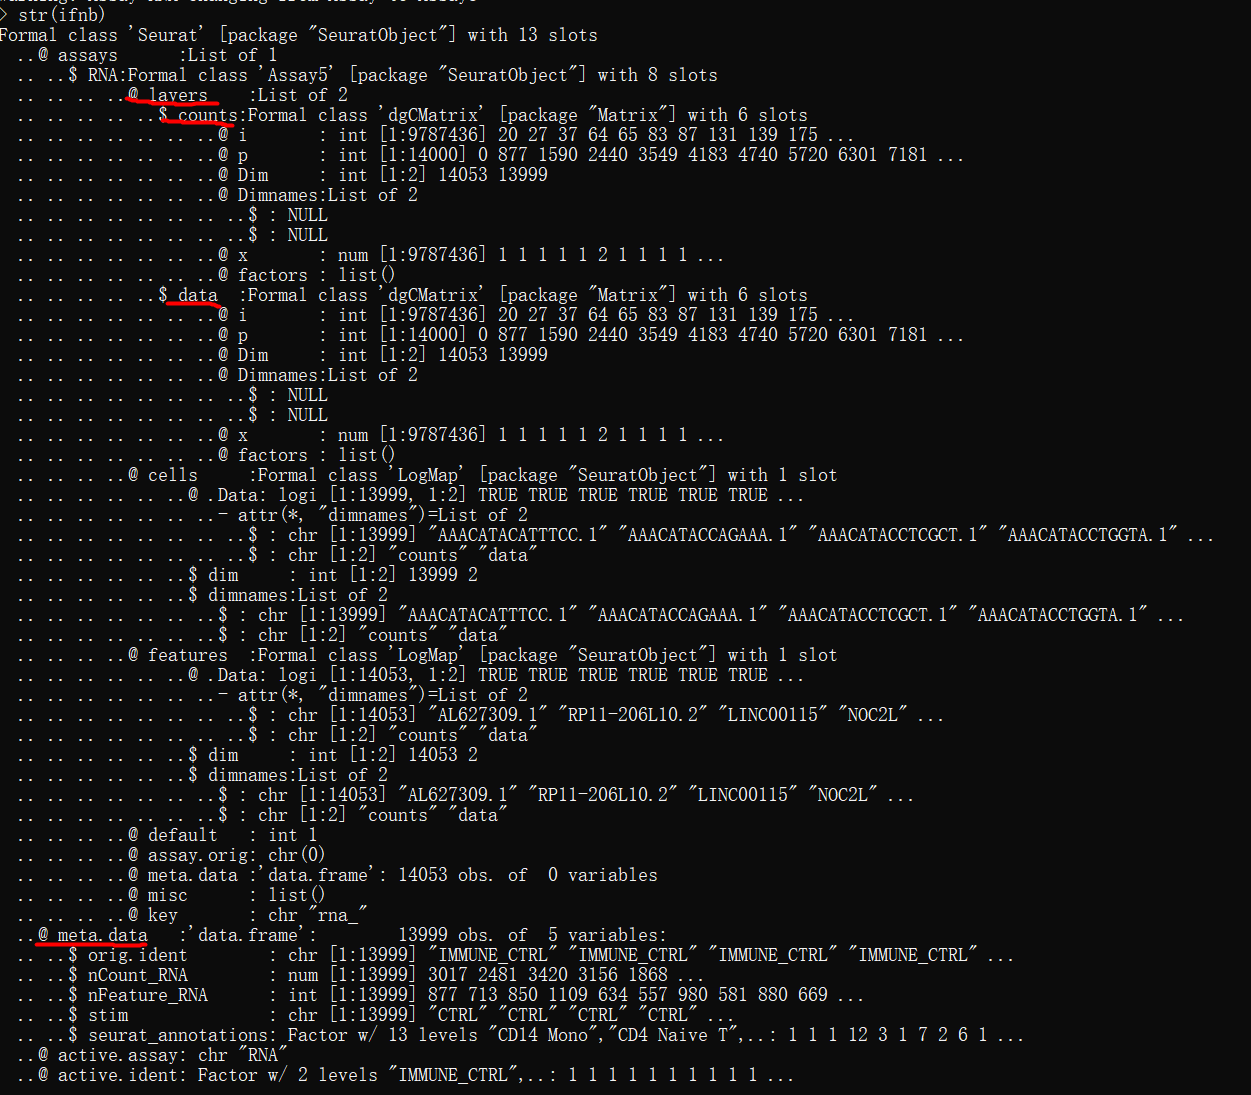
str(ifnb)
单个数据集对象的数据结构
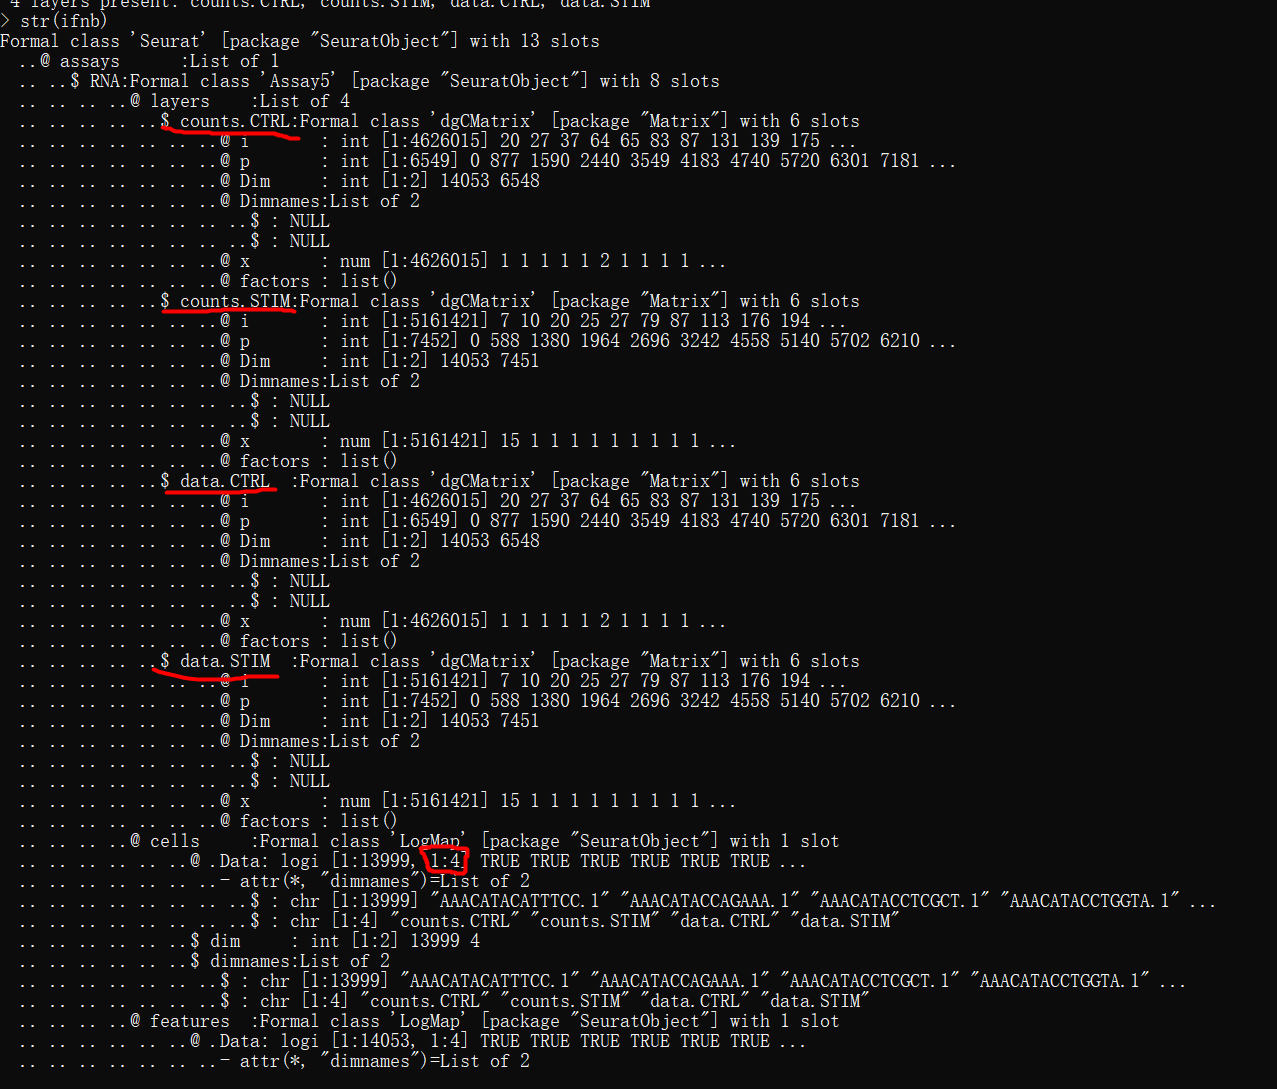
多个数据集对象的数据结构
# load dataset
ifnb <- LoadData("ifnb")
# split the RNA measurements into two layers one for control cells, one for stimulated cells

ifnb[["RNA"]] <- split(ifnb[["RNA"]], f = ifnb$stim)
ifnb
Perform analysis without integration
ifnb <- NormalizeData(ifnb)
ifnb <- FindVariableFeatures(ifnb)
ifnb <- ScaleData(ifnb)
ifnb <- RunPCA(ifnb)
ifnb <- FindNeighbors(ifnb, dims = 1:30, reduction = "pca")
ifnb <- FindClusters(ifnb, resolution = 2, cluster.name = "unintegrated_clusters")
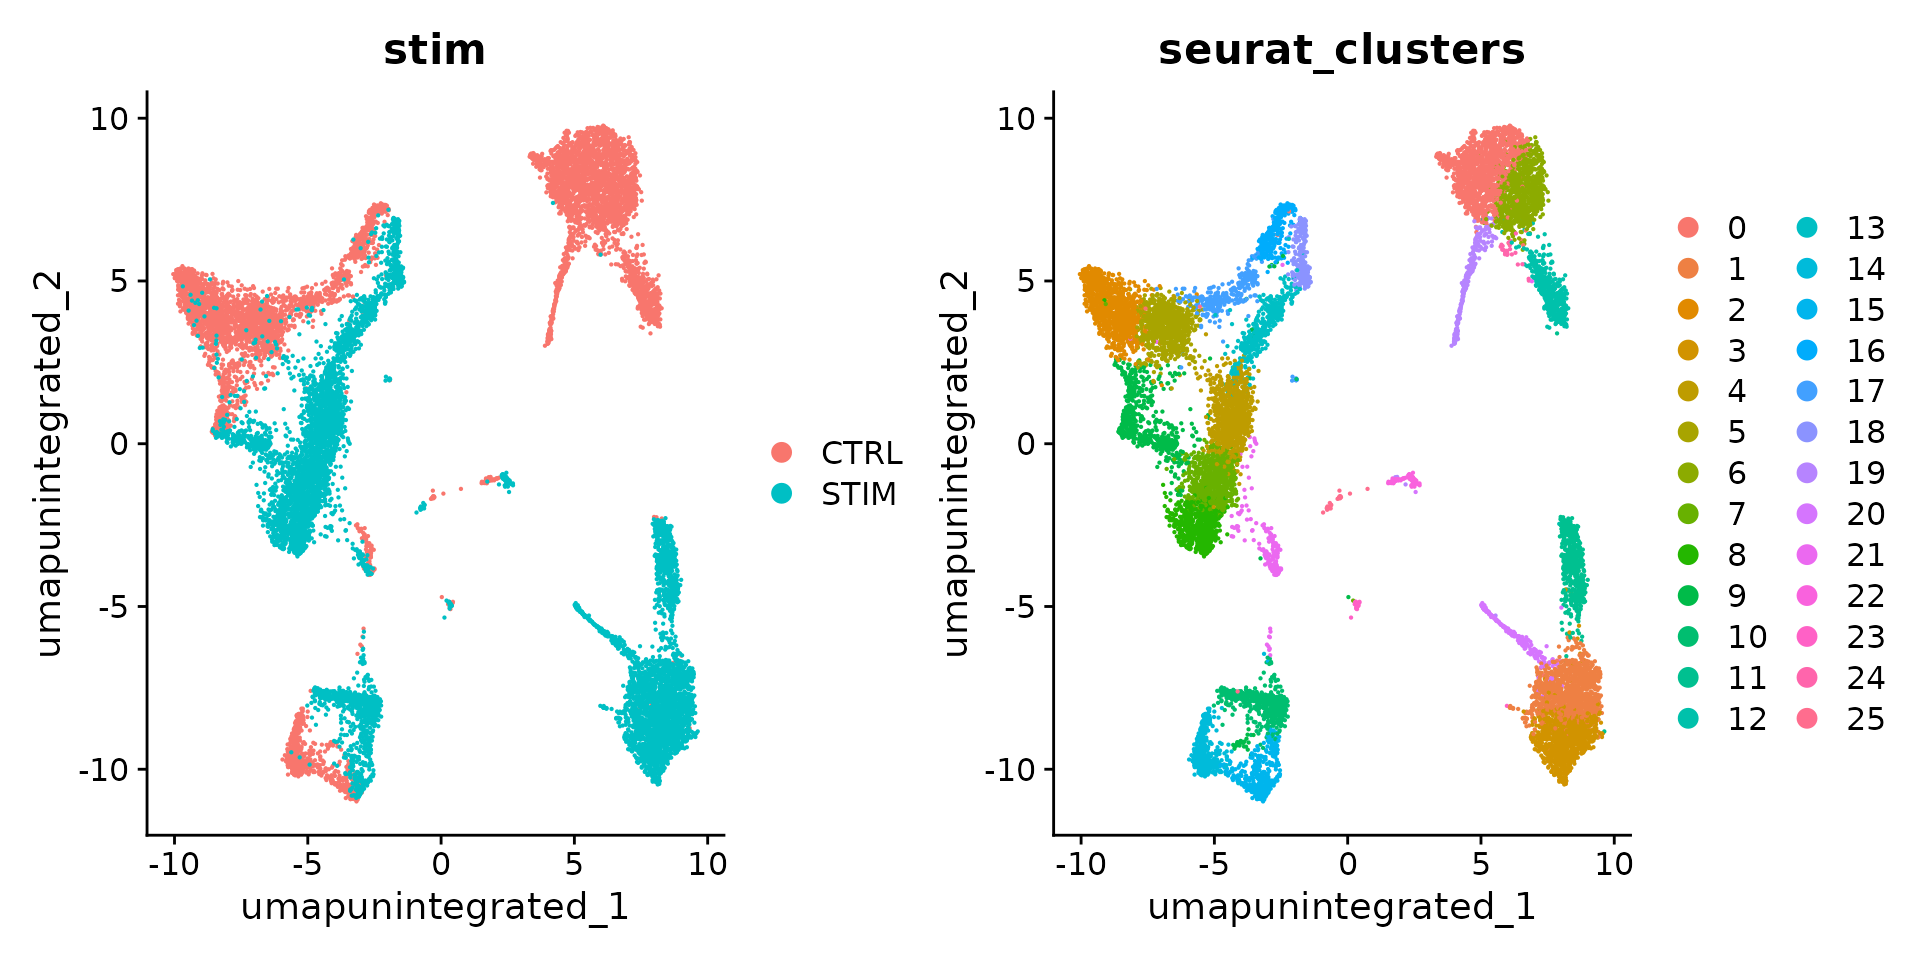
ifnb <- RunUMAP(ifnb, dims = 1:30, reduction = "pca", reduction.name = "umap.unintegrated")
DimPlot(ifnb, reduction = "umap.unintegrated", group.by = c("stim", "seurat_clusters"))
Perform integration
ifnb <- IntegrateLayers(object = ifnb, method = CCAIntegration, orig.reduction = "pca", new.reduction = "integrated.cca",
verbose = FALSE)
# re-join layers after integration
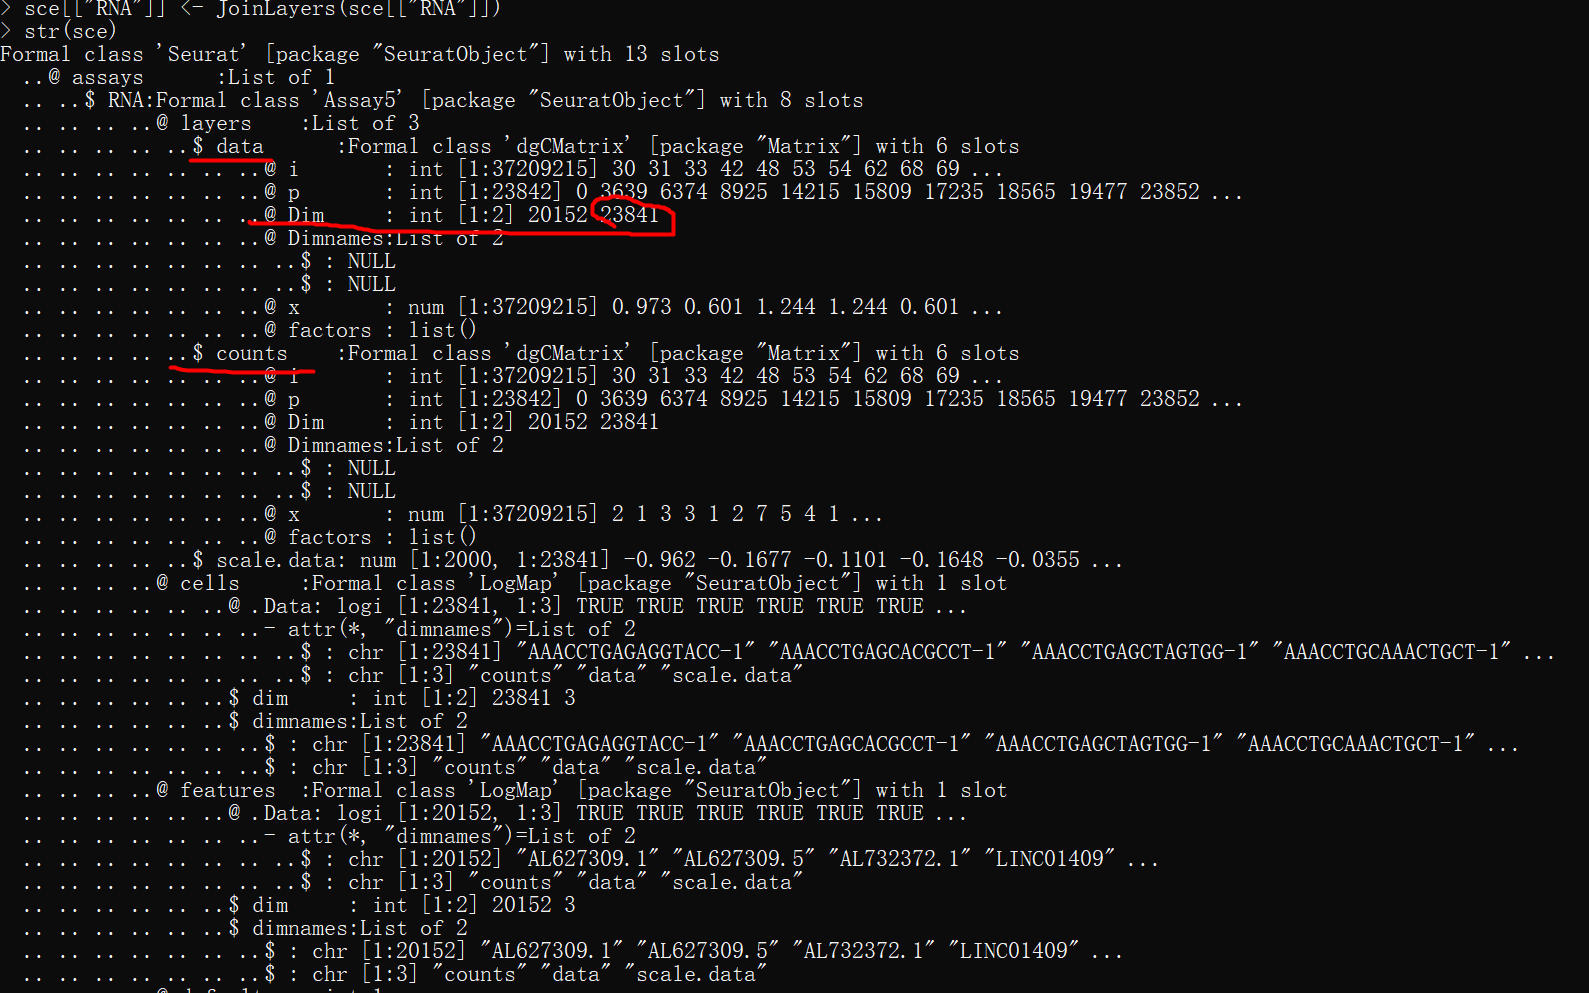
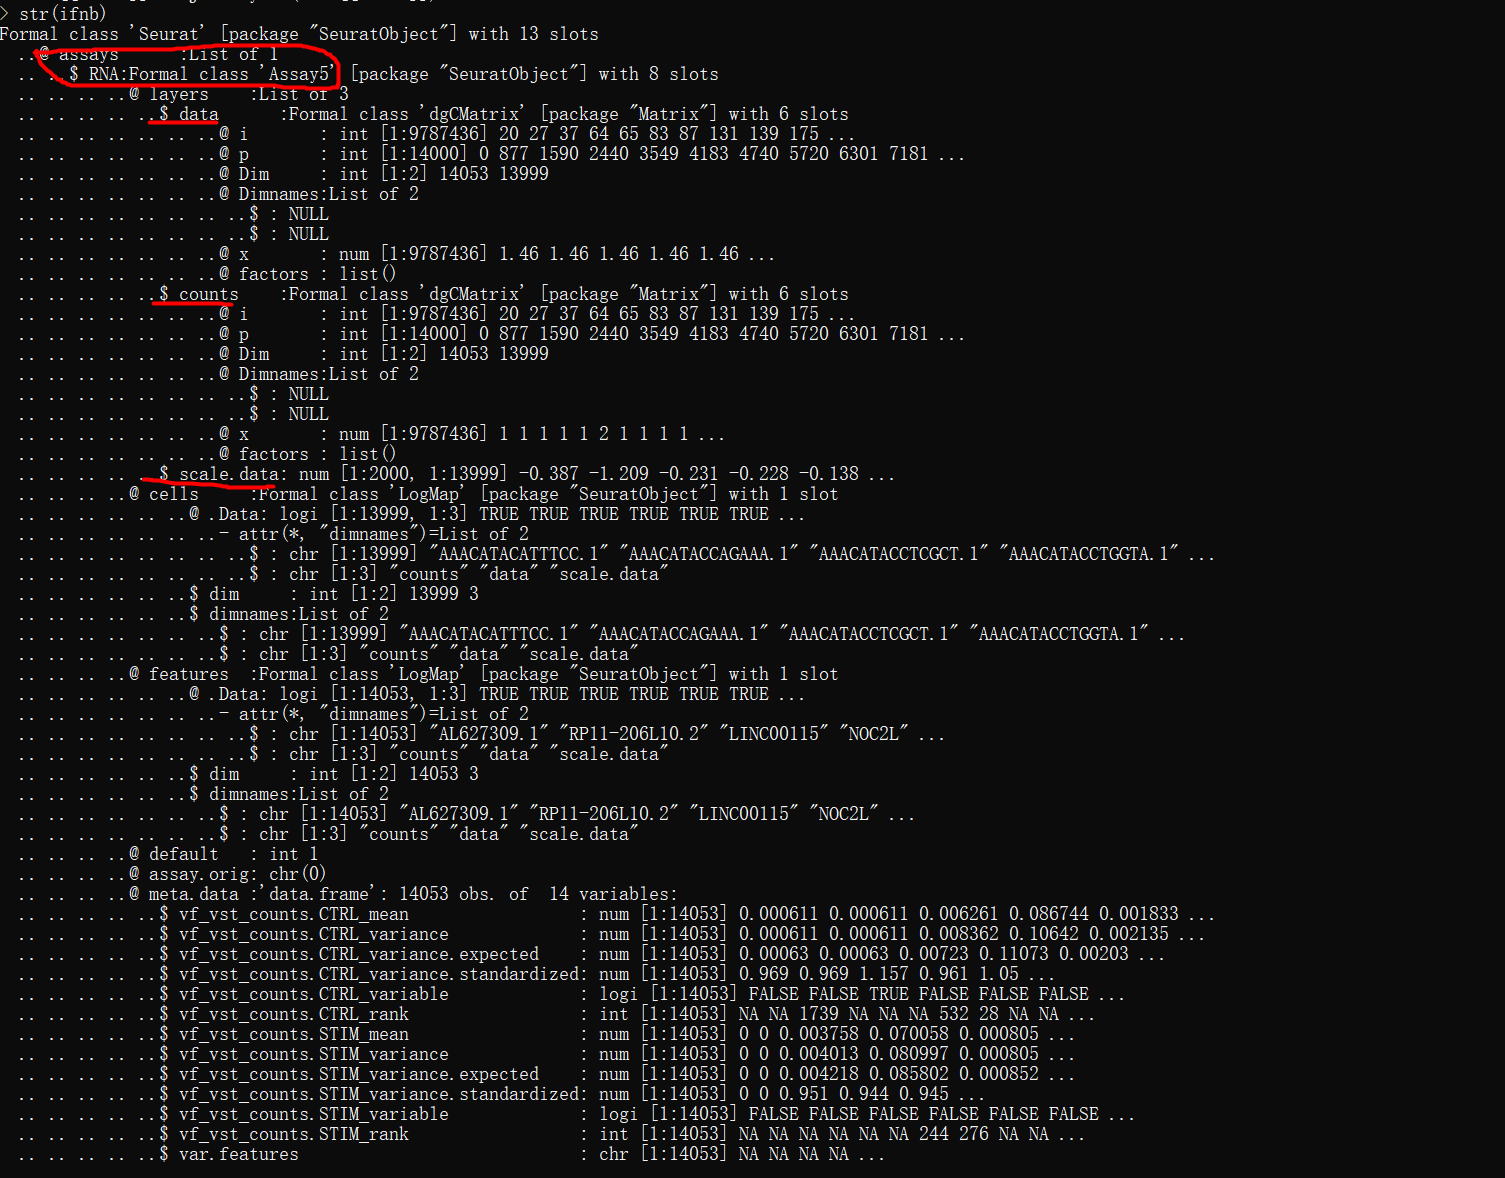
ifnb[["RNA"]] <- JoinLayers(ifnb[["RNA"]])
str(ifnb)
ifnb <- FindNeighbors(ifnb, reduction = "integrated.cca", dims = 1:30)
ifnb <- FindClusters(ifnb, resolution = 1)
ifnb <- RunUMAP(ifnb, dims = 1:30, reduction = "integrated.cca")
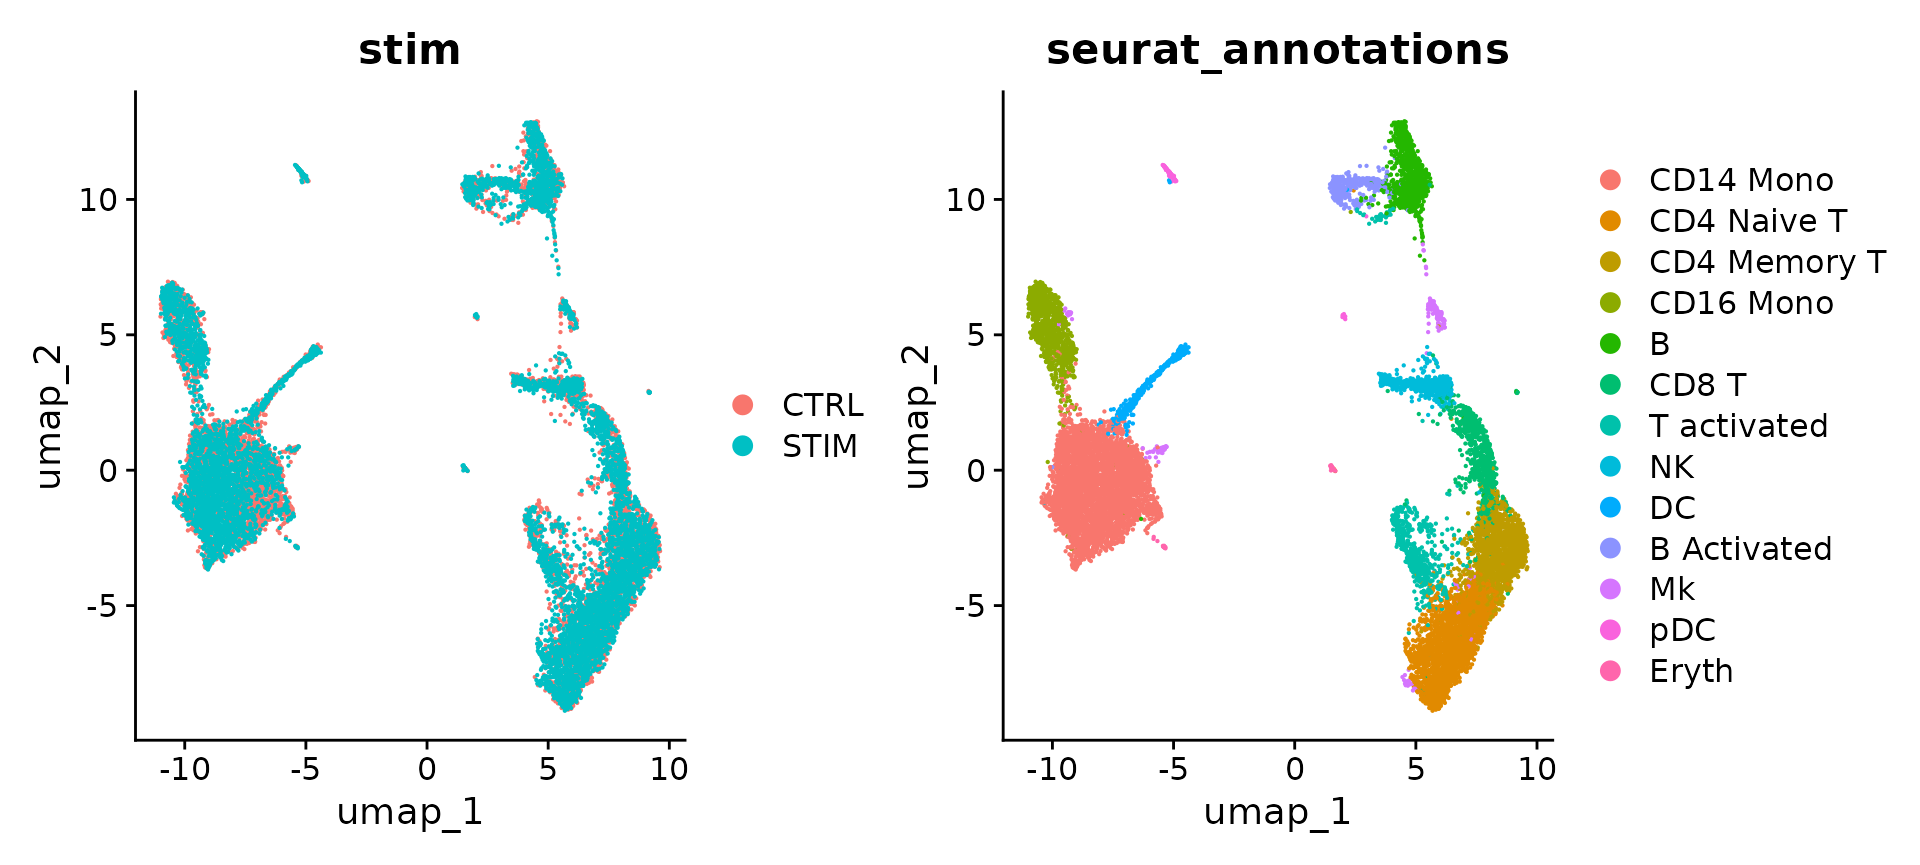
# Visualization
DimPlot(ifnb, reduction = "umap", group.by = c("stim", "seurat_annotations"))
个人数据部分
# conda env R4
library(Seurat)
library(tidyverse)
# getwd()
# [1] "/public/home/djs/huiyu/project/HY0007/20240325-scRNA/ANNO_XS01KF2023090059_PM-XS01KF2023090059-03_2024-03-20_18-43-41_223CKKLT4/reanalysis"

packageVersion("Seurat")
# [1] ‘5.0.1’

data.dir <- c("/public/home/djs/huiyu/project/HY0007/20240325-scRNA/ANNO_XS01KF2023090059_PM-XS01KF2023090059-03_2024-03-20_18-43-41_223CKKLT4/9323_map_to_ref/outs/filtered_feature_bc_matrix","
/public/home/djs/huiyu/project/HY0007/20240325-scRNA/ANNO_XS01KF2023090059_PM-XS01KF2023090059-03_2024-03-20_18-43-41_223CKKLT4/9347_map_to_ref/outs/filtered_feature_bc_matrix")

scelist <- lapply(data.dir,function(folder){CreateSeuratObject(counts = Read10X(folder),min.cells = 10,min.features  = 200)})
scelist[[1]]@meta.data$project.name <- "9323"  # 这里是每一个样本的名称,最后merge后再meta信息中显示
scelist[[2]]@meta.data$project.name <- "9347"

sce <- merge(scelist[[1]],scelist[[2]])
str(sce)
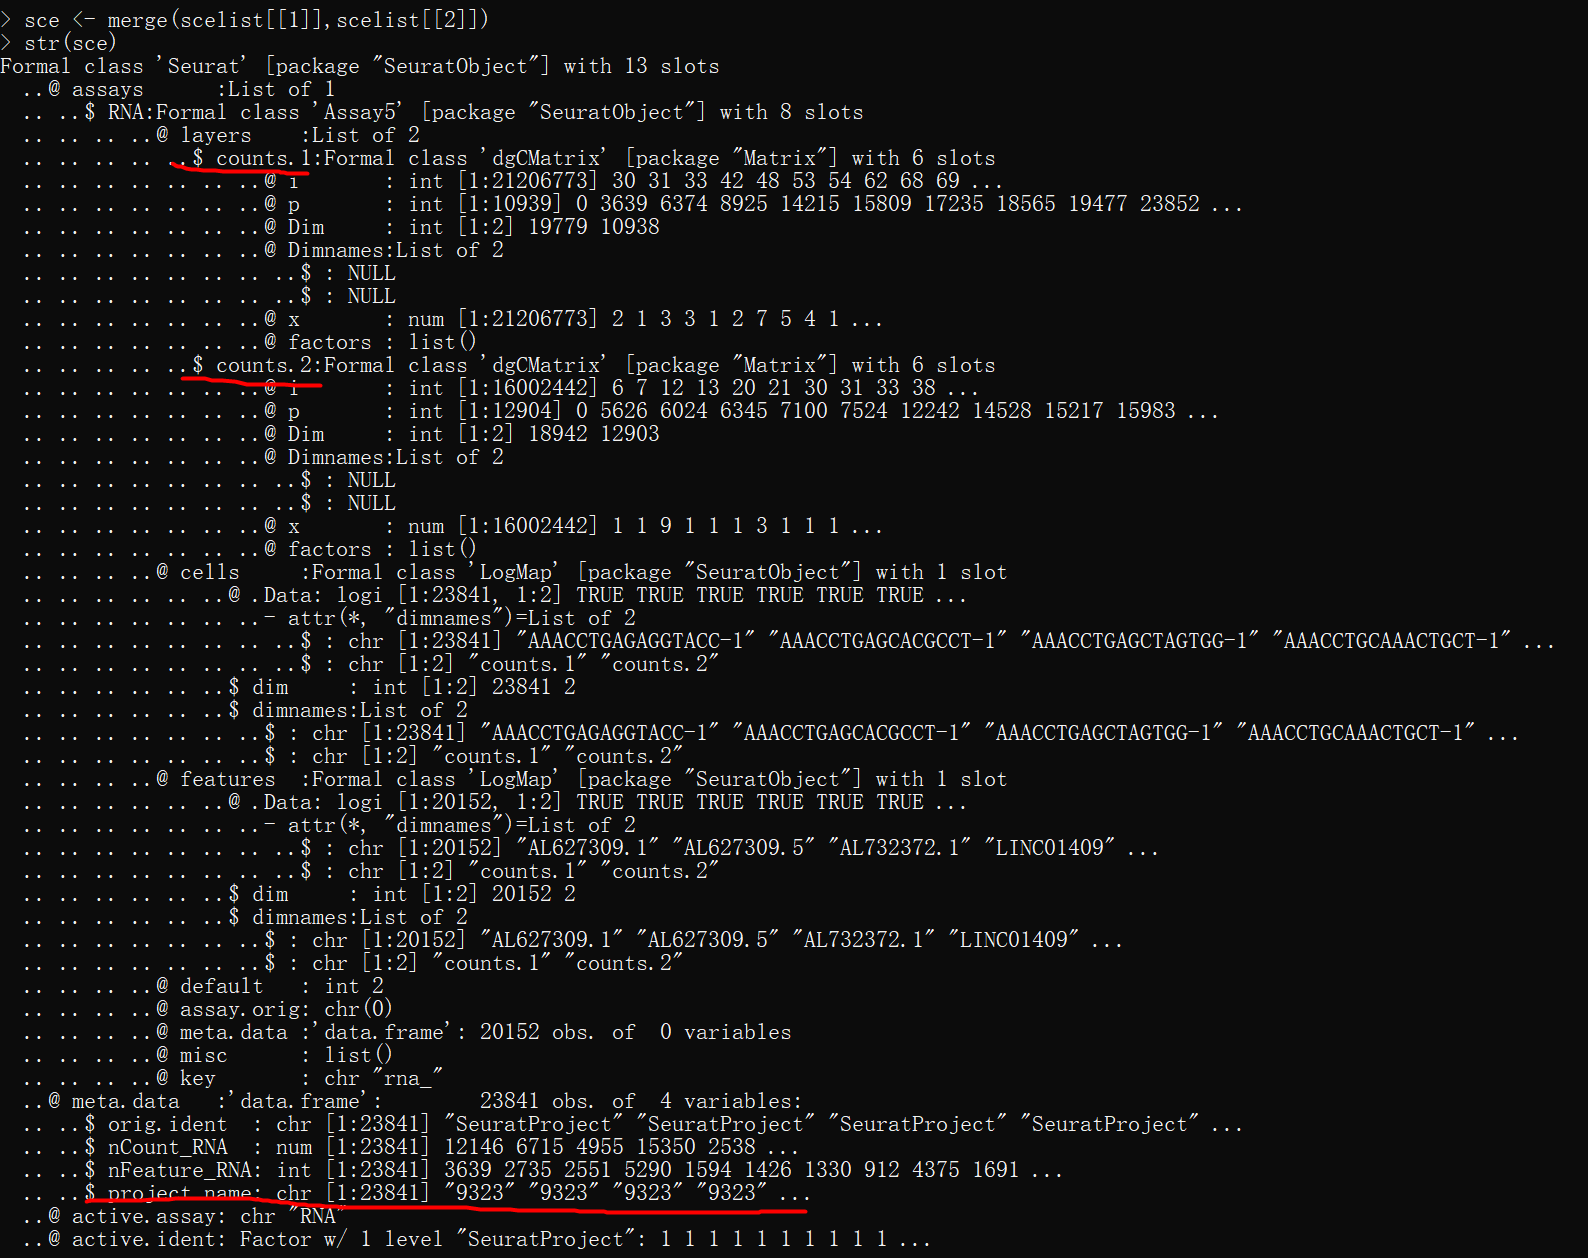
# 制造出sce 对象后跟着Seurat V5的教程走就可以了
# qc
mkdir {qc,multiqc}
conda activate NGS
ls * | while read id ;do (fastqc -o ../qc -q $id &);done
multiqc -o ./multiqc/ ./qc
# cellranger
/public/home/djs//software/cellranger-7.0.1/cellranger count \
--id 9323_map_to_ref \
--transcriptome /public/home/djs/reference/cellranger_count_ref/refdata-gex-GRCh38-2020-A \
--fastqs /public/home/djs/huiyu/project/HY0007/20240325-scRNA/ANNO_XS01KF2023090059_PM-XS01KF2023090059-03_2024-03-20_18-43-41_223CKKLT4/Rawdata/9347 \
--localcores 8 \
--localmem 64 &
/public/home/djs//software/cellranger-7.0.1/cellranger count \
--id 9347_map_to_ref \
--transcriptome /public/home/djs/reference/cellranger_count_ref/refdata-gex-GRCh38-2020-A \
--fastqs /public/home/djs/huiyu/project/HY0007/20240325-scRNA/ANNO_XS01KF2023090059_PM-XS01KF2023090059-03_2024-03-20_18-43-41_223CKKLT4/Rawdata/9347 \
--localcores 8 \
--localmem 64 &
tree 9347_map_to_ref
# 考虑到一些细胞的barcode可能出现重复,我把一些barcode的后缀改掉
cd 9347_map_to_ref/outs/filtered_feature_bc_matrix/
gzip -d barcodes.tsv.gz
sed "s/-1/-2/g" barcodes.tsv
sed -i "s/-1/-2/g" barcodes.tsv
gzip barcodes.tsv
# Seurat
mdkir reanalysis
conda deactivate
conda activate R4
########## step1 standard workfolw ###################
# conda env R4
library(Seurat)
library(tidyverse)
# getwd()
# [1] "/public/home/djs/huiyu/project/HY0007/20240325-scRNA/ANNO_XS01KF2023090059_PM-XS01KF2023090059-03_2024-03-20_18-43-41_223CKKLT4/reanalysis"
packageVersion("Seurat")
# [1] ‘5.0.1’
data.dir <- c("/public/home/djs/huiyu/project/HY0007/20240325-scRNA/ANNO_XS01KF2023090059_PM-XS01KF2023090059-03_2024-03-20_18-43-41_223CKKLT4/9323_map_to_ref/outs/filtered_feature_bc_matrix","
/public/home/djs/huiyu/project/HY0007/20240325-scRNA/ANNO_XS01KF2023090059_PM-XS01KF2023090059-03_2024-03-20_18-43-41_223CKKLT4/9347_map_to_ref/outs/filtered_feature_bc_matrix")
# 构建对象
scelist <- lapply(data.dir,function(folder){CreateSeuratObject(counts = Read10X(folder),min.cells = 10,min.features = 200)})
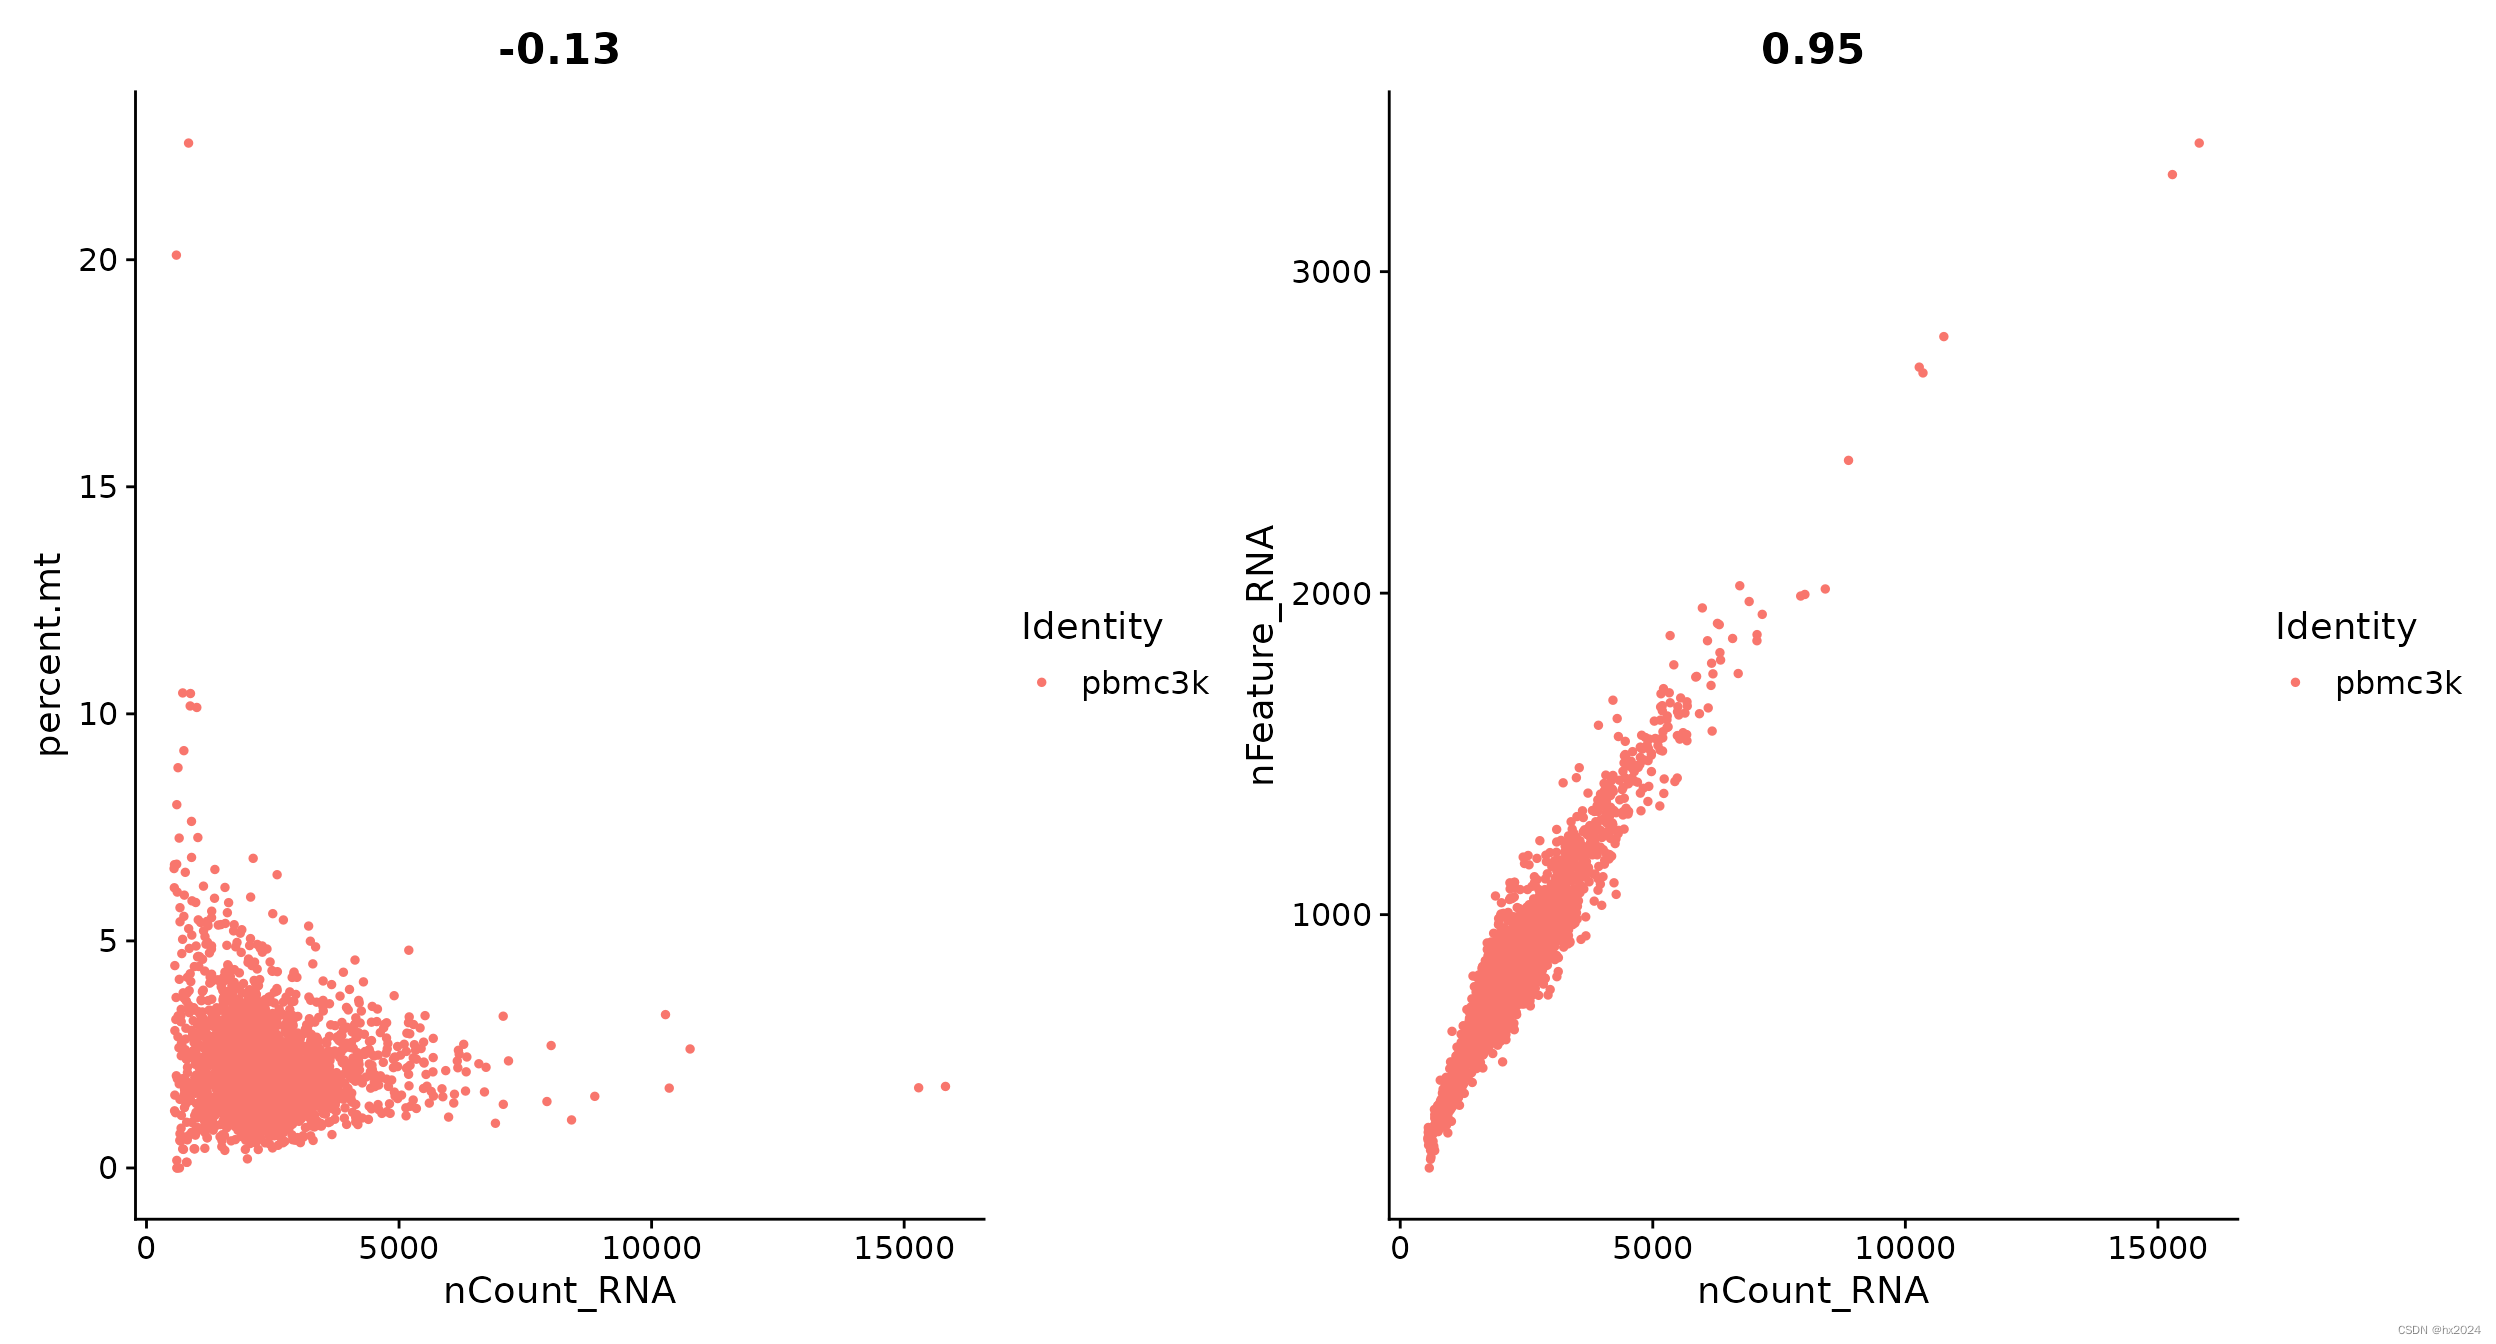
# 根据线粒体基因占比进行过滤
scelist <- lapply(scelist,function(sce){
sce[["percent.mt"]] <- PercentageFeatureSet(sce, pattern = "^MT-")
sce <- subset(pbmc, subset = nFeature_RNA > 200 & nFeature_RNA < 7500 & percent.mt < 15)
})
scelist[[1]]@meta.data$project.name <- "9323"
scelist[[2]]@meta.data$project.name <- "9347"
# 因为Seurat V5的所有counts 放在了layers下,此时需要merge各个样本对象
sce <- merge(scelist[[1]],scelist[[2]])
# str(sce)
saveRDS(sce, file="pre_sce.rds")
############### Perform analysis without integration (optional) ########################
# run standard anlaysis workflow
sce <- NormalizeData(sce)
sce <- FindVariableFeatures(sce)
sce <- ScaleData(sce)
sce <- RunPCA(sce)
pdf("Elboplot.pdf")
ElbowPlot(sce)
dev.off()
sce <- FindNeighbors(sce, dims = 1:15, reduction = "pca")
sce <- FindClusters(sce, resolution = 2, cluster.name = "unintegrated_clusters")
sce <- RunUMAP(sce, dims = 1:15, reduction = "pca", reduction.name = "umap.unintegrated")
pdf("Dimplot_UMAP.pdf",width=12,height=6)
DimPlot(sce, reduction = "umap.unintegrated", group.by = c("project.name", "seurat_clusters"))
dev.off()
########### step2 Perform integration ##################
sce <- IntegrateLayers(object = sce, method = CCAIntegration, orig.reduction = "pca", new.reduction = "integrated.cca",verbose = FALSE)
# re-join layers after integration
sce[["RNA"]] <- JoinLayers(sce[["RNA"]])
sce <- FindNeighbors(sce, reduction = "integrated.cca", dims = 1:15)
sce <- FindClusters(sce, resolution = 0.3)
sce <- RunUMAP(sce, dims = 1:15, reduction = "integrated.cca") # 注意这里使用的降维数据
# Visualization
pdf("Dimplot_UMAP_integration_1.pdf",width=12,height=6)
DimPlot(sce, reduction = "umap", group.by = c("project.name", "seurat_annotations"))
dev.off()
pdf("Dimplot_UMAP_integration_2.pdf",width=12,height=6)
DimPlot(sce, reduction = "umap", split.by = "project.name")
dev.off()
saveRDS(sce,file="sce.combined.rds")
################# step3 find markers and visualization##################
# By default, Seurat performs differential expression (DE) testing based on the non-parametric Wilcoxon rank sum test.
# find markers for every cluster compared to all remaining cells, report only the positive ones
dir.create("./DE_identification")
setwd("./DE_identification")
library(limma)
library(dplyr)
clusters <- unique(sce@meta.data$seurat_clusters)
for (i in clusters){
markers <- FindMarkers(sce, ident.1 = i, only.pos=T,group.by = "seurat_clusters",test.use = "wilcox_limma")
write.table(markers, file=paste("cluster_",i,"_pos.markers.xls", sep=""), sep="\t", quote=F)
#top20
sce_top20 <- markers %>% top_n(n = 20, wt=avg_log2FC)
features <- row.names(sce_top20)
pdf(paste("cluster",i,"_pos.markers.pdf", sep=""), height=18, width=24)
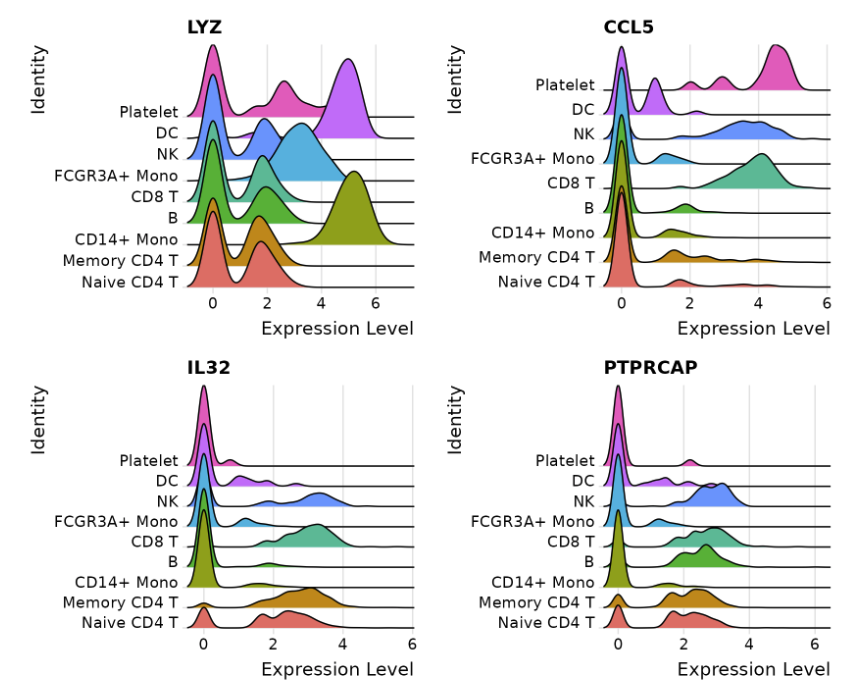
#a <- RidgePlot(immune.combined, idents="Epithelial_cells", sort="decreasing", group.by="cell_cluster_1stEpi", features = features, ncol = 5)
b <- VlnPlot(sce, group.by="seurat_clusters", features = features, ncol = 5, pt.size = 0)
#c <- FeaturePlot(immune.combined, features = features, ncol = 5)
#print(a); print(b); print(c)
print(b); dev.off()
}
# MANUAL pick marker gene for visualizing
pdf("VlnPlot_cluster3.pdf")
VlnPlot(immune.combined, features = c("CD3E", "CD8A","GZMB"))
dev.off()
pdf("FeaturePlot_cluster3.pdf")
FeaturePlot(immune.combined, features = c("CD3E", "CD8A","GZMB"))
dev.off()
##cell cluster annotation using SingleR 细胞注释
dir.create("../cell_annotation_singleR/")
setwd("../cell_annotation_singleR/")
library(SingleR)
library(SingleCellExperiment)
library(celldex)
library(pheatmap)
hpca.se <- HumanPrimaryCellAtlasData()
counts <- GetAssayData(sce[["RNA"]], slot="counts")
meta.data <- sce@meta.data
pred.sce <- SingleR(test = counts, ref = hpca.se, labels = hpca.se$label.main, clusters=meta.data$seurat_clusters)
write.table(pred.sce,"sce_singler.annotation.xls",sep="\t", quote=FALSE)
pdf("singleR_plotScoreHeatmap.pdf")
plotScoreHeatmap(pred.sce)
dev.off()
new.cluster.ids <- pred.sce$labels
names(new.cluster.ids) <- levels(sce)
sce <- RenameIdents(sce, new.cluster.ids)
pdf("SingleR_celltype.pdf",width=12,height=6)
DimPlot(sce1, reduction = "umap", label=T, label.size = 6) + NoLegend()
dev.off()