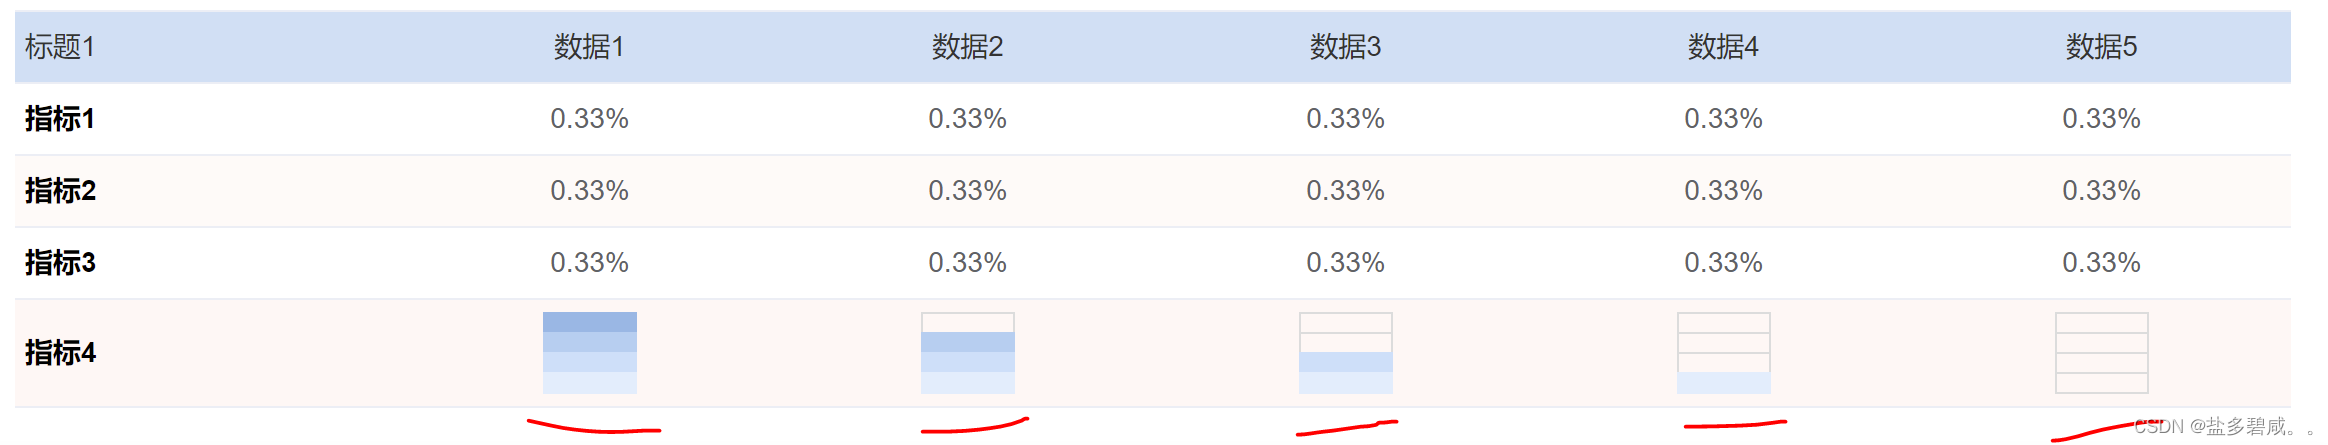
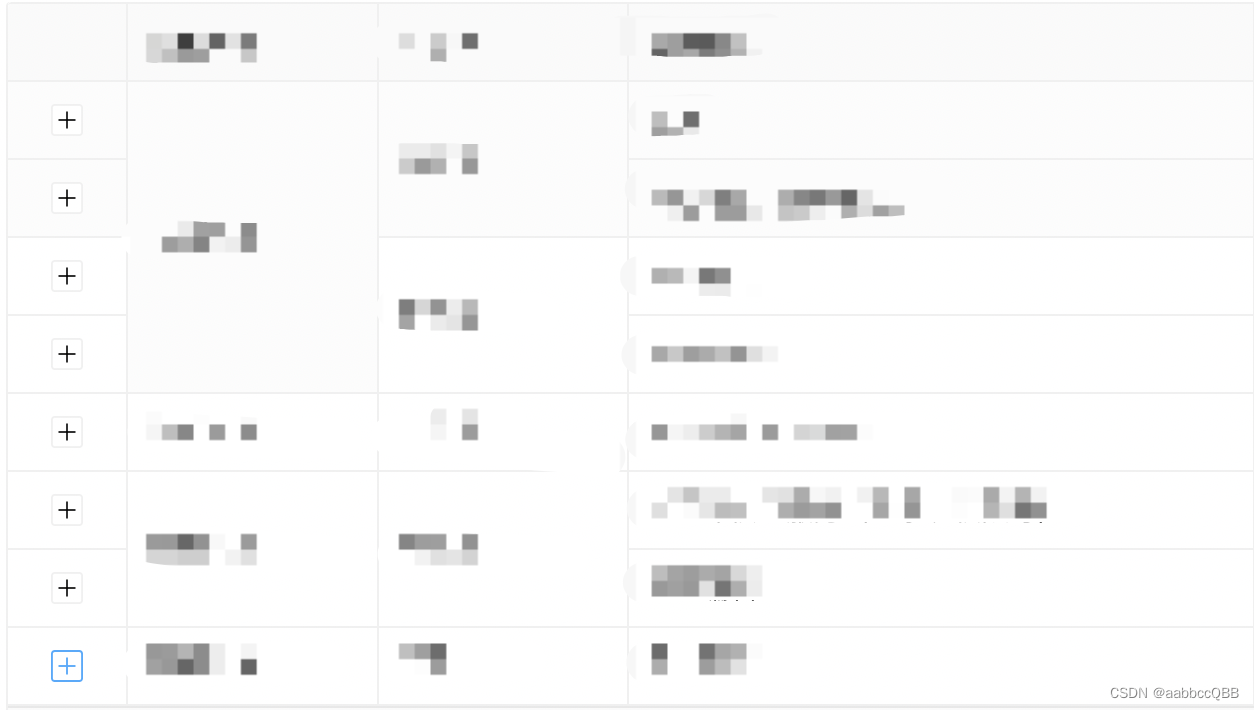
vue elementui el-table 表格里边展示四分位图
直接上代码(效果图在文章末尾):
父组件:
<template>
<el-table
      size="small"
      :header-cell-style="headerCellStyle()"
      style="width: 100%;"
      highlight-current-row
      row-key="index"
      :data="tableData1"
      >
      <el-table-column
        label="标题1"
        prop="name1"
        align="left">
        <template slot-scope="scope">
          <span>{{ scope.row.name1}}</span>
        </template>
      </el-table-column>
      <el-table-column
        label="数据1"
        prop="value1"
        align="center">
        <template slot-scope="scope">
          <div v-if="scope.row.name1 === '指标4'">
            <quartileChart :quartile="scope.row.value1"></quartileChart>
          </div>
          <span v-else>{{ scope.row.value1}}</span>
        </template>
      </el-table-column>
      <el-table-column
        label="数据2"
        prop="value2"
        align="center">
        <template slot-scope="scope">
          <div v-if="scope.row.name1 === '指标4'">
            <quartileChart :quartile="scope.row.value2"></quartileChart>
          </div>
          <span v-else>{{ scope.row.value2}}</span>
        </template>
      </el-table-column>
      <el-table-column
        label="数据3"
        prop="value3"
        align="center">
        <template slot-scope="scope">
          <div v-if="scope.row.name1 === '指标4'">
            <quartileChart :quartile="scope.row.value3"></quartileChart>
          </div>
          <span v-else>{{ scope.row.value3}}</span>
        </template>
      </el-table-column>
      <el-table-column
        label="数据4"
        prop="value4"
        align="center">
        <template slot-scope="scope">
          <div v-if="scope.row.name1 === '指标4'">
            <quartileChart :quartile="scope.row.value4"></quartileChart>
          </div>
          <span v-else>{{ scope.row.value4}}</span>
        </template>
      </el-table-column>
      <el-table-column
        label="数据5"
        prop="value5"
        align="center">
        <template slot-scope="scope">
          <div v-if="scope.row.name1 === '指标4'">
            <quartileChart :quartile="scope.row.value5"></quartileChart>
          </div>
          <span v-else>{{ scope.row.value5}}</span>
        </template>
      </el-table-column>
    </el-table>
</template>
<script>
import quartileChart from '@/components/quartileChart.vue' // 引入子组件(四分位图),注意引入路径
export default {
components: { quartileChart },
  data() {
    return {
    	tableData1: [
        {
          name1: '指标1',
          value1: '0.33%',
          value2: '0.33%',
          value3: '0.33%',
          value4: '0.33%',
          value5: '0.33%',
        },
        {
          name1: '指标2',
          value1: '0.33%',
          value2: '0.33%',
          value3: '0.33%',
          value4: '0.33%',
          value5: '0.33%',
        },
        {
          name1: '指标3',
          value1: '0.33%',
          value2: '0.33%',
          value3: '0.33%',
          value4: '0.33%',
          value5: '0.33%',
        },
        {
          name1: '指标4',
          value1: '1',
          value2: '2',
          value3: '3',
          value4: '4',
          value5: null,
        }
      ]
    },
    methods: {
      headerCellStyle () {
       return {
        color: " #333 !important",
        backgroundColor: "#cedff3  !important",
        fontSize: '14px',
        fontWeight: 500,
       }
      },

    }
  }
}

</script>
子组件:
<template>
  <div>
    <div v-if="5 - Number(quartile) === 1" class="ranking rank_1">
      <div class="r4"></div>
      <div class="r3"></div>
      <div class="r2"></div>
      <div class="r1"></div>
    </div>
    <div v-else-if="5 - Number(quartile) === 2" class="ranking rank_2">
      <div class="r4"></div>
      <div class="r3"></div>
      <div class="r2"></div>
      <div class="r1"></div>
    </div>
    <div v-else-if="5 - Number(quartile) === 3" class="ranking rank_3">
      <div class="r4"></div>
      <div class="r3"></div>
      <div class="r2"></div>
      <div class="r1"></div>
    </div>
    <div v-else-if="5 - Number(quartile) === 4" class="ranking rank_4">
      <div class="r4"></div>
      <div class="r3"></div>
      <div class="r2"></div>
      <div class="r1"></div>
    </div>
    <div v-else class="ranking rank_5">
      <div class="r4"></div>
      <div class="r3"></div>
      <div class="r2"></div>
      <div class="r1"></div>
    </div>
  </div>
</template>

<script>
export default {
  name: 'quartileChart',
  components: {},
  props: {
    quartile: {
      type: String,
    }
  },
  data () {
    return {
    }
  },
  created () {},
  mounted () {},
  computed: {},
  watch: {},
  methods: {},
}
</script>

<style lang="scss" scoped>
.ranking{
  width: 47px;
  margin: 0 auto;
  height: 39px;
  margin-top: 1px;
  margin-bottom: 2px;
  div {
    height: 9px;
    zoom: 1;
    overflow: hidden;
    border: 1px solid #dcdcdc;
    margin-top: -1px;
  }
}
.rank_1 {
  .r4 {
    height: 11px;
  }
  .r3 {
    height: 11px;
  }
  .r2 {
    height: 11px;
  }
  .r1 {
    border: 0;
    background: #e1edfc;
    height: 11px;
  }
}
.rank_2 {
  .r4 {
    height: 11px;
  }
  .r3 {
    height: 11px;
  }
  .r2 {
    border: 0;
    background: #cbdff8;
    height: 11px;
  }
  .r1 {
    border: 0;
    background: #e1edfc;
    height: 11px;
  }
}
.rank_3 {
  .r4 {
    height: 11px;
  }
  .r3 {
    border: 0;
    background: #b3ceef;
    height: 11px;
  }
  .r2 {
    border: 0;
    background: #cbdff8;
    height: 11px;
  }
  .r1 {
    border: 0;
    background: #e1edfc;
    height: 11px;
  }
}
.rank_4 {
  .r4 {
    border: 0;
    background: #94b7e3;
    height: 11px;
  }
  .r3 {
    border: 0;
    background: #b3ceef;
    height: 11px;
  }
  .r2 {
    border: 0;
    background: #cbdff8;
    height: 11px;
  }
  .r1 {
    border: 0;
    background: #e1edfc;
    height: 11px;
  }
}
.rank_5 {
  .r4 {
    height: 11px;
  }
  .r3 {
    height: 11px;
  }
  .r2 {
    height: 11px;
  }
  .r1 {
    height: 11px;
  }
}

</style>
展示效果图: