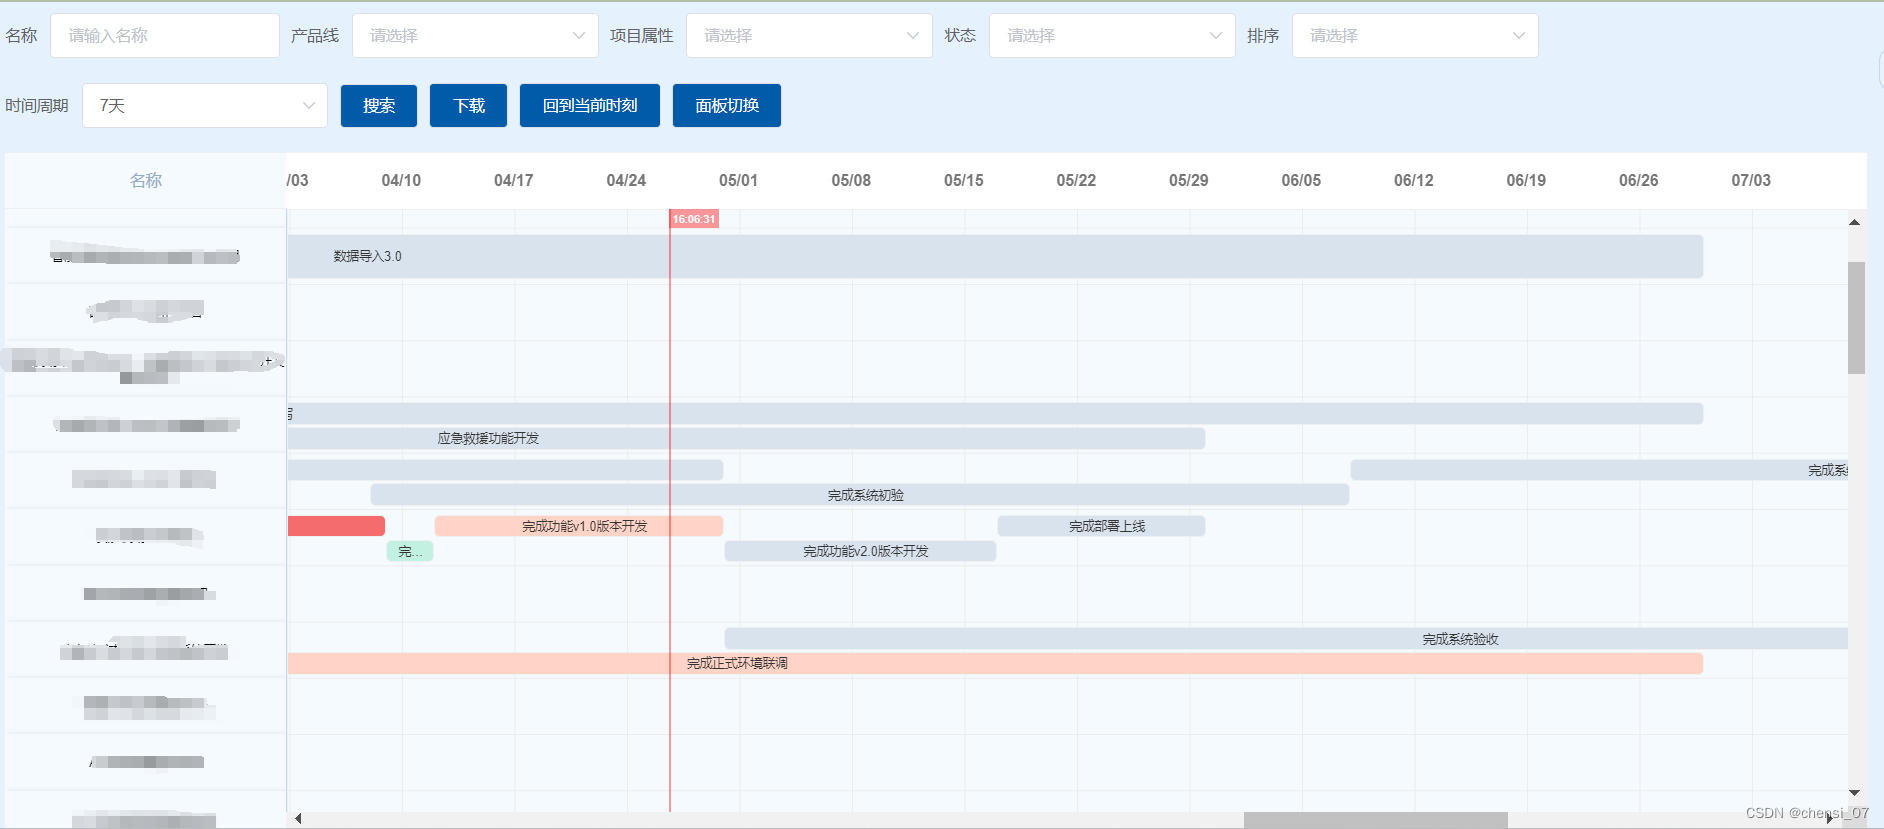
项目需求:
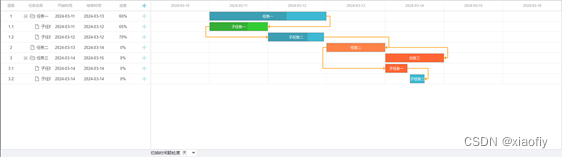
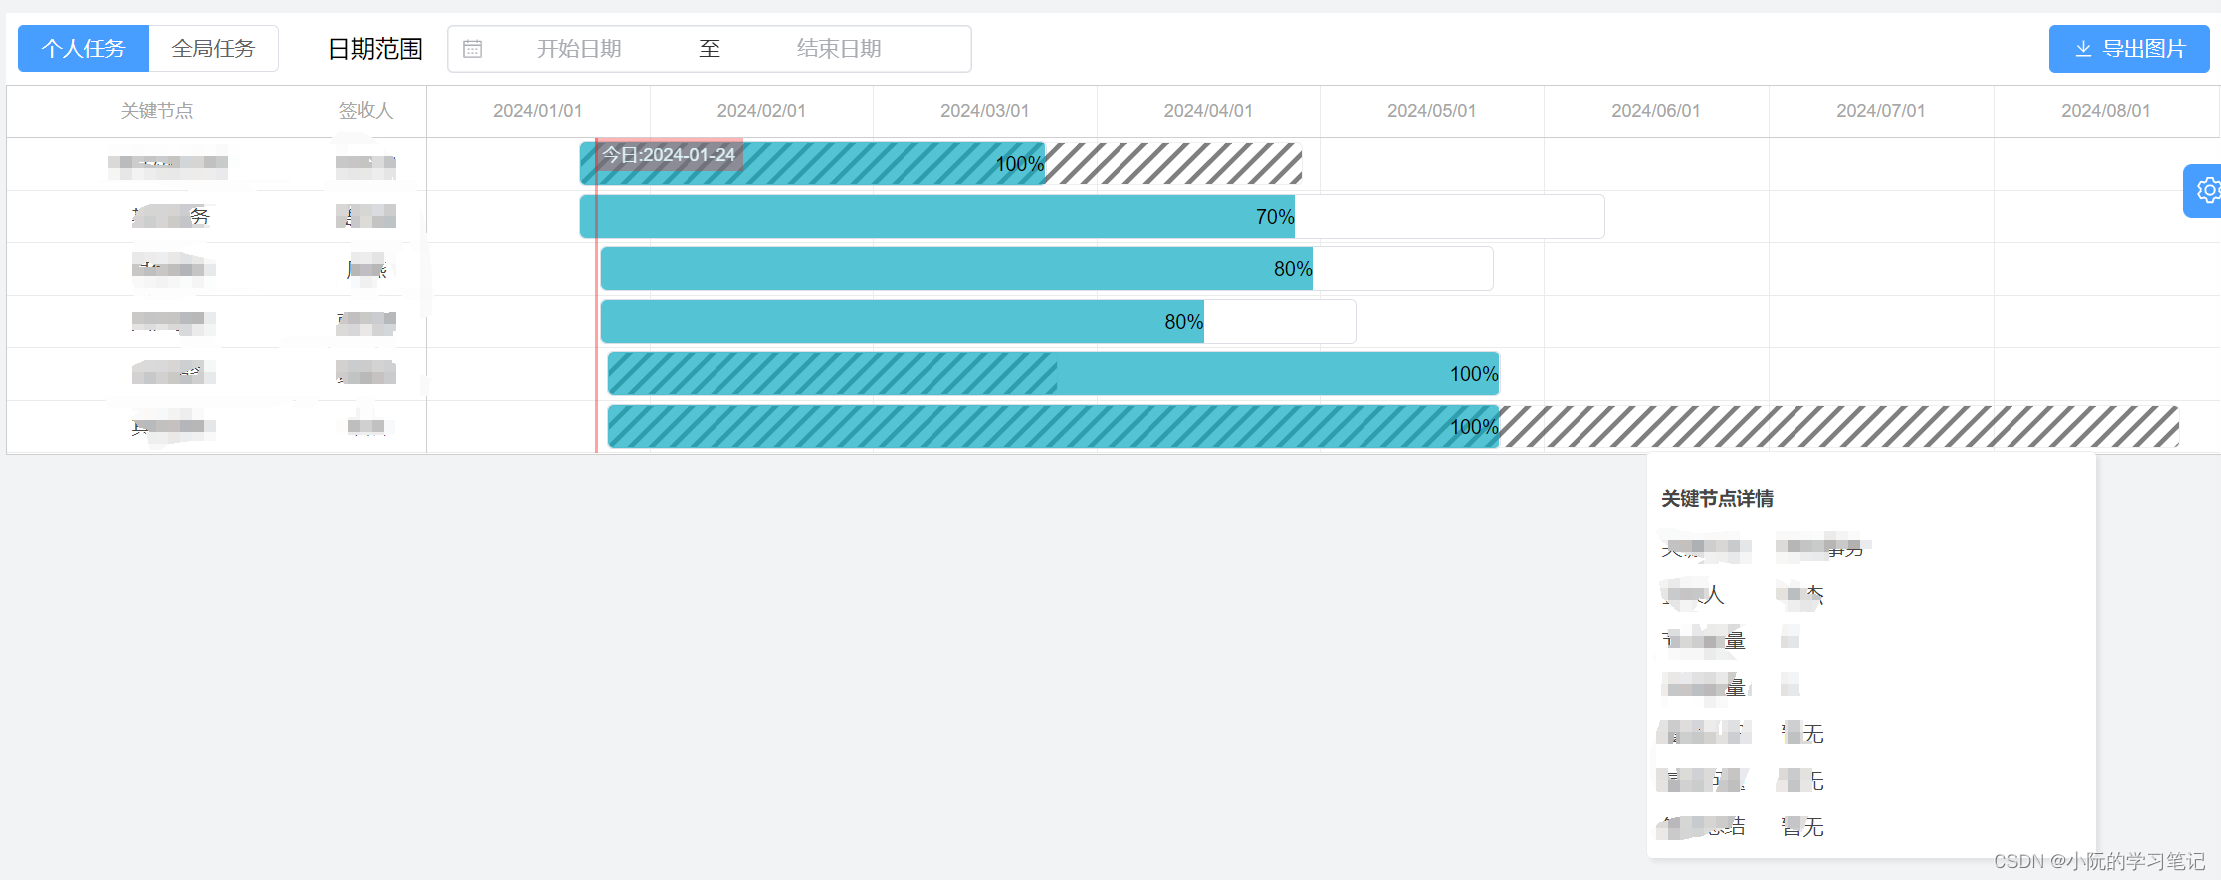
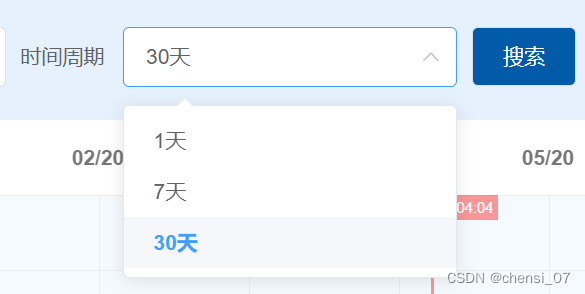
实现以1天、7天、30天为周期(周期根据筛选条件选择),展示每个项目不同里程碑任务进度。
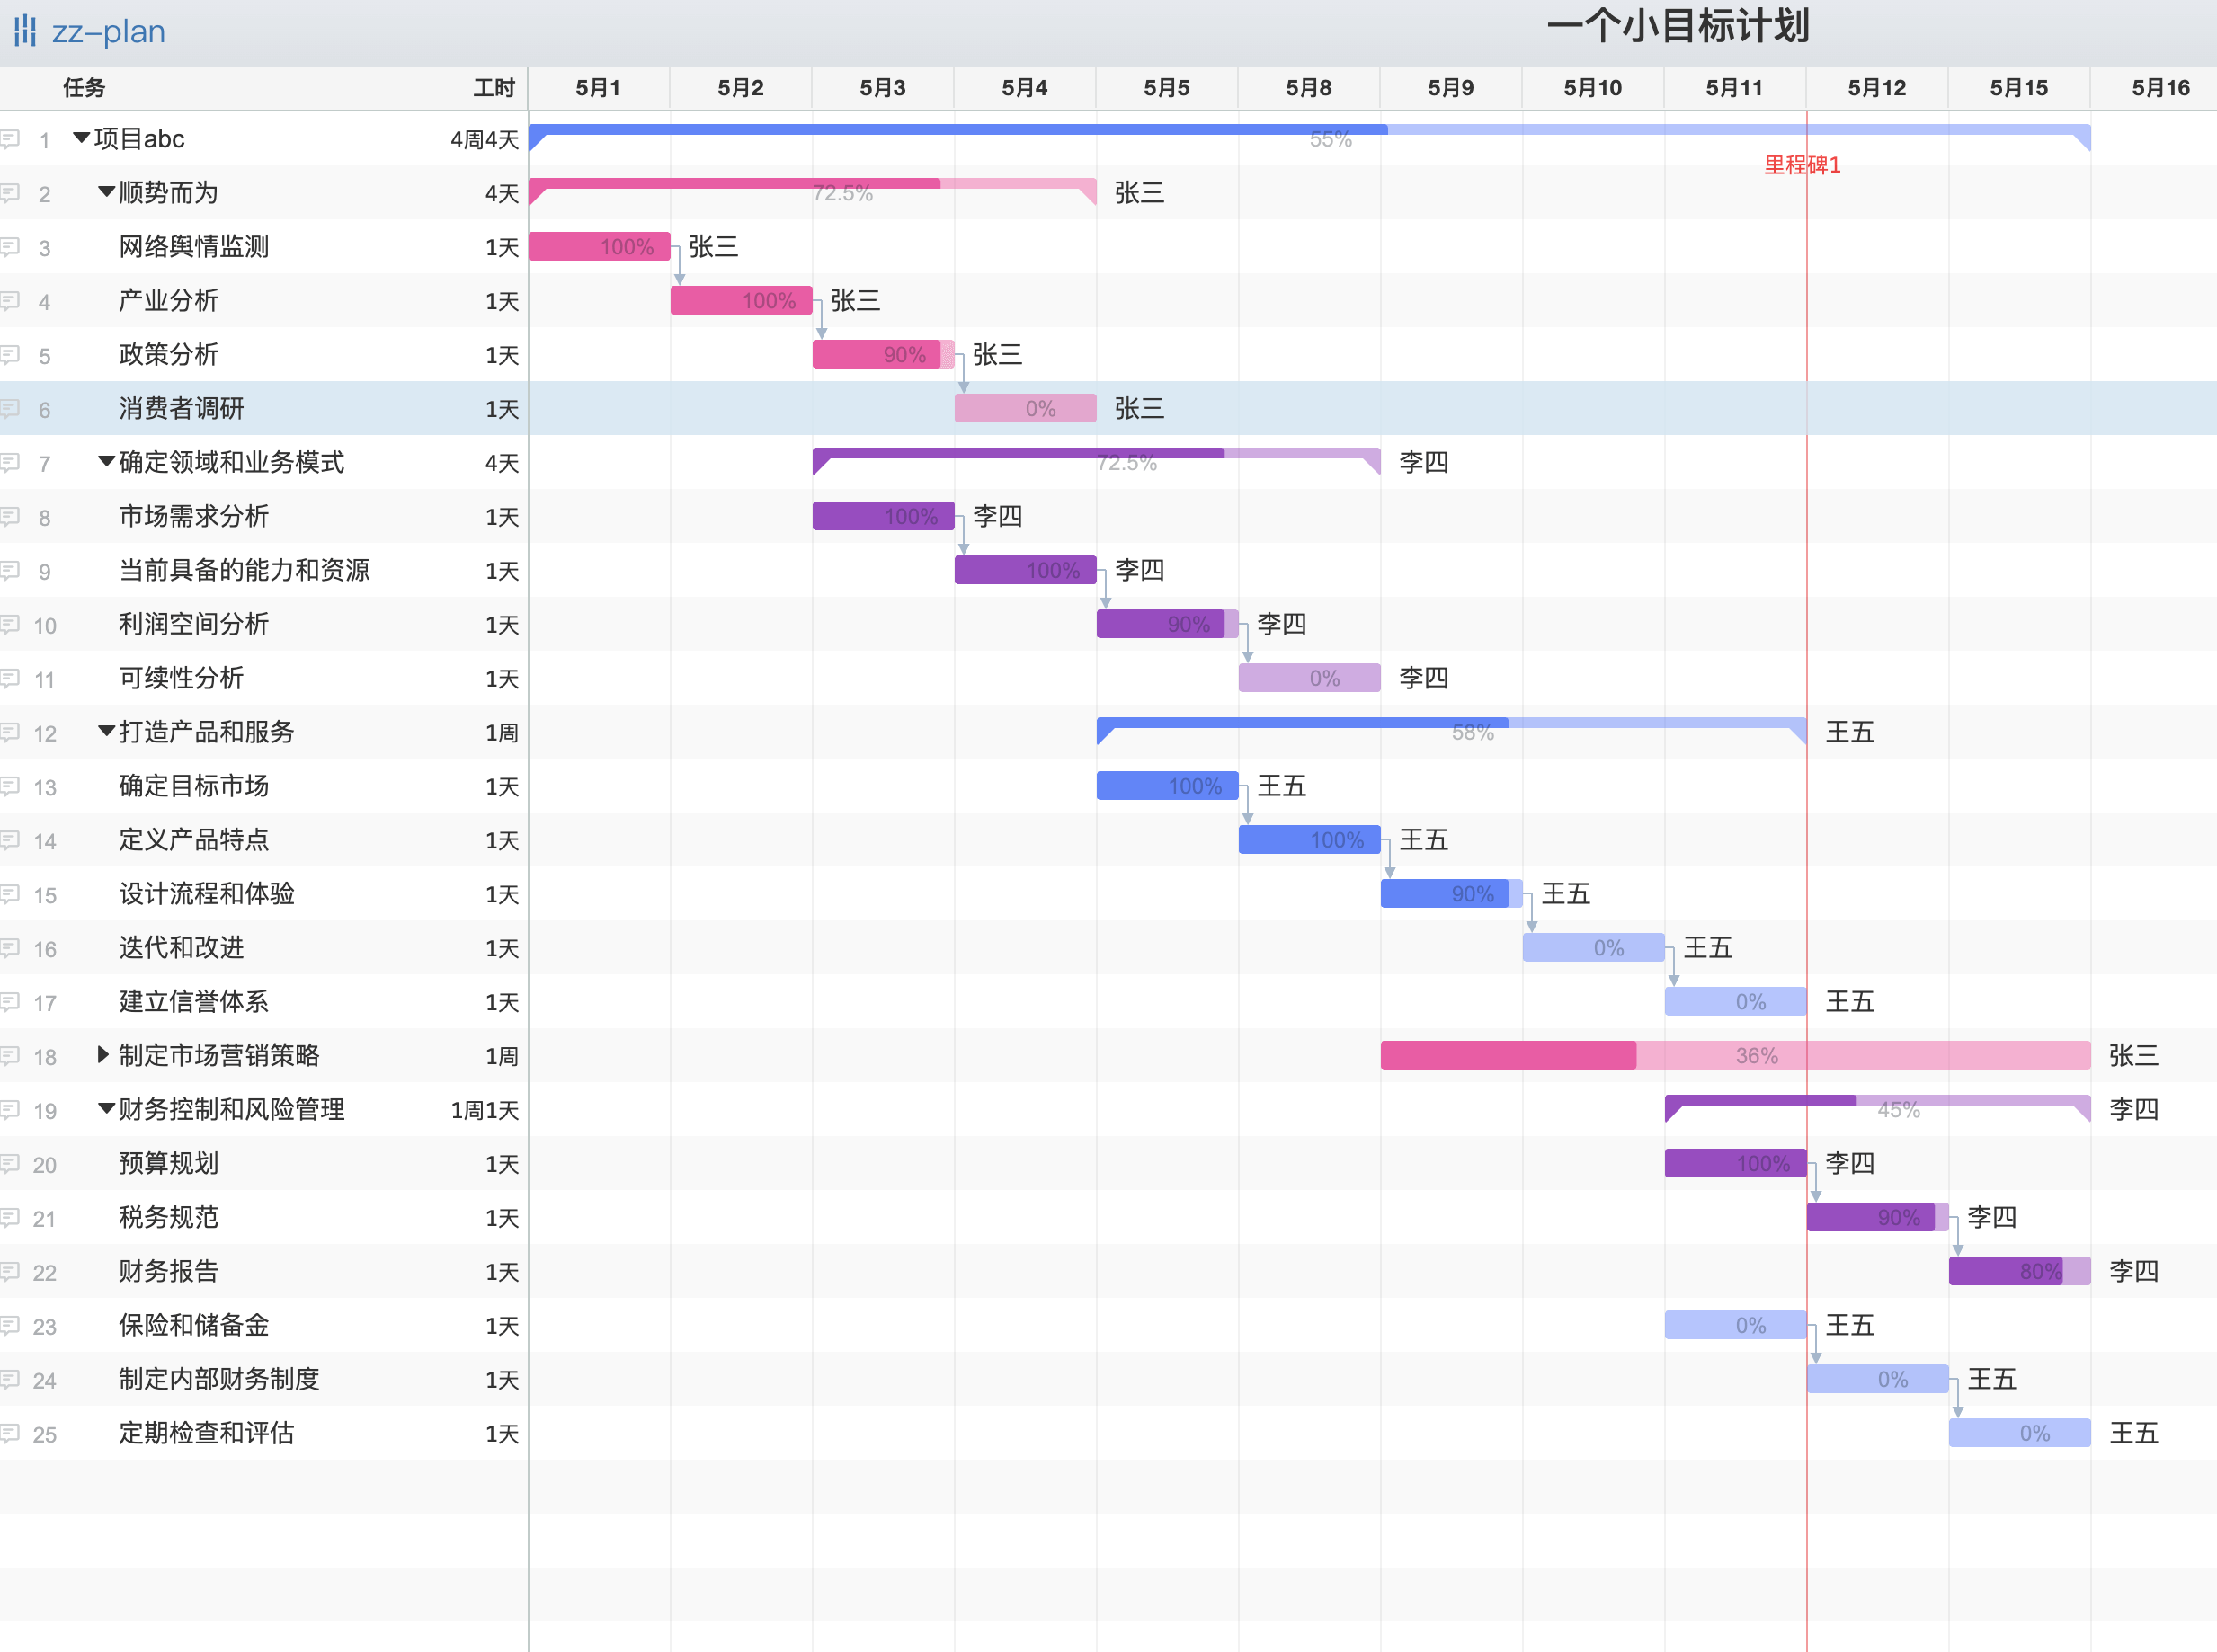
项目在Vue-Gantt-chart: 使用Vue做数据控制的Gantt图表基础上进行了改造。
有需要的小伙伴也可以直接引入插件,自己修改。
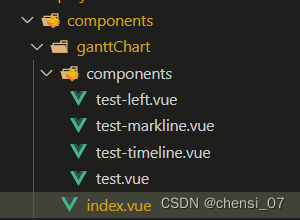
我是直接把甘特图封装成了组件,结构如下图:
首先,安装插件
npm install v-gantt-chart
引入插件(我是全局引入的)
import vGanttChart from 'v-gantt-chart';

Vue.use(vGanttChart);
代码如下:
index.js
<template>
  <div class="container">
    <v-gantt-chart
      :startTime="times[0]"
      :endTime="times[1]"
      :cellWidth="cellWidth"
      :cellHeight="cellHeight"
      :timeLines="timeLines"
      :titleHeight="titleHeight"
      :scale="Number(1440 * scale)"
      :titleWidth="titleWidth"
      showCurrentTime
      :hideHeader="hideHeader"
      :dataKey="dataKey"
      :arrayKeys="arrayKeys"
      :scrollToTime="scrollToTime"
      :scrollToPostion="positionA"
      @scrollLeft="scrollLeftA"
      customGenerateBlocks
      :datas="ganttData"
    >
      <template
        v-slot:block="{
          data,
          getPositonOffset,
          getWidthAbout2Times,
          isInRenderingTimeRange,
          startTimeOfRenderArea,
          endTimeOfRenderArea,
          isAcrossRenderingTimeRange
        }"
      >
        <div
          class="gantt-block-item"
          v-for="(item, index) in data.gtArray"
          v-if="
            isInRenderingTimeRange(item.start) ||
            isInRenderingTimeRange(item.end) ||
            isAcrossRenderingTimeRange(item.start, item.end)
          "
          :key="item.id"
          :style="{
            left: getPositonOffset(item.start) + 'px',
            width: getWidthAbout2Times(item.start, item.end) + 'px',
            height: judgeTime(data.gtArray) ? '50%' : '100%',
            top: !judgeTime(data.gtArray)
              ? ''
              : index % 2 !== 1
              ? '0px'
              : '22px'
          }"
        >
          <Test
            :data="data"
            :updateTimeLines="updateTimeLines"
            :cellHeight="cellHeight"
            :currentTime="currentTime"
            :item="item"
            @nodeEvent="nodeEvent"
          ></Test>
        </div>
      </template>
      <template v-slot:left="{ data }">
        <TestLeft :data="data" @panelDb="panelDb"></TestLeft>
      </template>
      <!-- <template v-slot:timeline="{ day , getTimeScales }">
          <TestTimeline :day="day" :getTimeScales="getTimeScales"></TestTimeline>
        </template> -->
      <template v-slot:title>
        <div class="title">名称</div>
      </template>
    </v-gantt-chart>
  </div>
</template>

<script>
import moment from 'moment';
import Test from './components/test.vue';
import TestLeft from './components/test-left.vue';
import TestTimeline from './components/test-timeline.vue';
import TestMarkline from './components/test-markline.vue';

import dayjs from 'dayjs';

export default {
  name: '',
  components: { Test, TestLeft, TestTimeline, TestMarkline },
  props: {
    ganttData: {
      type: Array,
      default: () => []
    },
    scaleData: {
      type: Number,
      default: 10080
    },
    scrollToTime: {
      type: String,
      default: moment().subtract(4, 'days').format('YYYY-MM-DD')
    }
  },

  data() {
    return {
      timeLines: [],
      currentTime: dayjs(),
      cellWidth: 100,
      cellHeight: 50,
      titleHeight: 50,
      titleWidth: 250,
      // scale: 1440 * 30,
      startDate: moment().startOf('year'),
      endDate: moment().endOf('year'),
      times: [
        moment().subtract(1, 'year').format('YYYY-MM-DD hh:mm:ss'),
        moment().add(6, 'months').format('YYYY-MM-DD hh:mm:ss')
      ],
      rowNum: 100,
      colNum: 10,
      datasB: [],
      dataKey: 'projectId',
      // scrollToTime: moment().subtract(14, 'days').format('YYYY-MM-DD'),
      // scrollToTime: moment().subtract(4, 'days').format('YYYY-MM-DD'),
      scrollToPostion: { x: 10000, y: 10000 },
      hideHeader: false,
      hideSecondGantt: false,
      arrayKeys: ['gtArray'],
      scrollToY: 0,
      positionB: {},
      positionA: {}
    };
  },
  watch: {
    scrollToY(val) {
      this.positionA = { x: val };
    },
    ganttData(newVal, oldVal) {
      console.log('newVal===', newVal);
      console.log('oldVal===', oldVal);
    }
  },
  computed: {
    scale() {
      console.log(this.scaleData);
      return this.scaleData / 1440;
    }
  },
  methods: {
    judgeTime(arr) {
      let startTimeArr = [];
      let endTimeArr = [];
      arr.map(function (item) {
        startTimeArr.push(
          item.startDate ? new Date(item.startDate).getTime() : ''
        );
        endTimeArr.push(
          item.delayDate
            ? new Date(item.delayDate).getTime()
            : item.endDate
            ? new Date(item.endDate).getTime()
            : ''
        );
      });
      let allStartTime = startTimeArr.sort(); // 排序
      let allEndTime = endTimeArr.sort();
      let result = 0; // 判断时间是否有重复区间
      for (let k = 0; k < allStartTime.length; k++) {
        if (k > 0) {
          if (allStartTime[k] <= allEndTime[k - 1]) {
            result += 1;
          }
        }
      }
      return result > 0;
    },
    nodeEvent(item) {
      this.$emit('nodeEventClick', item);
    },
    panelDb(item) {
      this.$emit('panelDbClick', item);
    },
    updateTimeLines(timeA, timeB) {
      this.timeLines = [
        {
          time: timeA,
          text: '自定义'
        },
        {
          time: timeB,
          text: '测试',
          color: '#747e80'
        }
      ];
    },
    scrollLeftA(val) {
      this.positionB = { x: val };
    }
  }
};
</script>

<style lang="scss" scoped>
.container {
  height: 82vh;
  background-color: #f5faff;
}
.title {
  width: 100%;
  height: 100%;
  color: #96aaca;
  background: #f5faff;
}
:deep(.gantt-leftbar-wrapper) {
  border-right: 1px solid #c6d8ee !important;
}
</style>
test-left.vue
<template>
  <div class="name">
    <div class="carId" @dblclick="onDblclick" >{{ data.projectName }}</div>
  </div>
</template>

<script>
export default {
  name: "TestLeft",
  props: {
    data: Object,
  },
  methods: {
    onDblclick() {
      // this.updateTimeLines(this.item.start, this.item.end);
      this.$emit('panelDb', this.data);
    }
  }
};
</script>

<style scoped>
.name {
  color: #000000;
  display: flex;
  box-sizing: border-box;
  overflow: hidden;
  height: 100%;
  width: 100%;
  padding: 10px 0;
  align-items: center;
  text-align: center;
  background: #f5faff;
  box-shadow: 2px 0px 4px 0px rgba(0, 0, 0, 0.1);
}

.carId {
  flex: 1;
}

.type {
  padding: 0 5px 0 0;
  font-size: 1.2rem;
}
</style>
test-markline.vue
<template>
  <div
    class="markline"
    :style="{  left: getPosition() + 'px' }"
  >
    <div class="markline-label">
      {{timeConfig.text}}{{ dayjs(timeConfig.time).format("HH:mm:ss") }}
    </div>
  </div>
</template>

<script>
import dayjs from "dayjs"
export default {
  name: "TestMarkLine",
	props:['getPosition','timeConfig'],
	data(){
		return {
			dayjs
		}
	}
}
</script>

<style lang="scss" scoped>

.markline {
    position: absolute;
    z-index: 100;
    width: 2px;
    height: 100vh;
    background: #747e80;

    &-label {
      padding: 3px;
      width: 6rem;
      margin-left: -3rem;
      margin-top: 5rem;
      color: #fff;
      background: #747e80;
      text-align: center;
      border-radius: 5px;
      font-size: 0.7rem;
    }
}
</style>
test-timeline.vue
<template>
 <div class="test">
  <span v-for="i in getTimeScales(day)"> {{i.format('HH:mm')}}</span>
 </div>
</template>

<script>
export default {
  name: "TestLeft",
  props: {
    day: Object,
    getTimeScales:Function,
  }
};
</script>

<style lang="scss" scoped>
.test{
  display: flex;

  span{
    flex:1
  }
}
</style>
test.vue
<template>
  <el-popover placement="bottom" trigger="hover">
    <div
      slot="reference"
      class="plan"
      :style="{
        'background-color': statusColor,
        'margin-top': 0.1 * cellHeight + 'px'
      }"
      @click="onClick"
    >
      <div class="middle">{{ item.summary }}</div>
    </div>

    <div class="detail">{{ item.summary }}</div>
  </el-popover>
</template>

<script>
import dayjs from 'dayjs';
export default {
  name: 'Test',
  props: {
    data: Object,
    item: Object,
    currentTime: dayjs,
    updateTimeLines: Function,
    cellHeight: Number,
    startTimeOfRenderArea: Number
  },
  data() {
    return {
      dayjs: dayjs,
      stateObj: {
        DelayStart: '#F56C6C',
        Normal: '#C2F1E2',
        NoStart: '#D9E3ED',
        Delay: '#F56C6C',
        Stop: '#D9E3ED',
        DelayRisk: '#FFD4C7',
        NoControl: '#F56C6C',
        Close: '#D9E3ED'
      }
    };
  },
  computed: {
    statusColor() {
      console.log('data=======', this.data);
      let { item } = this;

      return this.stateObj[item.state] || '#D9E3ED';
    },
    startToString() {
      return dayjs(this.item.start).format('HH:mm');
    },
    endToString() {
      return dayjs(this.item.end).format('HH:mm');
    }
  },
  methods: {
    onClick() {
      // this.updateTimeLines(this.item.start, this.item.end);
      this.$emit('nodeEvent', this.item);
    }
  }
};
</script>

<style lang="scss" scoped>
.middle {
  flex: 1;
  text-align: center;
  padding-left: 5px;
  text-overflow: ellipsis;  /* ellipsis:显示省略符号来代表被修剪的文本  string:使用给定的字符串来代表被修剪的文本*/
  white-space: nowrap;   /* nowrap:规定段落中的文本不进行换行   */
  overflow: hidden; /*超出部分隐藏*/
}
.runTime {
  display: flex;
  flex-direction: column;
}
.plan {
  display: flex;
  align-items: center;
  box-sizing: border-box;
  height: 80%;
  border: 1px solid #f0f0f0;
  border-radius: 5px;
  color: #333333;
  padding-left: 5px;
  font-size: 0.8rem;
  // opacity: 0.8;
}

.detail {
  .header {
    text-align: center;
    font-size: 1rem;
  }
}

.detail ul {
  list-style: none;
  padding: 0px;
  li {
    span {
      display: inline-block;
      width: 80px;
      color: #777;
      font-size: 0.8rem;
    }
    span:first-child {
      text-align: right;
    }

    span:last-child {
    }
  }
}
</style>
页面中使用
<div>
    <ganttChart
      :ganttData="ganttArr"
      :scaleData="scaleData"
      :scrollToTime="scrollToTime"
      @nodeEventClick="nodeEventClick"
      @panelDbClick="panelDbClick"
     ></ganttChart>
</div>
import moment from 'moment';
import ganttChart from './components/ganttChart/index.vue';
export default {
components: { ganttChart },
data(){
return{
ganttArr: [],
scaleData: 10080,
scrollToTime: moment().subtract(4, 'days').format('YYYY-MM-DD'),
}
},
methods: {
// 点击甘特图node节点
nodeEventClick(item) {
// 执行自己的逻辑
},
// 双击甘特图左侧标题
panelDbClick(item) {
//执行自己的逻辑
}
}
}以上就是实现甘特图的全部过程,欢迎大佬们指教。