一、下载插件包
下载地址如下:
lime-echart: 百度图表 echarts,uniapp、taro 使用 echarts 图表,全面兼容各平台小程序、H5、APP、Nvue
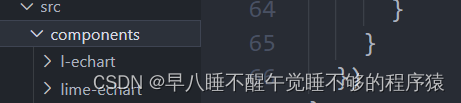
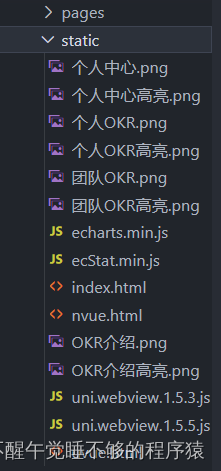
将以下两个文件夹放到项目的components里

同样地,将静态资源文件夹下内容放到自己项目的static文件夹下

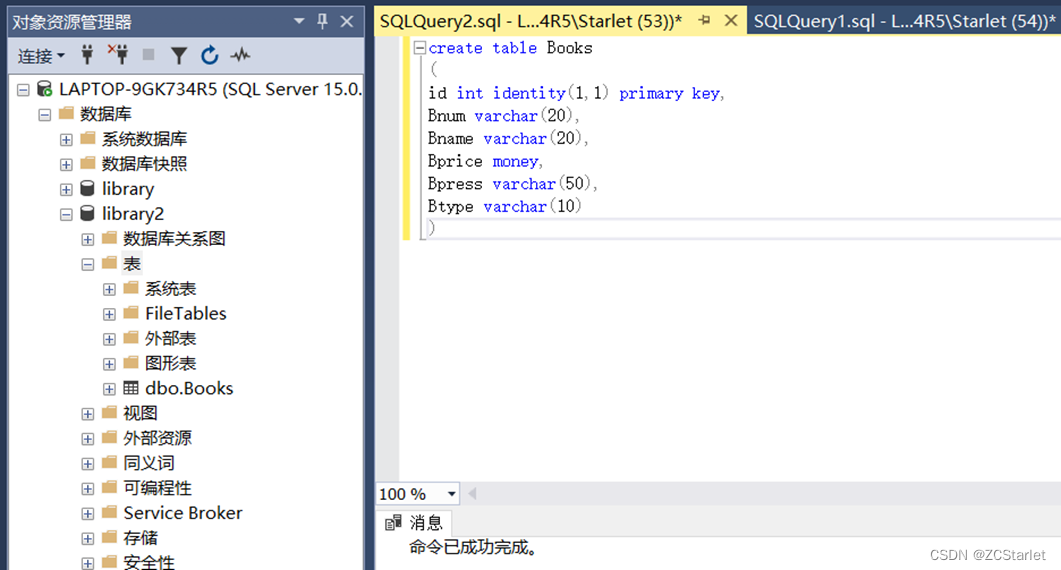
二、安装Echarts包
pnpm add echarts
或者
npm install echarts
三、在页面中导入依赖并运行
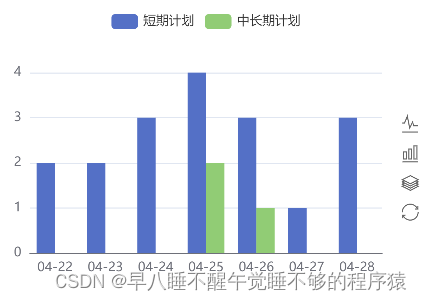
下面是一个图表的代码示例,在微信开发者工具中运行代码就可以看到效果啦
<template>
  <view>
    <view class="title">我的主页</view>
    <view>
      <LEchart class="echart" ref="chart" @finished="init"></LEchart>
    </view>
  </view>
</template>

<script setup>
import LEchart from '@/components/l-echart/l-echart.vue'
// lime-echart是一个demo的组件,用于测试组件
// import LEchart from '@/components/lime-echart/lime-echart.vue'
import { onMounted, reactive, ref } from "vue"
// nvue 不需要引入
// #ifdef VUE3
// #ifdef MP
// 由于vue3 使用vite 不支持umd格式的包,小程序依然可以使用,但需要使用require
const echarts = require('../../static/echarts.min');
// #endif
// #ifndef MP
// 由于 vue3 使用vite 不支持umd格式的包,故引入npm的包
import * as echarts from 'echarts';
// #endif
// #endif


let chart = ref(); // 获取dom
const state = reactive({
  option: {},
})
state.option = {
  legend: {
    show: true,
    data: []
  },
  tooltip: {
    trigger: 'axis',
    axisPointer: {
      type: 'cross'
    }
  },
  grid: {
    left: '3%',
    right: '8%',
    top: '15%',
    bottom: '5%',
    containLabel: true
  },
  xAxis: {
    type: 'category',
    data: [1, 2, 3, 4, 5, 6, 7, 8, 9, 10, 11, 12, 13, 1, 4, 15, 16, 17, 18, 19, 20, 21, 22, 23, 24],
    axisLabel: {
      // inside: true,
      // color: '#fff'
    },
    axisTick: {
      show: false
    },
    axisLine: {
      show: true,
      lineStyle: {
        color: '#83bff6'
      }
    },
    z: 10
  },
  yAxis: {
    type: 'value',
    axisLine: {
      show: true,
      lineStyle: {
        color: '#83bff6'
      }
    },
    axisTick: {
      show: false
    },
    // axisLabel: {
    //   color: '#999'
    // },
    splitLine: {
      show: true,
      lineStyle: {
        type: 'dashed',
        color: '#83bff6'
      }
    }
  },
  series: [
    {
      data: [100, 110, 113, 126, 143, 158, 165, 167, 152, 102, ,],
      type: "bar",
      itemStyle: {
        color: new echarts.graphic.LinearGradient(0, 0, 0, 1, [
          { offset: 0, color: '#83bff6' },
          { offset: 0.5, color: '#188df0' },
          { offset: 1, color: '#188df0' }
        ])
      },
      emphasis: {
        itemStyle: {
          color: new echarts.graphic.LinearGradient(0, 0, 0, 1, [
            { offset: 0, color: '#2378f7' },
            { offset: 0.7, color: '#2378f7' },
            { offset: 1, color: '#83bff6' }
          ])
        }
      },
      areaStyle: {
        show: true,
        color: new echarts.graphic.LinearGradient(0, 0, 0, 1, [
          {
            offset: 0,
            color: '#188df0'
          },
          {
            offset: 1,
            color: '#fff'
          }
        ])
      },
    }
  ],
  color: ['#83bff6']
}
// 组件能被调用必须是组件的节点已经被渲染到页面上
onMounted(() => {
  chart.value.init(echarts, chart => {
    chart.setOption(state.option);
  });
})

// 渲染完成
const init = () => {
  console.log("渲染完成");
}
</script>

<style scopedlang='scss' scoped>
.echart {
  width: 100%;
  height: 300px;
}

.title {
  text-align: center;
}
</style>
四、使用Echarts的其他图表
打开Echarts官网:Examples - Apache ECharts
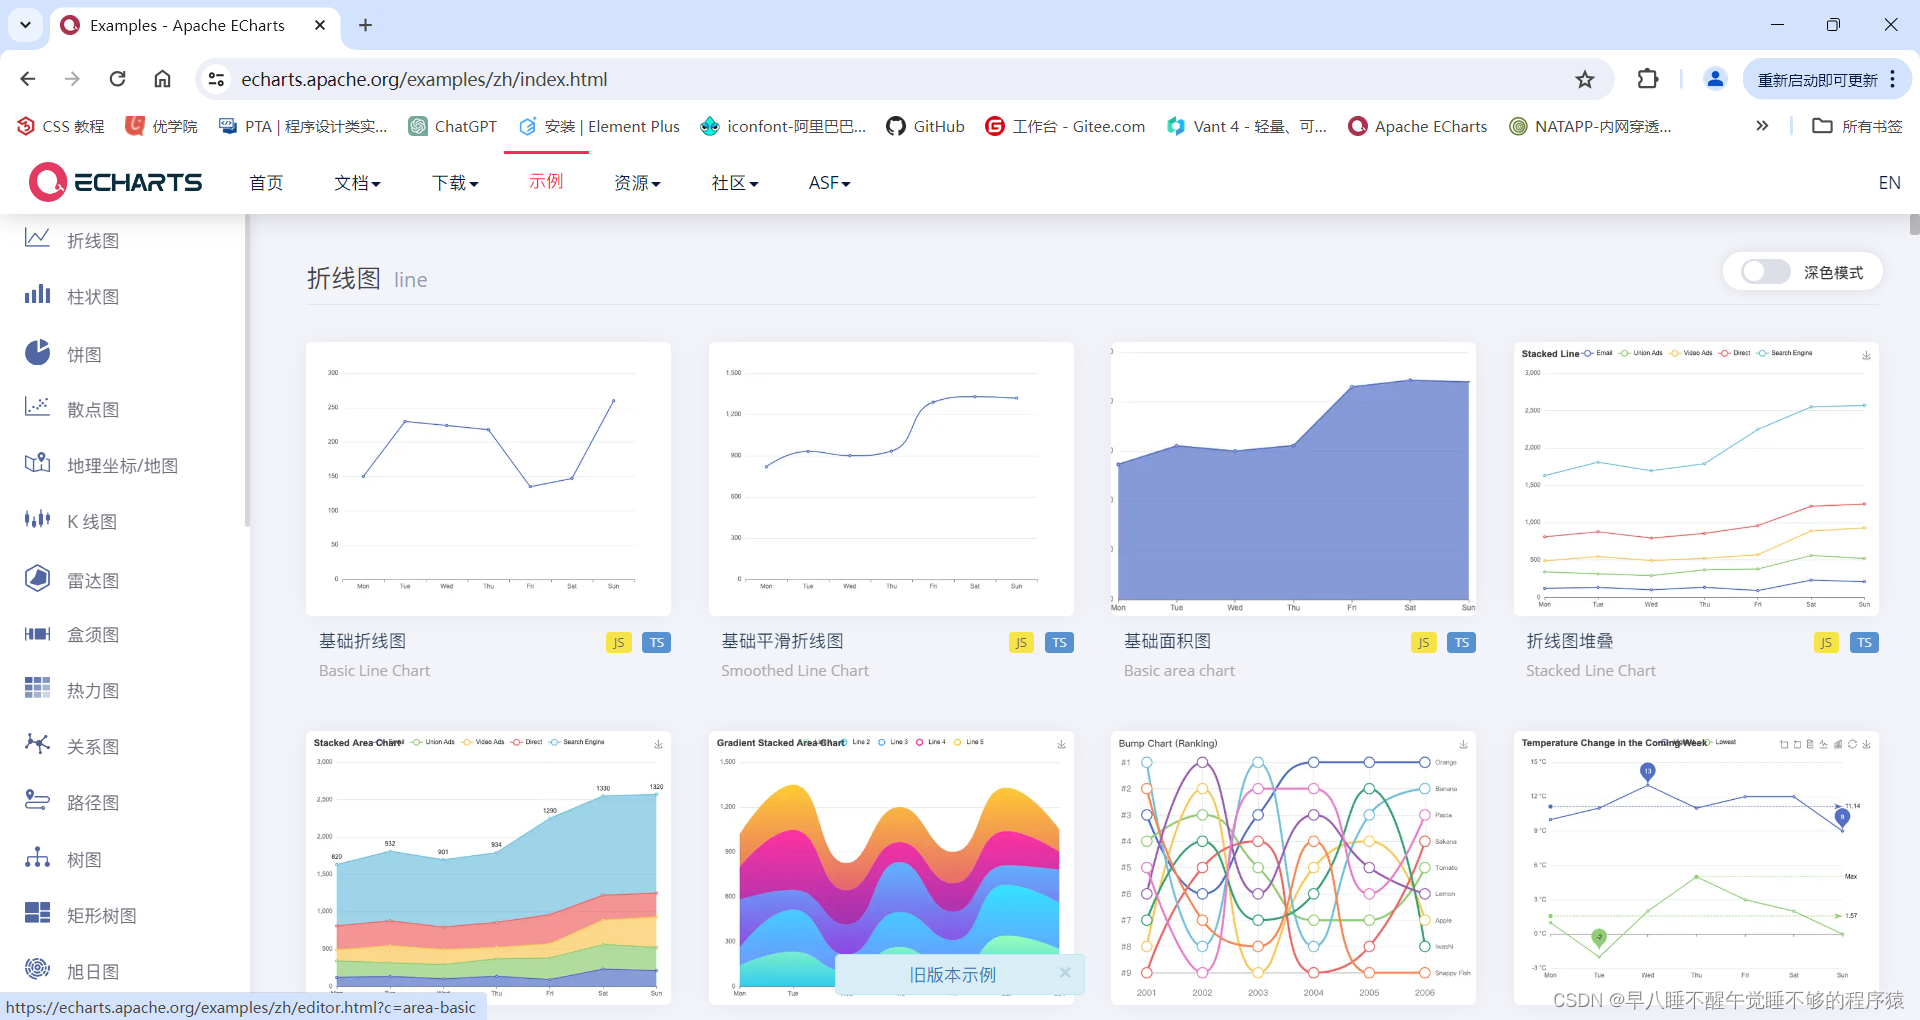
选择自己想要使用的图表,这里以折线图为例
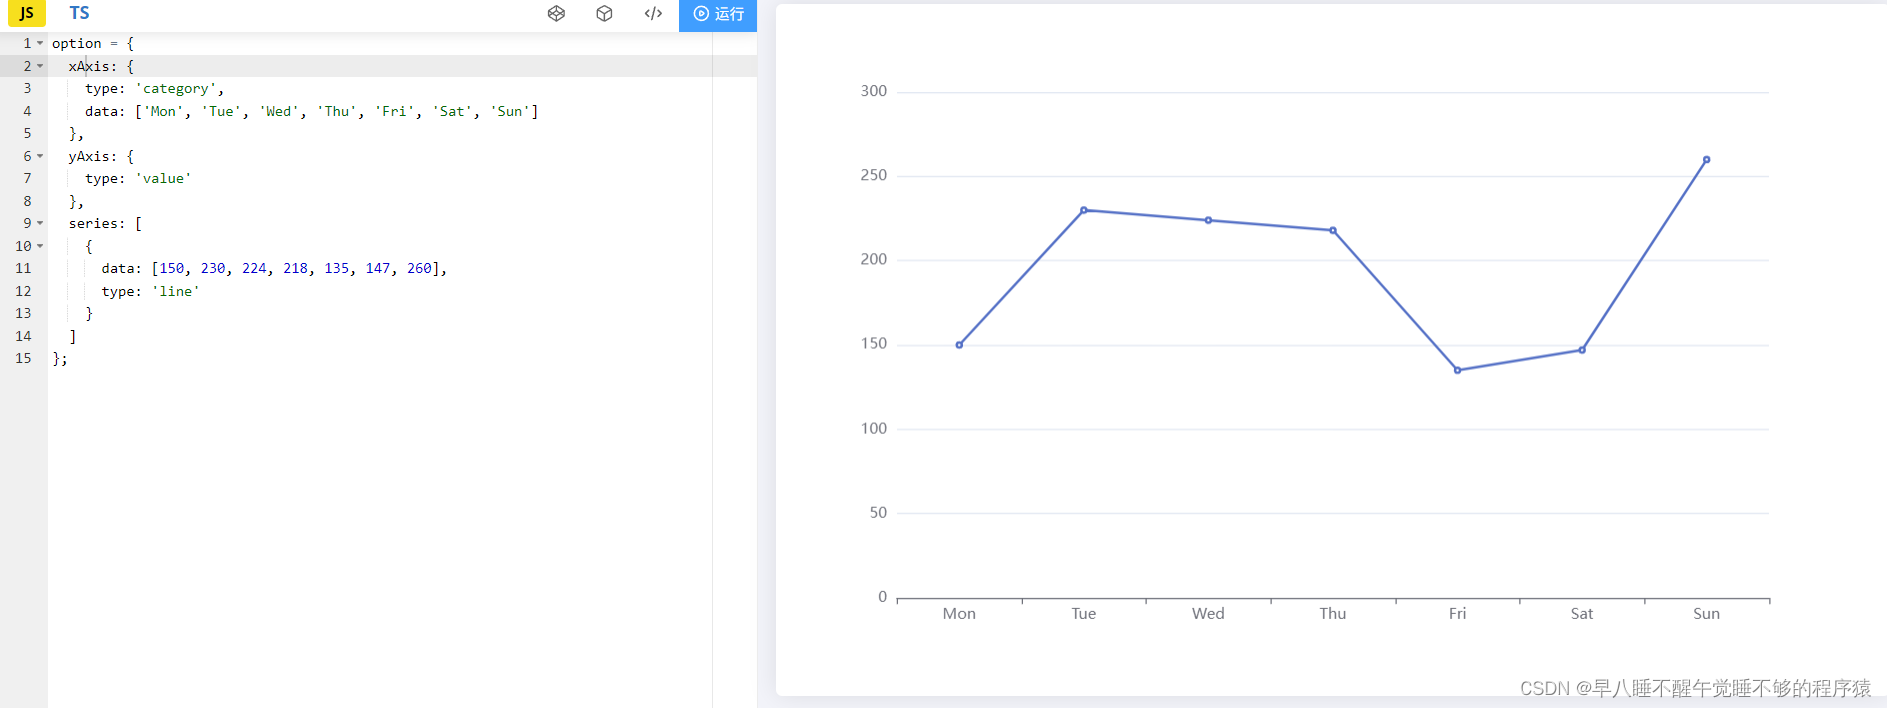
把左侧的option中的代码复制下来,替换掉上面给出的代码示例中option中的代码即可