背景
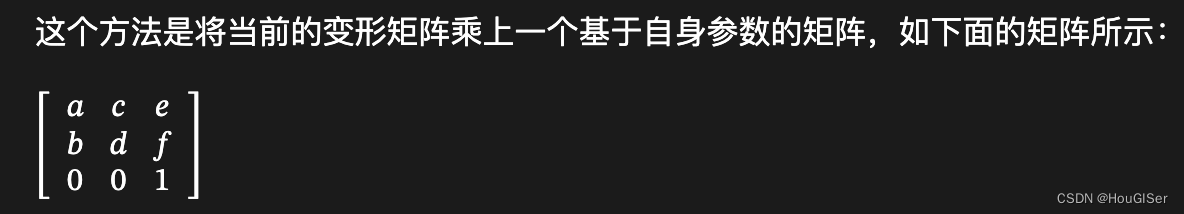
标注的几何,有时需要一些定制化的渲染样式,例如,线中间展示箭头,表示方向。本期教程教大家如何实现fabric几何定制化渲染。
带箭头的线
fabric提供了一些原生的几何,例如Point、Polyline、Polygon。同时提供了一些抽象的实体,如Object、Path。
如果使用原生的几何,可配置的样式是有限的。
比如Point的配置是:
{
    radius: 5,
    stroke: 'rgba(0,0,0,1)',
    strokeWidth: 2,
    fill: 'rgba(255,0,0,1)'
}
Polyline的配置是:
{
    stroke: 'rgba(0,0,0,1)',
    strokeWidth: 5
}
Polygon的配置是:
{
    fill: 'rgba(255,0,0,0,3)',
    strokeWidth: 1
}
可见这些线宽、线颜色、填充色等并不能实现箭头样式,需要对这些类进行扩展。
fabric提供了方法,可以扩展原生几何,代码如下:
export const NewPolyline = fabric.util.createClass(fabric.Polyline, {
  type: 'NewPolyline',

  initialize: function (points: any = [], options: any = {}) {
    this.callSuper('initialize', points, { ...options }); // 调用Polyline的初始化方法
  },

  _render: function (ctx: any) {
    // 自定义渲染,每次canvas.renderAll()都会触发该方法。
    this.callSuper('_render', ctx);
  }
}
此时我们得到了一个新的fabric几何类型:NewPolyline。其初始化参数和Polyline一致,points是点序,options里设置其样式。
而箭头样式,需要在_render方法里实现。_render方法可以拿到ctx,即canvas的实例,我们可以利用ctx进行各种绘制操作。
注意:在_render这个步骤,每个几何都有自己的坐标系,其坐标系原点是几何的外接矩形的中心点。
因此,我们每个坐标都需要减去当前几何的width/2和height/2,进行原点平移。
举个例子,比如我们有一条线,其参数如下:
{
    left: 10,
    top: 10,
    points: [{x: 0, y: 0}, {x: 5, y: 0}, {x: 5, y: 5}],
}
在坐标系中,如图,
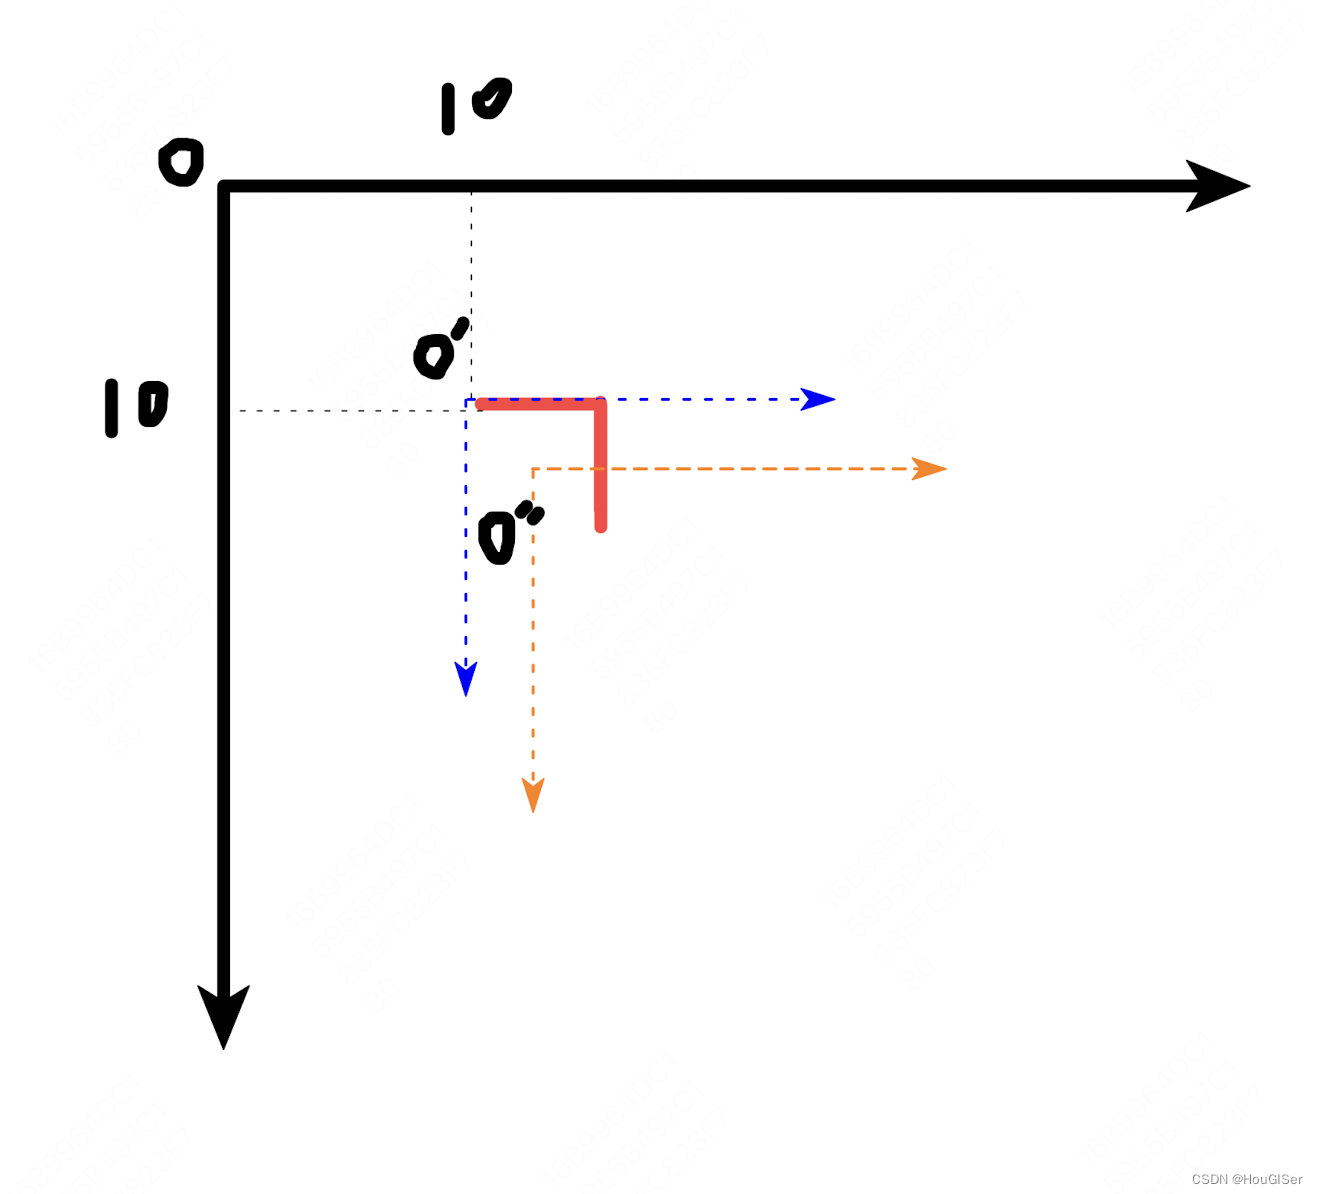
left和top将要素的坐标系从O移动到了O',在此基础上,绘制折线[[0,0],[5,0],[5,5]]。
在渲染时,fabric又将坐标原点O'平移到外接矩形的中心点O''。
知道坐标系后,我们先来求线段的中点:
const points = this.get('points');
const width = this.get('width');
const height = this.get('height');
for (let i = 0; i < points.length; i++) {
const midX = (points[i].x + points[i + 1].x) / 2 - width / 2;
const midY = (points[i].y + points[i + 1].y) / 2 - height / 2;
console.log(midX, midY);
}
// 结果:
// -2.5, -2.5
// 2.5, -2.5
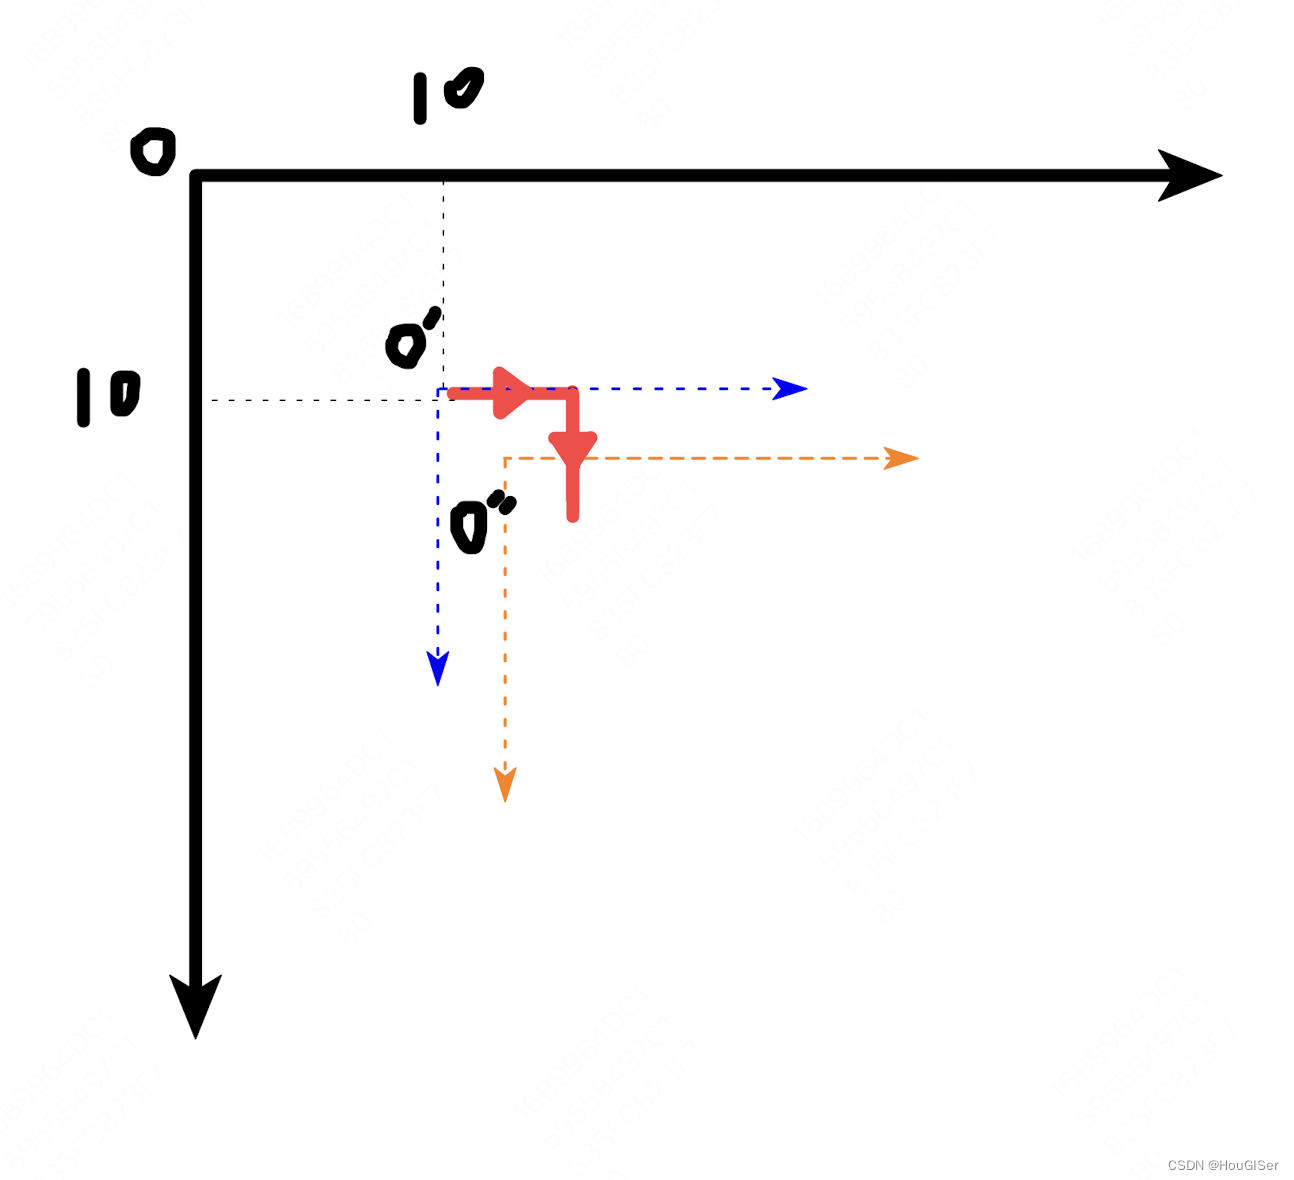
// 2.5, 2.5看懂上面的代码,你就可以以线段中心点为中心,画沿着线段的三角形了,代码如下:
for (let i = 0; i < points.length - 1; i++) {
      const midX = (points[i].x + points[i + 1].x) / 2 - width / 2;
      const midY = (points[i].y + points[i + 1].y) / 2 - height / 2;
      const rotate = Math.atan2(points[i + 1].y - points[i].y, points[i + 1].x - points[i].x);
      ctx.moveTo(midX, midY);
      const firstX = midX - (arrowWidth / 2) * Math.sin(rotate);
      const firstY = midY + (arrowWidth / 2) * Math.cos(rotate);
      ctx.lineTo(firstX, firstY);
      const secondX = midX + (arrowWidth / 2) * Math.sqrt(3) * Math.cos(rotate);
      const secondY = midY + (arrowWidth / 2) * Math.sqrt(3) * Math.sin(rotate);
      ctx.lineTo(secondX, secondY);
      const thirdX = midX + (arrowWidth / 2) * Math.sin(rotate);
      const thirdY = midY - (arrowWidth / 2) * Math.cos(rotate);
      ctx.lineTo(thirdX, thirdY);
      ctx.closePath();
      ctx.fill();
 }
效果图如下:
了解这个原理,你就可以利用canvas的绘制操作实现任何的自定义样式。
缩放控制线宽等宽
上一章我们讲到了,画布是可以拖拽和缩放的,本质上是修改canvas的transform。
在每次缩放后,canvas会调用renderAll方法,从而调用每个几何的_render方法。在_render内,我们需要重新计算strokeWidth:
const strokeWidth = 5;
const zoom = canvas.getZoom();
this.set({
    strokeWidth: strokeWidth / zoom
});
这样可以保证每次缩放后,线宽依然维持一个固定值。如果我们不修改线宽,则会被同样得缩放。
预告
下一章,我们详细聊一个极其隐蔽的问题:线居中渲染。