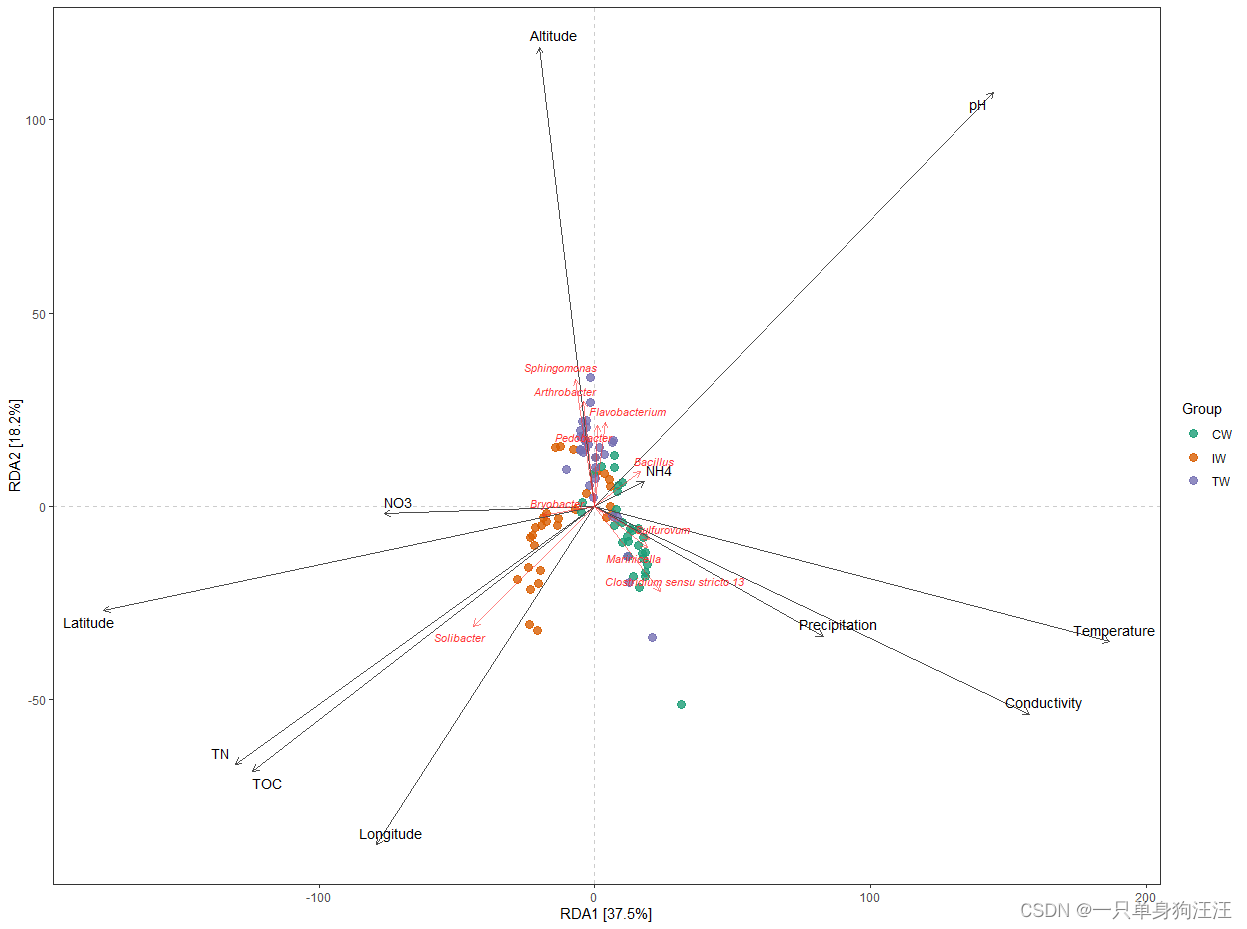
#环境变量在分析微生物群落结构和组装机制方面是非常有用的。我们首先展示RDA分析(db-RDA和RDA)。
> t1 <- trans_env$new(dataset = dataset, add_data = env_data_16S)
Env data is stored in object$data_env ...
> t1$cal_ordination(method = "RDA", use_measure = "bray")
No taxa_level provided; use Genus level automatically !
The original ordination result is stored in object$res_ordination ...
The R2 is stored in object$res_ordination_R2 ...
> t1$cal_ordination_envsquare()
Error: attempt to apply non-function
> t1$cal_ordination_envfit()
Result is stored in object$res_ordination_envfit ...
> t1$trans_ordination(adjust_arrow_length = TRUE, max_perc_env = 10)
The result list is stored in object$res_ordination_trans ...
> t1$plot_ordination(plot_color = "Group")
#Mantel检验可以检验环境变量与距离矩阵之间是否存在显著的相关关系。
> t1$cal_mantel(use_measure = "bray")
The result is stored in object$res_mantel ...
> t1$res_mantel
   by_group     Variables mantel type Correlation method Correlation coefficient p.value  p.adjusted Significance
1       All      Latitude mantel test            pearson              0.52010091   0.001 0.001375000           **
2       All     Longitude mantel test            pearson              0.37732601   0.001 0.001375000           **
3       All      Altitude mantel test            pearson              0.22102713   0.001 0.001375000           **
4       All   Temperature mantel test            pearson              0.45198101   0.001 0.001375000           **
5       All Precipitation mantel test            pearson              0.27905384   0.001 0.001375000           **
6       All           TOC mantel test            pearson              0.13000213   0.001 0.001375000           **
7       All           NH4 mantel test            pearson             -0.05538846   0.918 0.918000000
8       All           NO3 mantel test            pearson              0.06758353   0.044 0.048400000            *
9       All            pH mantel test            pearson              0.40853579   0.001 0.001375000           **
10      All  Conductivity mantel test            pearson              0.26425041   0.001 0.001375000           **
11      All            TN mantel test            pearson              0.13205237
0.002 0.002444444           **
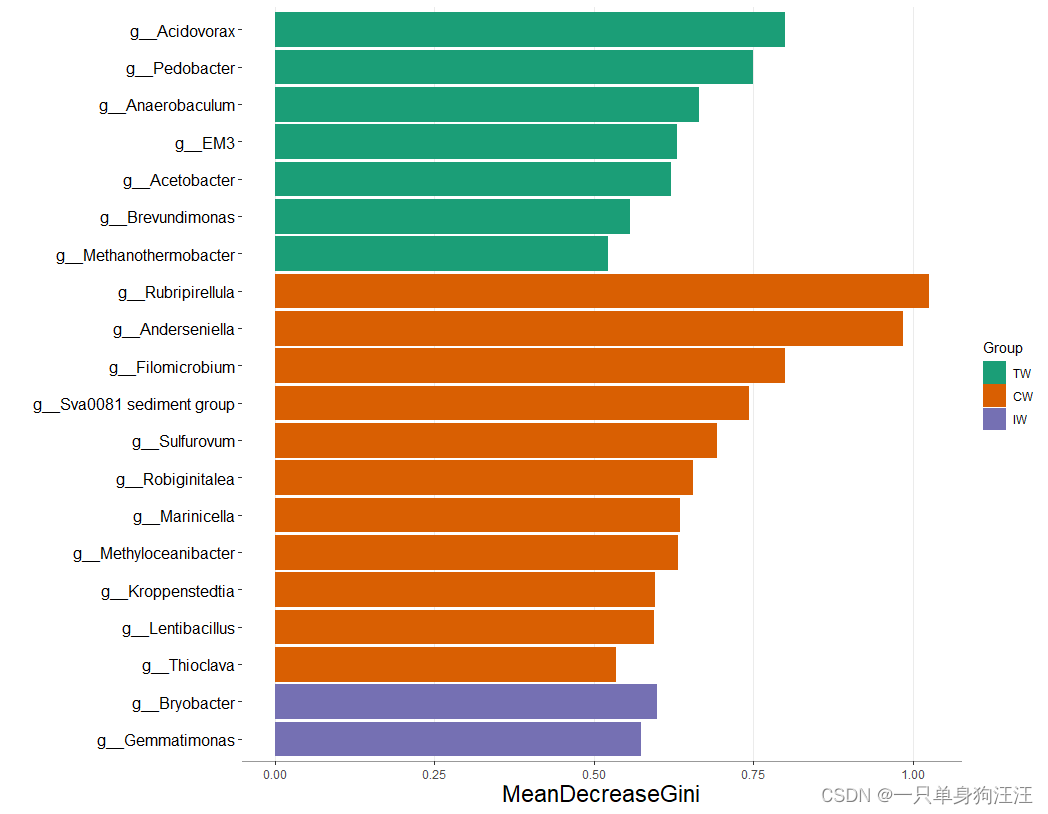
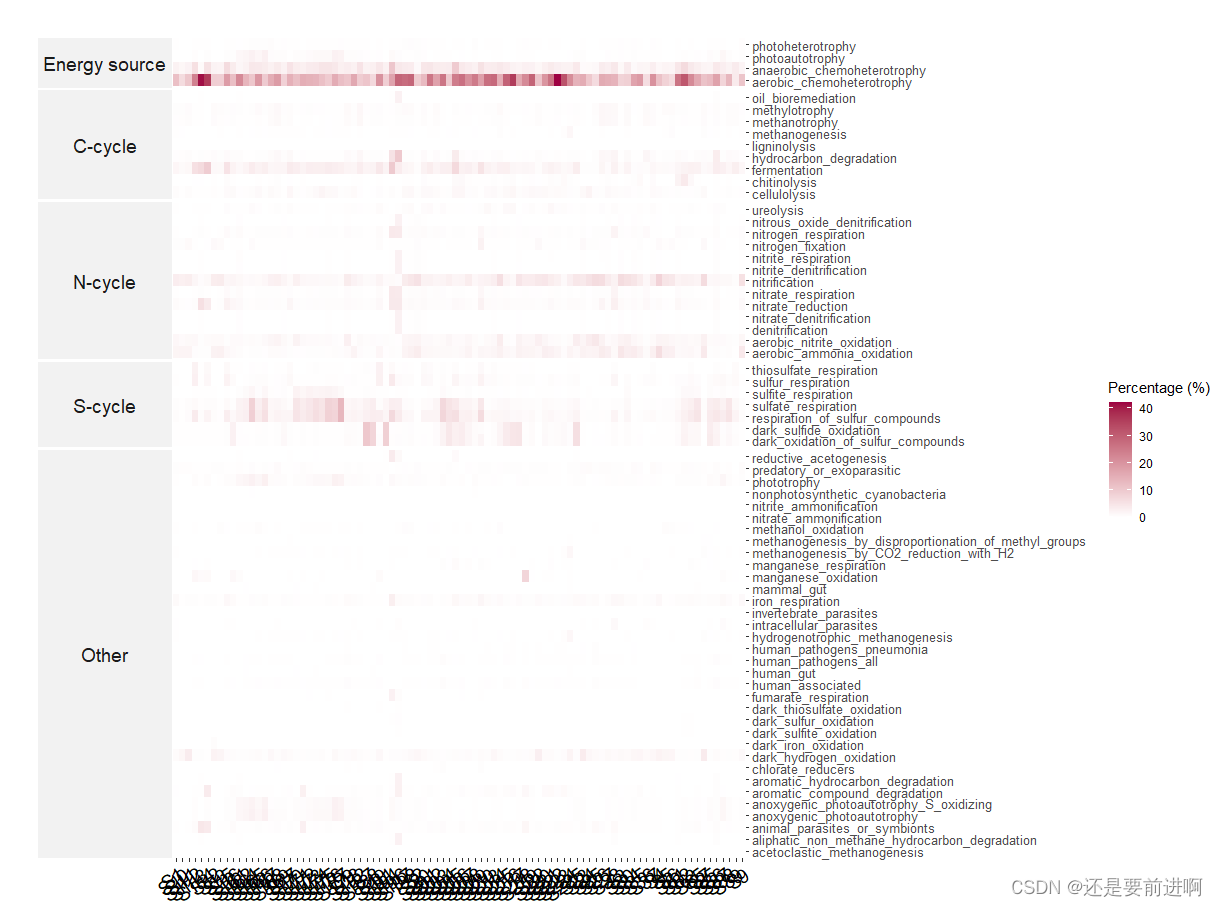
# 环境变量与分类群之间的相关性对分析和推断群落结构的影响因素具有重要意义。
# 在本例中,我们首先进行了差异丰度检验和随机森林分析,以获得重要属。然后利用这些分类群进行相关性分析。
> t2 <- trans_diff$new(dataset = dataset, method = "rf", group = "Group", rf_taxa_level = "Genus")
> t1 <- trans_env$new(dataset = dataset, add_data = env_data_16S[, 4:11])
> t1$cal_cor(use_data = "Genus", p_adjust_method = "fdr", other_taxa = t2$res_rf$Taxa[1:5])
> t1$plot_cor(pheatmap = FALSE)

图画的有些难看,这是临时跑的,大家有需求的话可以用自己的数据跑一下。没需求就跑着玩,熟悉一下就好。


![[游戏开发][UE5.3]GAS学习心得](https://img-blog.csdnimg.cn/direct/1989d3d78d84426893edc9178824af1a.png)


![[蓝桥杯练习题]Fizz Buzz经典问题](https://img-blog.csdnimg.cn/direct/b519c73817b043b98d4690686dd2b2d0.png)