1、找到xxx/utils/metrics.py
2、找到这个函数
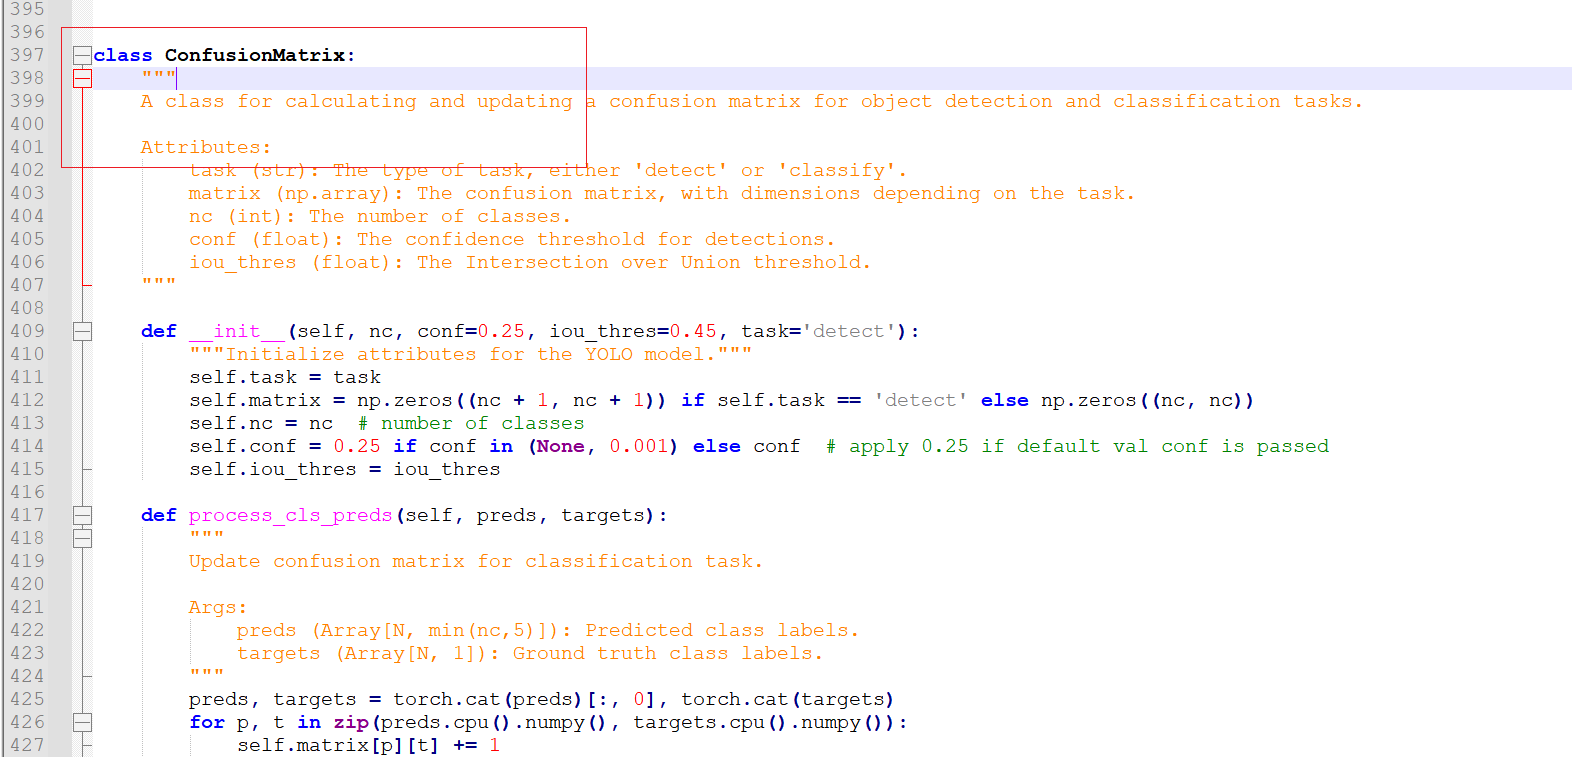
3、往下拉找到这里,自己对照改一下

import seaborn as sn
array = self.matrix / ((self.matrix.sum(0).reshape(1, -1) + 1E-9) if normalize else 1) # normalize columns
array[array < 0.005] = np.nan # don't annotate (would appear as 0.00)
fig, ax = plt.subplots(1, 1, figsize=(12, 9), tight_layout=True)
nc, nn = self.nc, len(names) # number of classes, names
sn.set(font_scale=2.0 if nc < 50 else 0.8) # for label size
labels = (0 < nn < 99) and (nn == nc) # apply names to ticklabels
ticklabels = (list(names) + ['background']) if labels else 'auto'
with warnings.catch_warnings():
warnings.simplefilter('ignore') # suppress empty matrix RuntimeWarning: All-NaN slice encountered
sn.heatmap(array,
ax=ax,
annot=nc < 30,
annot_kws={
'size': 20},
cmap='Blues',
fmt='.2f' if normalize else '.0f',
square=True,
vmin=0.0,
xticklabels=ticklabels,
yticklabels=ticklabels).set_facecolor((1, 1, 1))
plt.xticks(fontsize=15)
plt.yticks(fontsize=15)
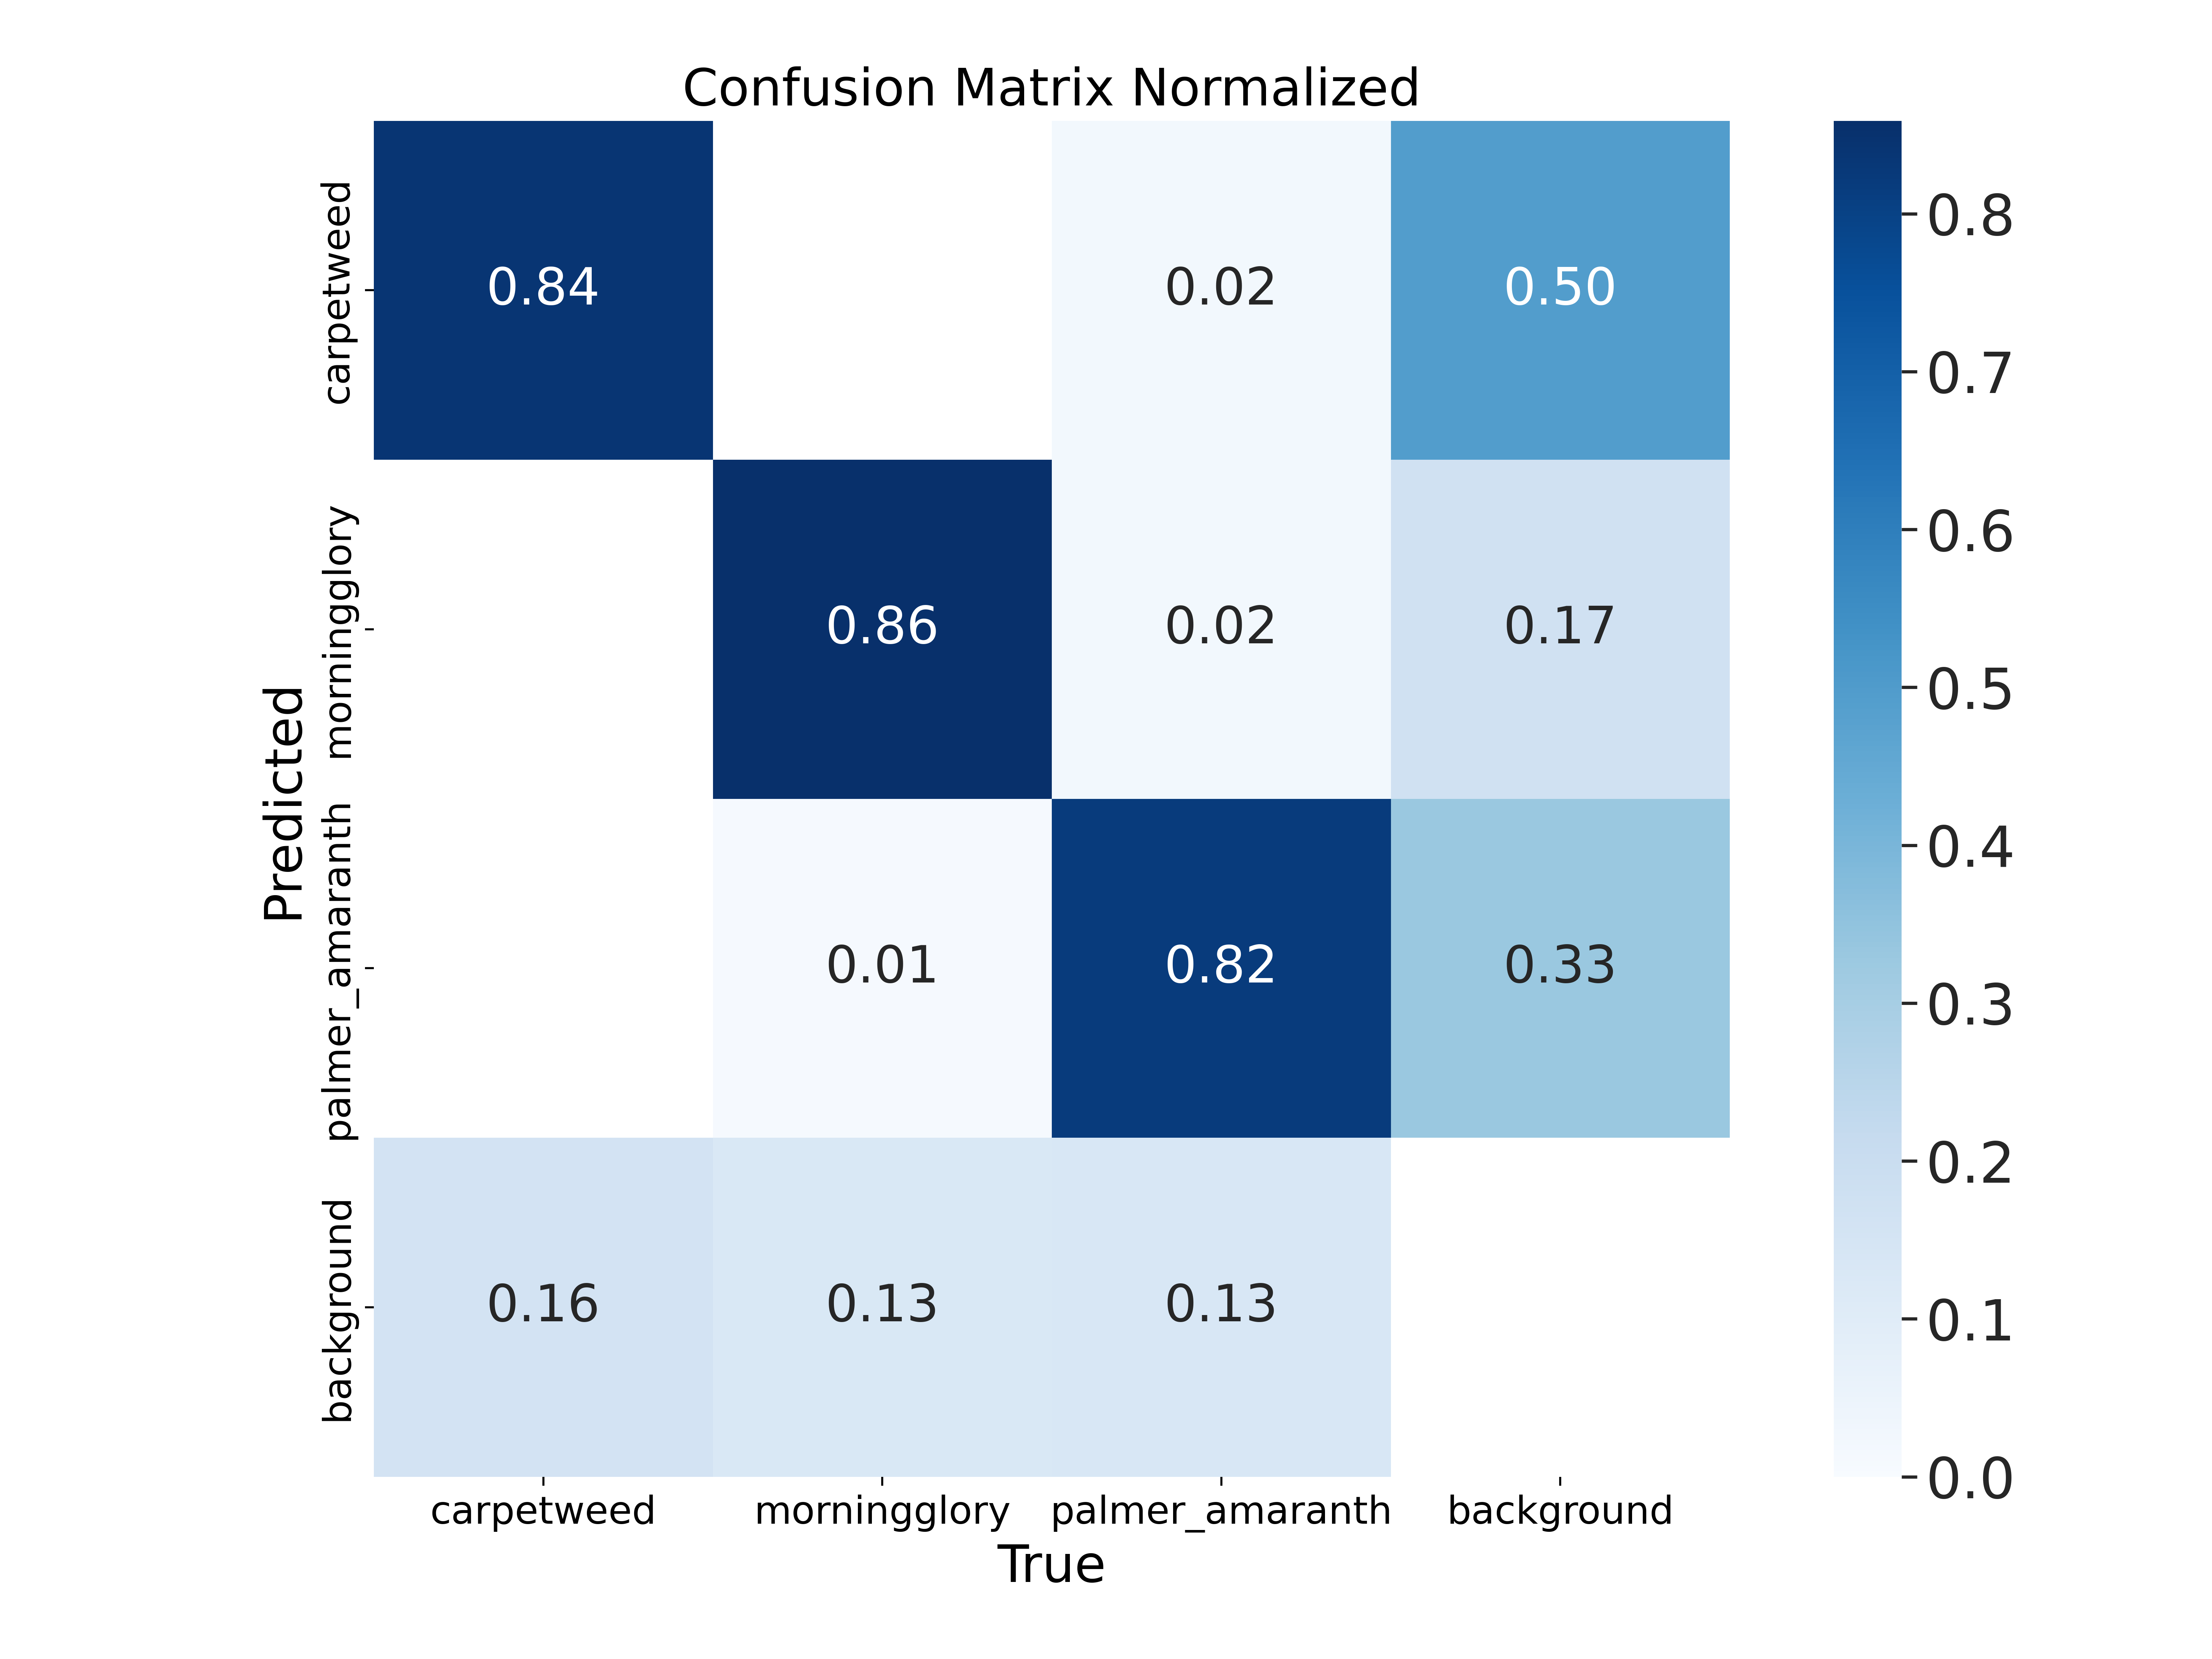
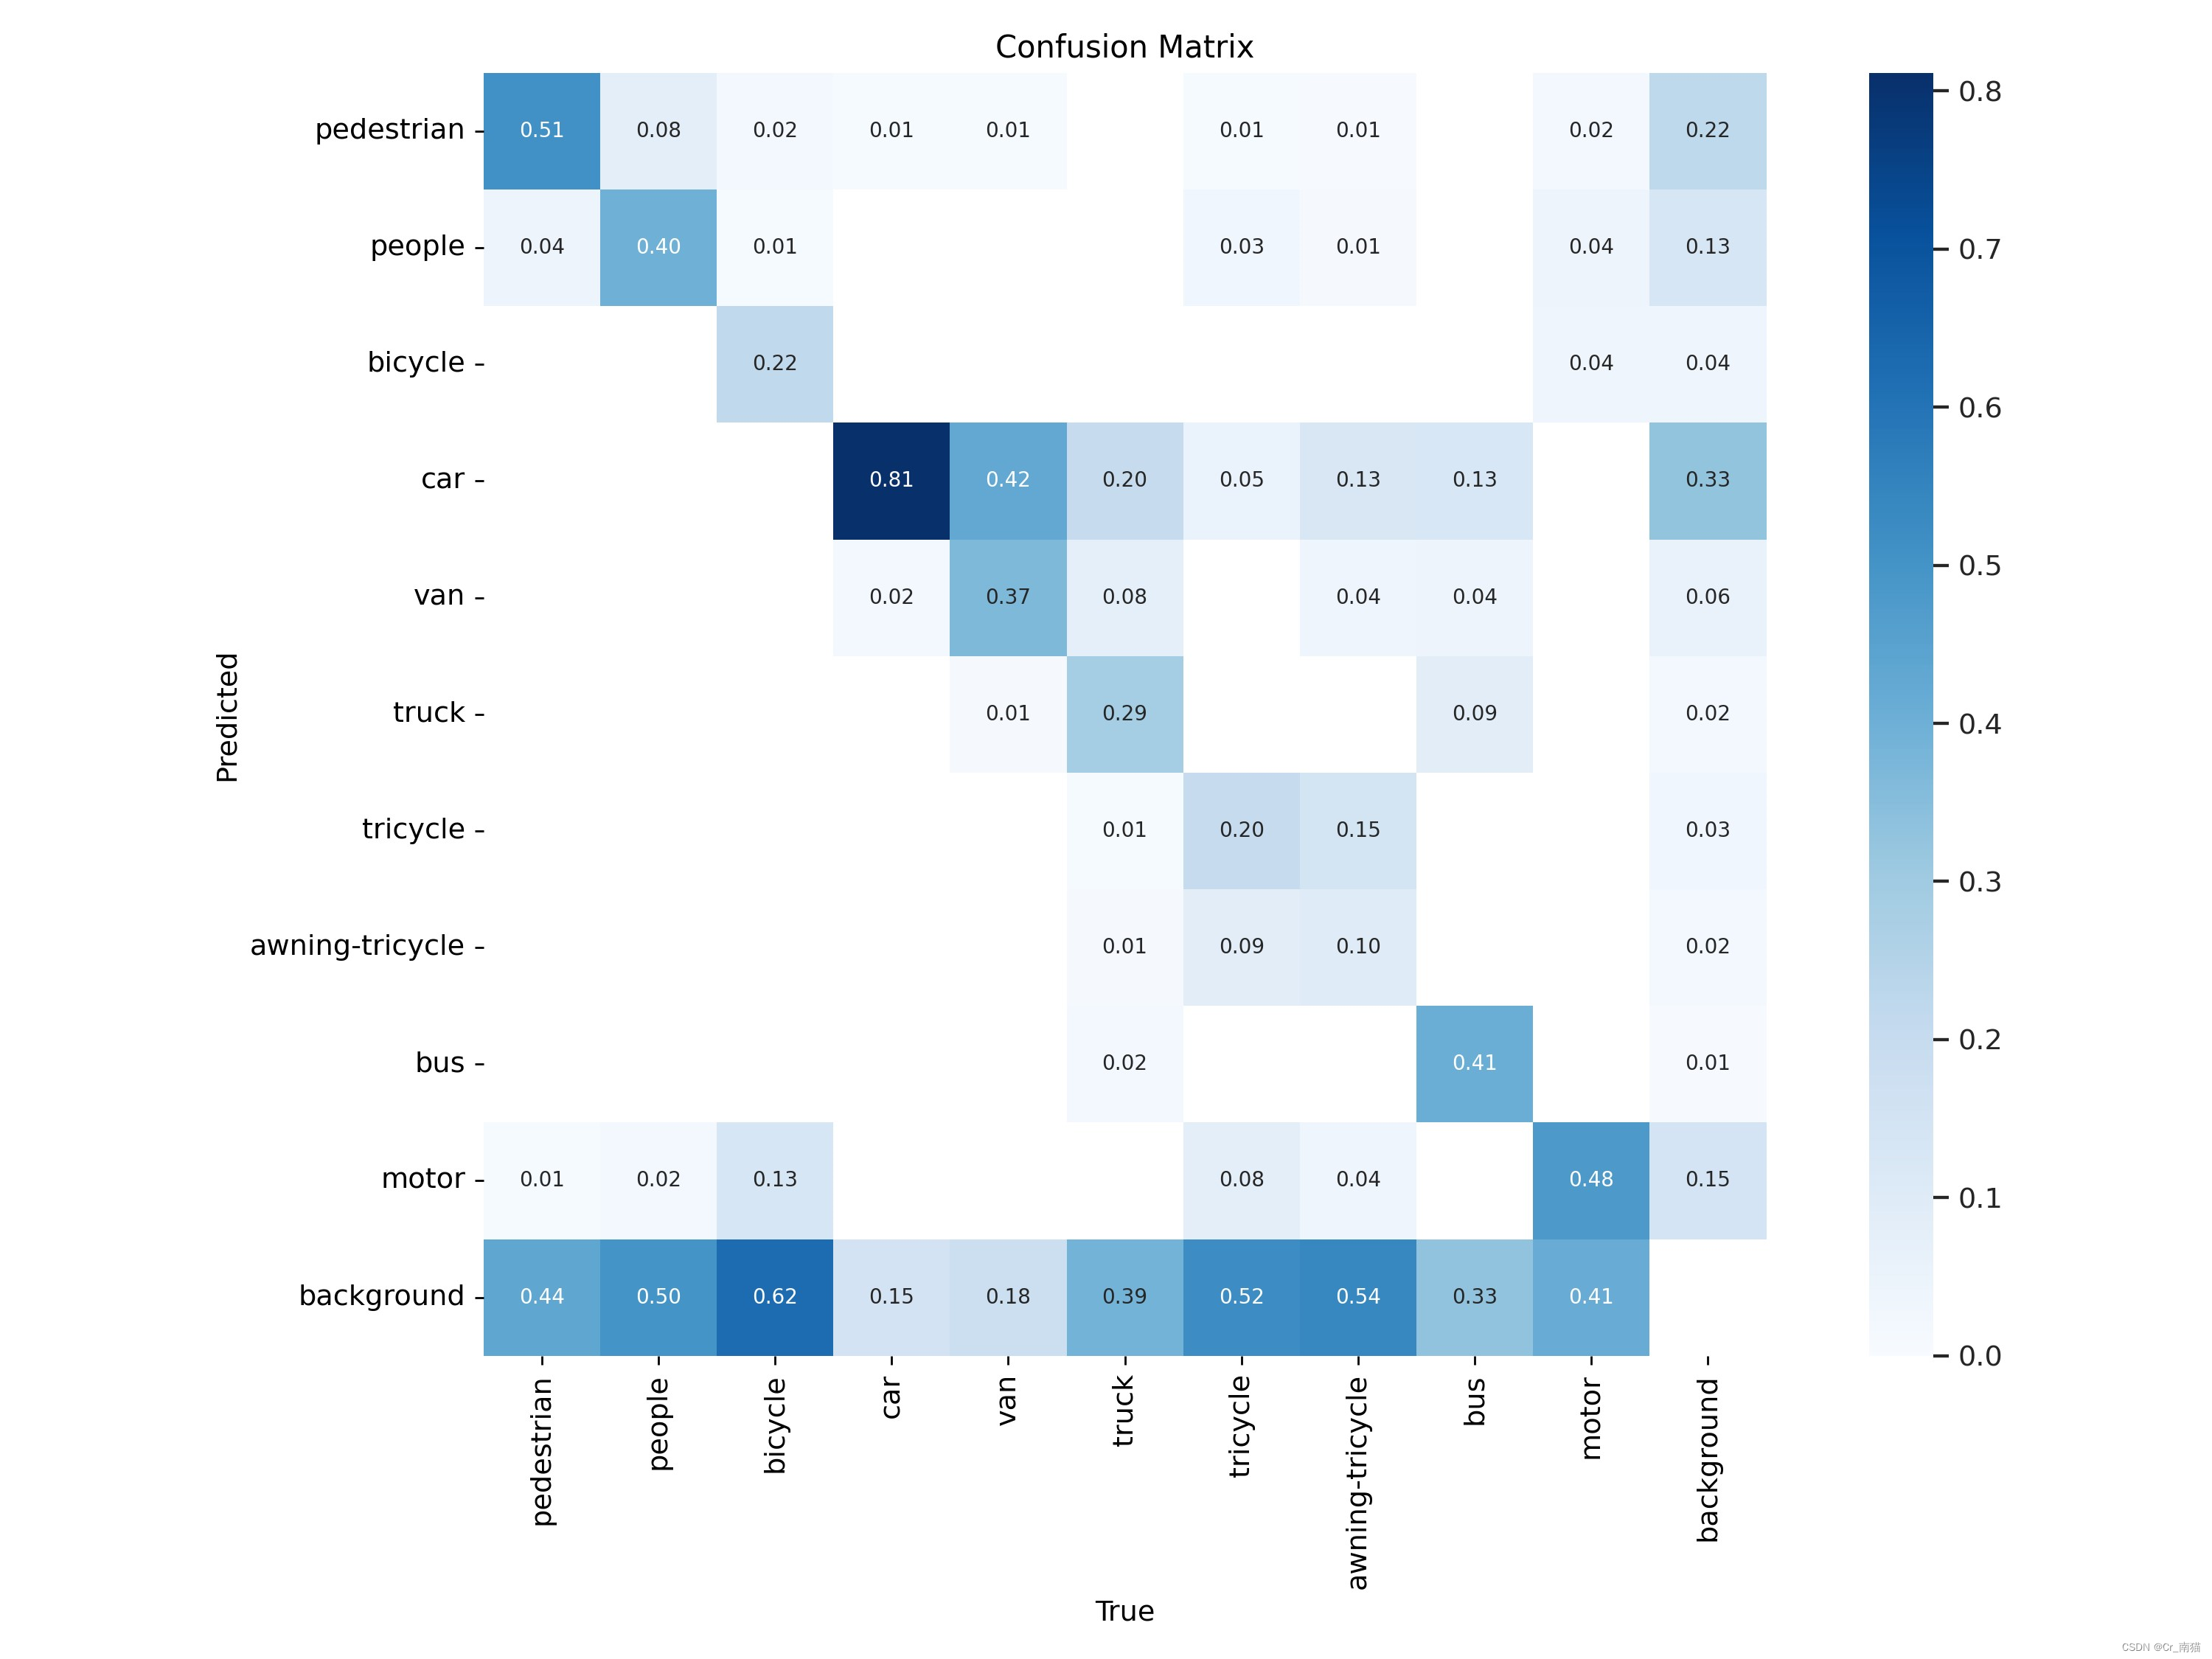
title = 'Confusion Matrix' + ' Normalized' * normalize
ax.set_xlabel('True',fontsize=20)
ax.set_ylabel('Predicted',fontsize=20)
ax.set_title(title,fontsize=20)
plot_fname = Path(save_dir) / f'{title.lower().replace(" ", "_")}.png'
fig.savefig(plot_fname, dpi=500)
plt.close(fig)
if on_plot:
on_plot(plot_fname)
效果图:


![[MRCTF2020]Transform1](https://img-blog.csdnimg.cn/direct/bf55184487954b78b997fb83caa41d1a.png)
![BUUCTF---[MRCTF2020]你传你呢1](https://img-blog.csdnimg.cn/direct/8f6d683d091840879c093b62e9576676.png)