页面结构
<template>
  <div class="echart-chart" :id="id"></div>
</template>
<script>
import { getOption } from './chartOption';
export default {
  name: 'TreeMapChart',
  props: ['id', 'data', 'type'],
  data() {
    return {
      setTimeoutId: null
    };
  },
  watch: {
    data: {
      handler() {
        if (this.chart) {
          this.setOption();
        }
      },
      deep: true,
      immediate: false
    },
    type: {
      handler() {
        if (this.chart) {
          this.setOption();
        }
      },
      deep: true,
      immediate: false
    }
  },
  methods: {
    initChart() {
      this.chart = window.echarts.init(document.getElementById(this.id));
    },
    setOption() {
      this.chart.setOption(getOption(this.data, this.id, this.type), true);
    },
    resize() {
      this.setTimeoutId && clearTimeout(this.setTimeoutId);
      setTimeout(() => {
        this.chart && this.chart.resize();
      }, 500);
    }
  },
  created() {
    window.addEventListener('resize', this.resize);
  },
  async mounted() {
    // setTimeout(() => {
    await this.$nextTick();
    this.initChart();
    this.setOption();
    // }, 300)
  },
  unmounted() {
    this.chart && this.chart.dispose();
    window.removeEventListener('resize', this.resize);
  }
};
</script>
<style lang="less" scoped>
.echart-chart {
  width: 100%;
  height: 100%;
}
</style>
参数配置
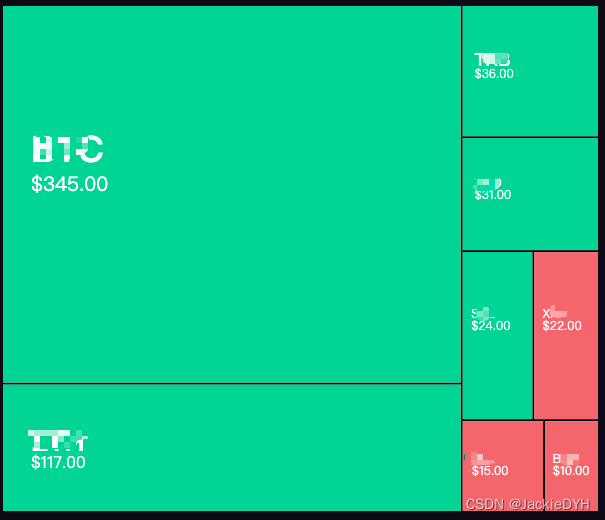
涨跌幅 负的是绿的,正的是红的然后根据颜色深浅表现出来程度
遍历数据加 itemStyle: { // 这里配置每个块的颜色
color:'blue'
},用rgba(r,g,b,a) 把透明度设置在0.3~1 之间,根据数值大小自己设置
import { mockData } from './mock.js';
const formatUtil = window.echarts.format;
import { formatValue, formatNumber } from '@/views/Prices/Hooks/useUtils.js';

// 给每一项添加itemStyle 实现每个单独设置样式
const getData = (data) => {
  return data.map((item) => {
    return {
      ...item,
      itemStyle: {
        borderWidth: 0,
        gapWidth: 2,
        color: item?.flag >= 0 ? '#4DD7A1' : '#E87B7B'
      }
    };
  });
};

export function getOption(diskData, id, type) {
  if (!diskData) {
    diskData = mockData;
  }
  diskData = getData(diskData);
  console.log('diskData', diskData);
  return {
    title: [
      {
        show: false
      }
    ],
    tooltip: {
      //弹出框配置
      formatter: function (info) {
        let value = info.value;
        let name = info.name;
        // if (id == 'treeMapVolume') {
        //   let tip = `<div class="tree-map-tooltip">
        //     <div>${name}</div>
        //     成交量: <span>$${formatUtil.addCommas(value)}亿</span>
        //   </div>`;
        //   return tip;
        // }
        let tip;
        switch (type) {
          case 1:
            tip = `<div class="tree-map-tooltip">
            <div>${name}</div>
            成交量: <span>$${formatNumber(value)}</span>
          </div>`;
            break;
          case 2:
            tip = `<div class="tree-map-tooltip">
            <div>${name}</div>
            价格变化: <span>$${formatUtil.addCommas(value)}%</span>
          </div>`;
            break;
          case 3:
            tip = `<div class="tree-map-tooltip">
            <div>${name}</div>
            爆仓金额: <span>$${formatUtil.addCommas(value)}万</span>
          </div>`;
            break;
          case 4:
            tip = `<div class="tree-map-tooltip">
            <div>${name}</div>
            持仓: <span>$${formatUtil.addCommas(value)}亿</span>
          </div>`;
            break;
          default:
            break;
        }
        return tip;
      },
      backgroundColor: 'rgba(0,0,0,0.9)',
      padding: 0,
      borderWidth: 0,
      textStyle: {
        color: '#fff'
      }
    },
    series: [
      {
        name: 'All',
        type: 'treemap',
        roam: false,
        nodeClick: false,
        width: '100%',
        height: '100%',
        label: {
          show: true,
          position: ['5%', '30%'],
          formatter: (info) => {
            if (id == 'treeMapVolume') {
              let tip = [
                `{nameClass${info.dataIndex}|${info.name}}`,
                `{valueClass${info.dataIndex}|$${formatNumber(info.value)}}`
              ].join('\n');
              return tip;
            }
          },
          rich: {
            //块内文字样式
            nameClass1: {
              fontSize: 36,
              lineHeight: 50,
              fontWeight: 600
            },
            nameClass2: {
              fontSize: 27,
              fontWeight: 600
            },
            nameClass3: {
              fontSize: 18,
              fontWeight: 600
            },
            nameClass4: {
              fontSize: 12,
              fontWeight: 600
            },
            valueClass1: {
              fontSize: 20,
              fontWeight: 400
            },
            valueClass2: {
              fontSize: 16,
              fontWeight: 400
            }
          }
        },
        itemStyle: {
          borderColor: '#fff'
        },
        levels: [
          {
            color: ['#4DD7A1', '#E87B7B', '#777F8D'],
            itemStyle: {
              borderWidth: 0,
              gapWidth: 2,
              borderColor: '#000'
            }
          }
        ],
        data: diskData,
        breadcrumb: {
          show: false //隐藏底部导航条
        }
      }
    ]
  };
}
模拟数据
export const mockData = [
  {
    value: 345,
    name: 'BC',
    flag: 1
  },
  {
    value: 117,
    name: 'EH',
    flag: 1
  },
  {
    value: 36,
    name: 'TB',
    flag: 1
  },
  {
    value: 31,
    name: 'WD',
    flag: 1
  },
  {
    value: 24,
    name: 'SL',
    flag: 0
  },
  {
    value: 22,
    name: 'XP',
    flag: -1
  },
  {
    value: 15,
    name: 'BZ',
    flag: -1
  },
  {
    value: 10,
    name: 'BH',
    flag: -1
  }
];
使用
<TreeMapChart :id="treeMapID" :data="treeMapData" :type="isCheck" />

import TreeMapChart from '@/components/PricesCharts/TreeMapChart';
const isCheck = ref(1);
const treeMapID = ref('treeMapVolume');
const treeMapData = ref(null);
参考
const option = {
    tooltip: {},
    series: [
        {
            name: 'test treemap',
            type: 'treemap',
            visualMin: -100,    //决定颜色的最小值
            visualMax: 100,     //决定颜色的最大值
            visualDimension: 1, //决定颜色看 value 的哪一个值, 1=> 第2个值
            levels: [
                {                                           //第一层
                    color: ['#942e38', '#aaa', '#269f3c'],  //颜色
                    colorMappingBy: 'value',                //用value来决定颜色
                    itemStyle: {
                        borderWidth: 2,
                        borderColor: '#333',
                        gapWidth: 1
                    }
                },
                {                                           //第二层 => 可设定不同颜色
                    color: ['#942e38', '#aaa', '#269f3c'],
                    colorMappingBy: 'value',
                    itemStyle: {
                        borderWidth: 1,
                        borderColor: '#333',
                        gapWidth: 1
                    }
                },
            ],
            data: [
                {
                    name: 'A',
                    value: [15, -35],                       // 第一层: 第一个值决定区块大小,第二个值决定颜色
                    children: [
                        {
                            name: 'A01',
                            value: [10, -70]                // 第二层: 第一个值决定区块大小,第二个值决定颜色
                        },
                        {
                            name: 'A02',
                            value: [3, 20]
                        },
                        {
                            name: 'A03',
                            value: [2, 60]
                        }
                    ]
                },
                {
                    name: 'B',
                    value: [10, 47],
                    children: [
                        {
                            name: 'B01',
                            value: [5, 100]
                        },
                        {
                            name: 'B02',
                            value: [4, -20]
                        },
                        {
                            name: 'B03',
                            value: [1, 50]
                        },
                    ]
                },
                {
                    name: 'C',
                    value: [10, 5],
                },
            ]
        }
    ]
};
注意可设定不同层用不同颜色
color: ['#942e38', '#aaa', '#269f3c'],  //颜色
colorMappingBy: 'value',                //用value来决定颜色
然后
visualMin: -100,    //决定颜色的最小值
visualMax: 100,     //决定颜色的最大值
visualDimension: 1, //决定颜色看 value 的哪一个值, 1=> 第2个值
以下的值为例:第一个值决定区块的大小,第二个值决定颜色(因为 visualDimension= 1)
然后值为 -50 ⇒ 0 是灰色(#aaa),-100是暗红色(#942e38),所以 -50 是浅红色
name: 'A',
value: [10, -50],