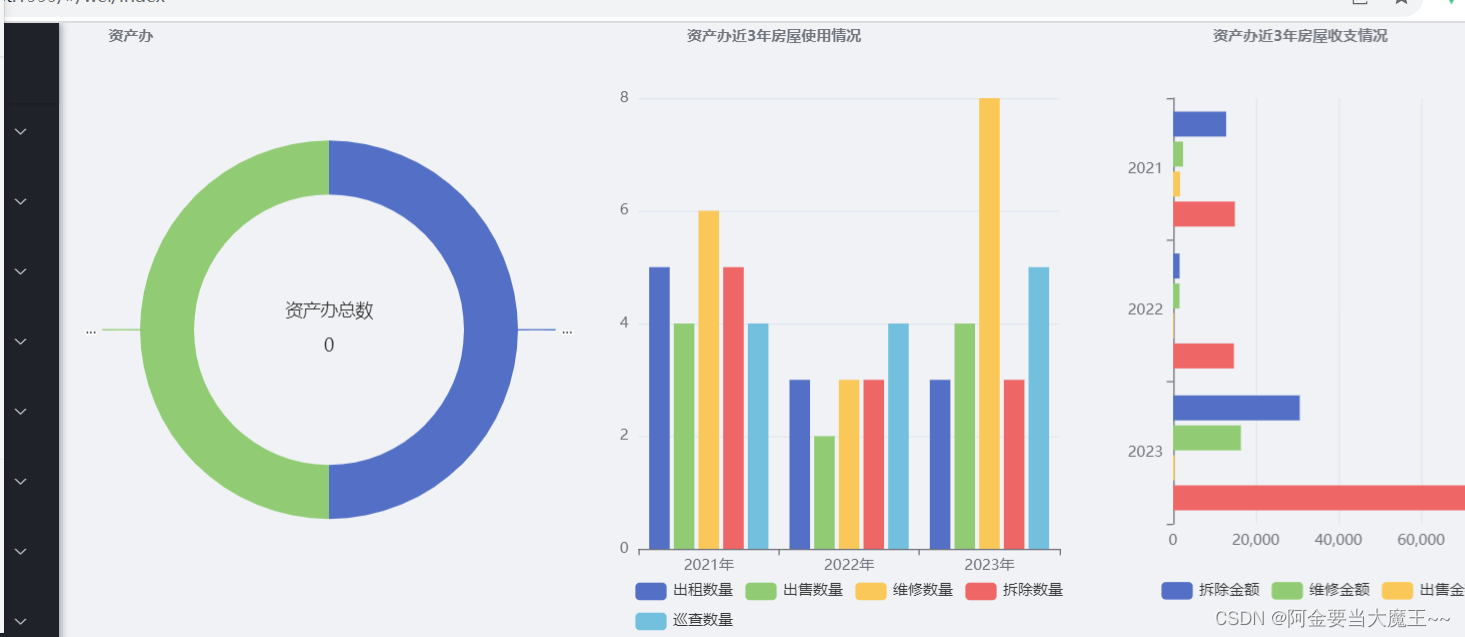
一,页面 图表渲染
index.vue
<template>
  <div >

    <!-- 资产办 -->
    <!-- 进行权限判断  如果是  administrator 或者  资产办 可以看见页面 -->
    <el-row v-if="userInfo.authority == 'administrator' || userInfo.userName == '资产办'">
      <el-col :span="8">
        <div  id="zcbpie" style="height: 490px;width: 100%"></div>
      </el-col>
      <el-col :span="8">
        <div  id="zcbSy" style="height: 490px;width: 100%"></div>
      </el-col>
      <el-col :span="8">
        <div  id="zcbZc" style="height: 490px;width: 100%"></div>
      </el-col>
    </el-row>


  </div>
</template>
<script>
import { zcbList,zichanbankListSz, zichanbankListSy } from "@/api/house/information";
import { mapGetters } from "vuex";
import * as echarts from 'echarts';

  export default {
    data () {
      return {
        zcbCount:[],
        zichanbandata: [],
        zichanbanlist: [],

      }
    },

    computed: {
      ...mapGetters([  // // 映射 this.userInfo 为 store.getters.userInfo
        "userInfo",  //如果一个变量或对象需要在多个页面和组件中使用,那么,可以使用mapGetters。

        // 可放入多个对象

       // computed: mapGetters(["userInfo","freeShipping"]),

      ]),
    },
     mounted() {
      // 11111111111111111111111
      // 资产办
       zcbList().then(res => {
         const data = res.data;
         this.zcbCount=data
         var myChart = echarts.init(document.getElementById('zcbpie'));
         myChart.setOption({
           series: [
             {
               type: 'pie',
               radius: ['50%', '70%'],
               itemStyle:{
                 normal:{
                   label:{
                     show: true,
                     formatter: '{b}:{c}({d}%)'
                   },
                   labelLine :{show:true}
                 }
               },
               data: [
                 {value: this.zcbCount[0].countNumber-this.zcbCount[0].czlNumber, name: '未出租率'},
                 {value: this.zcbCount[0].czlNumber, name: '出租率'}
               ],
             },
           ],
           title:[
             {
               text: '资产办',
               left:'8%',//居中显示
               // top:'80%',//底部显示
               textStyle: {
                 color: '#74767f',
                 fontSize: 12
               }
             },
           ],
           graphic: {
             type: 'text',
             left: 'center',
             top: 'center',
             style: {
               // text: '总数',
               text: '资产办总数' + '\n\n' + this.zcbCount[0].countNumber,
               textAlign: 'center',
               fill: '#333',
               width: 30,
               height: 30,
               fontSize: 14
             }
           },
         });
         window.onresize = function() {
           // 重新设置图表的宽度和高度
           myChart.resize();
         }
       })


      // 资产办近3年房屋使用情况
      zichanbankListSy().then(res => {
        // debugger
        const data = res.data;     //res.data  = data 获取到了 赋值给data
        this.zichanbandata = data   // data  = zichanbandata  data 从新赋值给 zichanbandata
        //  console.log(this.zichanbandata,'资产办近3年房屋使用情况ssssssssssssssssssssssss')
        var myChart = echarts.init(document.getElementById('zcbSy'));  //渲染id
        // console.log(this.zichanbandata[0].chaiChuAmount,'this.zichanbandata[0].chaiChuAmount')

        const option = {
          title: [
            {
              text: '资产办近3年房屋使用情况', //标题
              left: '18%',//居中显示F
              // top:'80%',//底部显示
              textStyle: {
                color: '#74767f',
                fontSize: 12
              }
            },
          ],

          legend: {
            // data: ['Forest', 'Steppe', 'Desert', 'Wetland'],
            data: ['出租数量', '出售数量', '维修数量', '拆除数量', '巡查数量'],  //文字显示
            // orient: 'vertical',
            bottom: '0 %',
          },
          tooltip: {
            trigger: 'axis',
            axisPointer: {
              type: 'shadow'
            }
          },
          dataset: {
            source: [
              //  获取后端值 进行渲染
              ["product", "出租数量", "出售数量", "维修数量", "拆除数量", "巡查数量"],
              ["2021年",  this.zichanbandata[0].chaiChuAmount,  this.zichanbandata[0].chuShouAmount,  this.zichanbandata[0].weiXiuAmount,  this.zichanbandata[0].chaiChuAmount, this.zichanbandata[0].xunChaAmount],
              ["2022年",  this.zichanbandata[1].chaiChuAmount,  this.zichanbandata[1].chuShouAmount,  this.zichanbandata[1].weiXiuAmount,  this.zichanbandata[1].chaiChuAmount, this.zichanbandata[1].xunChaAmount],
              ["2023年",  this.zichanbandata[2].chaiChuAmount,  this.zichanbandata[2].chuShouAmount,  this.zichanbandata[2].weiXiuAmount,  this.zichanbandata[2].chaiChuAmount, this.zichanbandata[2].xunChaAmount],

            ],
          },
          xAxis: { type: "category" },
          yAxis: {},
          series: [{ type: "bar" }, { type: "bar" }, { type: "bar" }, { type: "bar" }, { type: "bar" }],
        };

        myChart.setOption(option);
        window.addEventListener("resize", () => {
          myChart.resize();
        });

        window.onresize = function () {
          // 重新设置图表的宽度和高度
          myChart.resize();
        }
        // }
      })


      // 11111111111111111111111
      // 资产办近3年房屋收支情况
      zichanbankListSz().then(res => {
        // debugger
        const data = res.data;
        this.zichanbanlist = data
        console.log( this.zichanbanlist,'资产办近3年房屋收支情况')
        var myChart = echarts.init(document.getElementById('zcbZc'));
        const option = {
          title: [
            {
              text: '资产办近3年房屋收支情况',
              left: '18%',//居中显示
              textStyle: {
                color: '#74767f',
                fontSize: 12
              }
            },
          ],
          tooltip: {
            trigger: 'axis',
            axisPointer: {
              type: 'shadow'
            }
          },
          legend: {
            data: ['拆除金额', '维修金额', '出售金额', '出租金额'],
            bottom: '5 %',

          },
          grid: {
            left: '3%',
            containLabel: true
          },
          xAxis: {
            type: 'value',
          },
          yAxis: {
            type: 'category',
            data: ['2023', '2022', '2021']
          },

          series: [
            {
              name: '拆除金额',
              type: 'bar',
              data: [this.zichanbanlist[2].chaiChuMoney, this.zichanbanlist[1].chaiChuMoney,  this.zichanbanlist[0].chaiChuMoney],
            },
            {
              name: '维修金额',
              type: 'bar',
              data: [this.zichanbanlist[2].weiXiuMoney, this.zichanbanlist[1].weiXiuMoney, this.zichanbanlist[0].weiXiuMoney],
            },
            {
              name: '出售金额',
              type: 'bar',
              data: [this.zichanbanlist[2].chuShouMoney, this.zichanbanlist[1].chuShouMoney, this.zichanbanlist[0].chuShouMoney],
            },
            {
              name: '出租金额',
              type: 'bar',
              data: [this.zichanbanlist[2].chuZuMoney, this.zichanbanlist[1].chuZuMoney, this.zichanbanlist[0].chuZuMoney],
            },
          ]
        };
        option && myChart.setOption(option);
        window.onresize = function () {
          // 重新设置图表的宽度和高度
          myChart.resize();
        }
      });
  },
  methods: {
  }
}
</script>

<style>
.echarts {
  height: 400vh;
  width: 100px;
}

.avue-data-panel .item {
  border-radius: 5%;
}

.avue-view {
  width: 100%;
  height: 100%;
  background: #f0f2f5;
  background-size: 100%;
  background-repeat: no-repeat;
}
</style>
api.house.information.js
import request from '@/router/axios';

// 11111111111111
export const zcbList = (params) => {
  return request({
    url: '/api/house/information/zcbList',
    method: 'get',
    params: {
      ...params,
    }
  })
}


// 资产办近3年房屋收支情况 1111111111111111
export const zichanbankListSz = () => {
  return request({
    url: '/api/house/information/zcbTiaoMoneyList',
    method: 'get',

  })
}


// 资产办近3年房屋使用情况 1111111111111
export const zichanbankListSy = () => {
  return request({
    url: '/api/house/information/zcbTiaoList',
    method: 'get',

  })
}
vue.config.js
module.exports = {
  lintOnSave: true,
  productionSourceMap: false,
  chainWebpack: (config) => {
    //忽略的打包文件
    config.externals({
      'vue': 'Vue',
      'vue-router': 'VueRouter',
      'vuex': 'Vuex',
      'axios': 'axios',
      'element-ui': 'ELEMENT',
    })
    const entry = config.entry('app')
    entry
      .add('babel-polyfill')
      .end()
    entry
      .add('classlist-polyfill')
      .end()
    entry
      .add('@/mock')
      .end()
  },
  devServer: {
    // 端口配置
    port: 1999,
    // 反向代理配置
    proxy: {
      '/api': {
        target: 'http://192.168.56.1:7777',
        ws: true,
        pathRewrite: {
          '^/api': '/'
        }
      }
    },
  }
}


![[数据结构]红黑树的定义以及添加原则](https://img-blog.csdnimg.cn/direct/194e45f2dd2c4e71992cb56f7be120f9.png)