用Python处理TDC激光测距数据并绘制为图片
说明
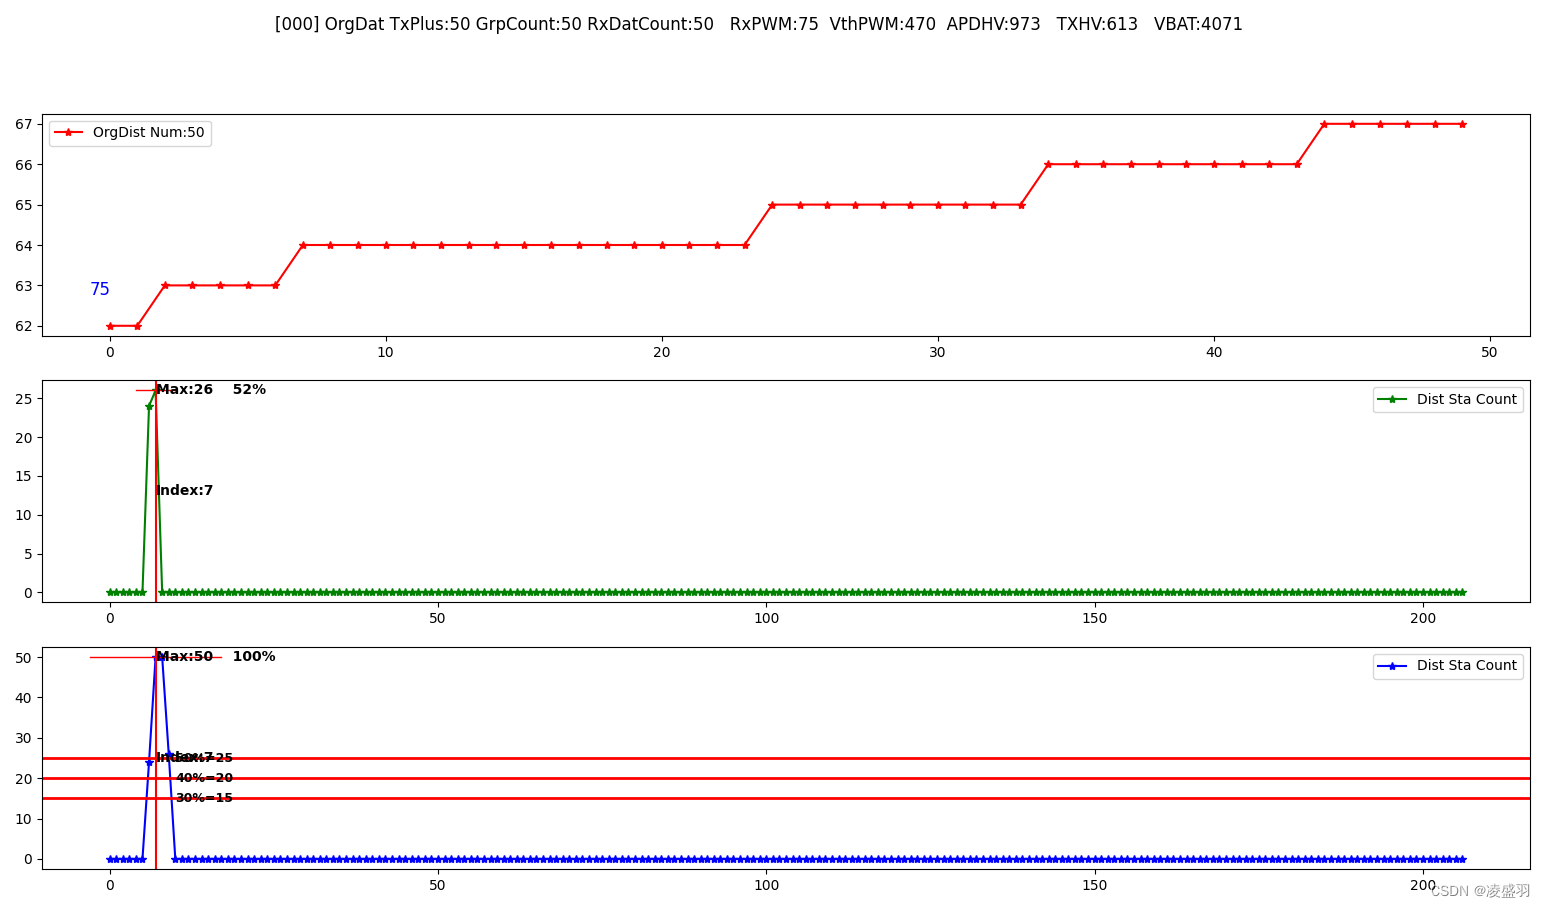
1. 主要是将TDC激光测距数据进行统计叠加并绘制为图片,便于直观的分析与观察
一、定义全局变量变
# -*- coding: utf-8 -*-
import matplotlib.pyplot as plt
import datetime
import numpy as np
import os
import datetime
import shutil
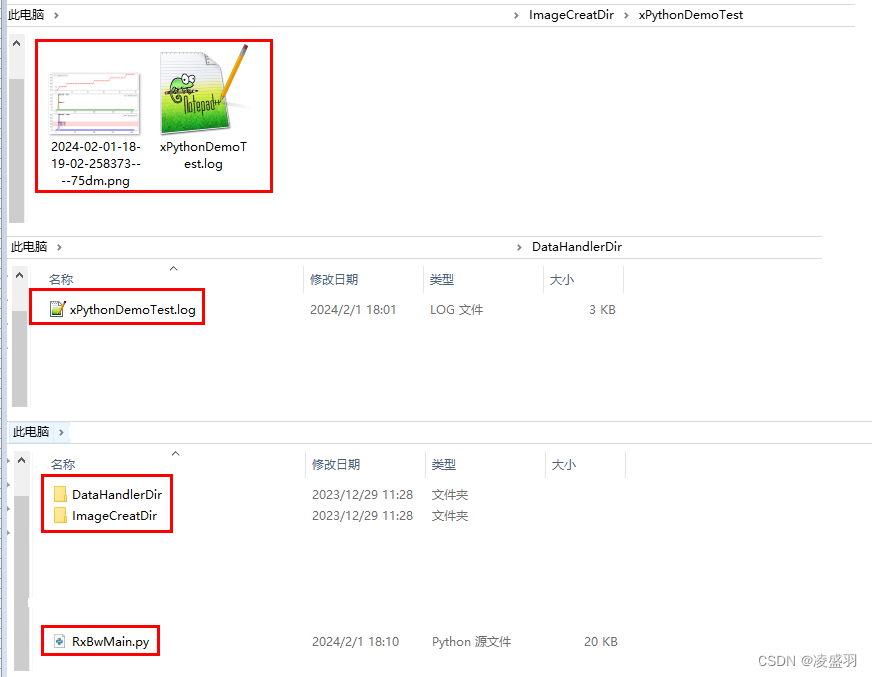
ORG_DAT_STORE_DIR = 'DataHandlerDir' #原始文件目录
RES_DAT_STORE_DIR = 'ImageCreatDir' #处理文件目录
RES_INFO_FILE_EXTENSION = '.log' #原始文件后缀名
RES_INFO_IMAGE_EXTENSION = '.png' #处理文件后缀名
SUPER_CALC_DIST_GAP_POINT = 2
SUPER_PEAK_GAP_POINT = 4
DIST_SUPER_GAP_M = 2 #距离叠加的间隔
OrgDatStop1Mem = [] #Stop1原始数据缓存
OrgDatStop2Mem = [] #Stop2原始数据缓存
DIST1_FIX_SUPER_MAX_VAL_M = 3000 #距离1(Stop1)固定叠加的最大值
DIST1_RANGE_SUPER_MAX_VAL_M = 3000 #距离1(Stop1)范围叠加的最大值
DIST2_FIX_SUPER_MAX_VAL_M = 3000 #距离2(Stop2)固定叠加的最大值
DIST2_RANGE_SUPER_MAX_VAL_M = 3000 #距离2(Stop2)范围叠加的最大值
DIST1_DIST2_RANGE_SUPER_MAX_VAL_M = 3000 #距离1~距离2(Stop1~Stop2)范围叠加的最大值
DIST2_DIST1_DIFF_SUPER_MAX_VAL_DM = 3000 #距离2-距离1(Stop2-Stop1)脉宽叠加的最大值
CreatImageCount = 0
OrgStaInfo = ""
#原始文件
OrgDataFileNameGroup = \
[
r"DataHandlerDir/xPythonDemoTest.log",
]
二、主函数入口
#删除目录内容
def Delete_Directory_Content(dir):
    if os.path.exists(dir) == True: #目录存在
        for item in os.listdir(dir): #目录中内容
            name = os.path.join(dir, item) #拼接完整路径
            if os.path.isfile(name):
                os.remove(name) #删除目录
            elif os.path.isdir(name):
                shutil.rmtree(name) #删除文件


# 原始数据处理
def Original_Data_Handler(nameGroup):
    global RES_DAT_STORE_DIR
    global RES_INFO_FILE_EXTENSION

    if len(nameGroup) <= 0:
        print('No Need Handler Files......')
        return

    for name in nameGroup:
        nameExten = os.path.basename(name) #结果文件名+后缀名 xTest.log
        nameOnly  = os.path.splitext(nameExten)[0] #结果文件名 xTest
        newDir    = os.path.join(RES_DAT_STORE_DIR, nameOnly) #结果文件路径 #ImageCreatDir\xTest

        # 创建目录
        if os.path.exists(newDir) == False:
            os.mkdir(newDir)
        else:
            Delete_Directory_Content(newDir)

        # 创建文件 结果文件 ImageCreatDir\xTest\xTest.log
        newInfoFile = newDir + os.path.sep + nameOnly + RES_INFO_FILE_EXTENSION
        with open(newInfoFile, 'w'):
            pass

        # print("==1==>  " + name)        #DataHandlerDir/xTest.log
        # print("==2==>  " + newDir)      #ImageCreatDir\xTest
        # print("==3==>  " + newInfoFile) #ImageCreatDir\xTest\xTest.log
        # print("==4==>  " + nameOnly)    #xTest
        # print("==5==>  " + nameExten)   #xTest.log

        print(r'Start Handler  ====>  ', name)
        OrgData_FileHandler(name, newDir, newInfoFile)


def main():
    global ORG_DAT_STORE_DIR
    global RES_DAT_STORE_DIR
    global OrgDataFileNameGroup

    if os.path.exists(ORG_DAT_STORE_DIR) == False:
        os.mkdir(ORG_DAT_STORE_DIR)
        return

    if os.path.exists(RES_DAT_STORE_DIR) == False:
        os.mkdir(RES_DAT_STORE_DIR)
        return

    Original_Data_Handler(OrgDataFileNameGroup)
    print('All Original Data Files Handler Complete......')


if __name__ == '__main__':
    main()
三、处理原始文件数据
#是否为数字
def Judge_IsDigit(orgData):
    for dat in orgData:
        if dat.isdigit() == False:
            return 1
    return 0


#追加数据到Stop1-Stop2缓存
def AppendData_Stop1Stop2(stop1, stop2):
    global OrgDatStop1Mem
    global OrgDatStop2Mem

    OrgDatStop1Mem.append(stop1)
    OrgDatStop2Mem.append(stop2)

#清空Stop1-Stop2缓存
def ClearData_Stop1Stop2():
    global OrgDatStop1Mem
    global OrgDatStop2Mem

    OrgDatStop1Mem.clear()
    OrgDatStop2Mem.clear()


#原始文件处理
def OrgData_FileHandler(orgDatFile,resInfoDir,resInfoFile):
    # print("orgDatFile : " + orgDatFile)  #DataHandlerDir/xTest.log
    # print("resInfoDir : " + resInfoDir)  #ImageCreatDir\xTest
    # print("resInfoFile: " + resInfoFile) #ImageCreatDir\xTest\xTest.log

    global OrgDatStop1Mem
    global OrgDatStop2Mem
    global CreatImageCount
    global OrgStaInfo

    if os.path.exists(orgDatFile) == False: #文件不存在
        return

    CreatImageCount = 0
    orgDataCount    = 0
    ClearData_Stop1Stop2()
    with open(orgDatFile,'r', encoding='utf-8') as fileHander:#读方式打开文件
        for lineTxt in fileHander: #行方式读取文件内容
            if len(lineTxt.strip()) <= 30: #一行数据太少
                continue

            if '[' not in lineTxt: #不存在[
                continue

            if ']' not in lineTxt: #不存在]
                continue

            separDat = lineTxt.replace(']', ', ').replace('[', '') #将[]替换
            orgData  = [spData.strip() for spData in separDat.split(",")] #以,拆分
            if Judge_IsDigit(orgData) == 0:#全为数字
                if int(orgData[0]) == 0:
                    if len(OrgDatStop1Mem) > 10:
                        OrgStaInfo = lineTxt
                        OrgData_CreateImage(OrgDatStop1Mem, OrgDatStop2Mem, resInfoDir,resInfoFile)

                    OrgStaInfo = ""
                    orgDataCount = 0
                    ClearData_Stop1Stop2()
                    AppendData_Stop1Stop2(orgData[1], orgData[2])
                else:
                    orgDataCount = orgDataCount + 1
                    if orgDataCount == int(orgData[0]):
                        AppendData_Stop1Stop2(orgData[1], orgData[2])
                    else:
                        OrgStaInfo   = ""
                        orgDataCount = 0
                        ClearData_Stop1Stop2()
            else:
                if len(OrgDatStop1Mem) > 10:
                    OrgStaInfo = lineTxt
                    OrgData_CreateImage(OrgDatStop1Mem, OrgDatStop2Mem, resInfoDir,resInfoFile)

                OrgStaInfo = ""
                orgDataCount = 0
                ClearData_Stop1Stop2()
四、将数据叠加统计生成图片
# 生成图片
def OrgData_CreateImage(stop1, stop2, resInfoDir,resInfoFile):
    global RES_INFO_IMAGE_EXTENSION
    global CreatImageCount
    global OrgStaInfo

    stop1Org = np.array([int(i) for i in stop1])
    stop1Dat = SuperAnalyse_Stop1FixPoint(stop1Org)
    stop1OrgSort  = np.array(sorted(stop1Org))
    stop1CountMax = max(stop1Dat)

    stop2Org         = np.array([int(i) for i in stop2])
    # waveData,OrgPlus = SuperAnalyse_Stop1Stop2_RangePoint(stop1Org, stop2Org, 0)
    waveData = SuperAnalyse_Stop1Stop2_RangePoint(stop1Org, stop2Org, 2)
    waveCountMax = max(waveData)
    if waveCountMax < 5:
        return


    sum   = 0
    count = 0
    for val in waveData:
        if val > 0:
            sum += val
            count += 1

    mean = sum / count
    print('mean:', mean)

    std = np.std(waveData)
    print('STD:', std)


    # if abs(np.argmax(waveData) - np.argmax(stop1Dat)) > 15:
    #     return


    dist  = Calculate_Dist(np.argmax(waveData), waveData)
    # index,dist2 = Superpos_FrontPart_Handler(np.argmax(waveData), waveData)
    # if index > 0 and dist2 > 0:
    #     dist = dist2


    x = [i for i in range(2000)]
    z = np.argmax(waveData) - 200
    y = np.argmax(waveData) + 200

    # z = 0
    # y = 1800

    if z < 0:
        z = 0

    if y > 2000:
        y = 2000


    # plt.figure(figsize=(20, 20))
    plt.figure(figsize=(12,8))
    # plt.rcParams['font.sans-serif'] = ['SimHei']
    # plt.rcParams['axes.unicode_minus'] = False

    plt.subplot(3, 1, 1)
    plt.plot(stop1OrgSort, '*-', color='red', label='OrgDist Num:{}'.format(len(stop1OrgSort)))
    # plt.plot(OrgPlus, '*-', color='red', label='OrgDist Num:{}'.format(len(stop1OrgSort)))
    plt.legend()#plot(label)显示出来
########################################################################################################################################################################################################


    plt.subplot(3, 1, 2)
    plt.plot(x[z:y], stop1Dat[z:y], '*-', color='green', label='Dist Sta Count')
    stop1CountMaxIndex = np.argmax(stop1Dat)
    plt.axvline(stop1CountMaxIndex, color="red")
    yMin, yMax = plt.ylim()
    plt.text(stop1CountMaxIndex, (yMax-yMin)/2 + yMin, 'Index:{}'.format(int(stop1CountMaxIndex)), fontsize=10, fontweight='bold', color="black", ha='left', va='center')

    xMin, xMax = plt.xlim()
    xmin = ((stop1CountMaxIndex - 3) - xMin) / (xMax - xMin)
    xmax = ((stop1CountMaxIndex + 3) - xMin) / (xMax - xMin)
    plt.axhline(stop1CountMax, color="red", xmin=xmin, xmax=xmax, linewidth=1)
    per = int((int(stop1CountMax) * 100) / len(stop1OrgSort))
    plt.text(stop1CountMaxIndex, int(stop1CountMax), 'Max:{}    {}%'.format(int(stop1CountMax), int(per)), fontsize=10, fontweight='bold', color="black", ha='left', va='center')
    plt.legend()#plot(label)显示出来
########################################################################################################################################################################################################


    plt.subplot(3, 1, 3)
    plt.plot(x[z:y], waveData[z:y], '*-', color='blue', label='Dist Sta Count')
    waveCountMaxIndex = np.argmax(waveData)
    plt.axvline(waveCountMaxIndex, color="red")
    yMin, yMax = plt.ylim()
    plt.text(waveCountMaxIndex, (yMax-yMin)/2 + yMin, 'Index:{}'.format(int(waveCountMaxIndex)), fontsize=10, fontweight='bold', color="black", ha='left', va='center')
    # print(waveCountMaxIndex, waveCountMax, yMin, yMax) #264 54

    xMin, xMax = plt.xlim()
    plt.axhline(int(waveCountMax * 0.5), color="red", linewidth=2)
    plt.axhline(int(waveCountMax * 0.4), color="red", linewidth=2)
    plt.axhline(int(waveCountMax * 0.3), color="red", linewidth=2)

    xWave = waveCountMaxIndex - 100
    if xWave < 0:
        xWave = 10
    plt.text(xWave, int(waveCountMax * 0.5), '50%={}'.format(int(waveCountMax * 0.5)), fontsize=9, fontweight='bold', color="black", ha='left', va='center')
    plt.text(xWave, int(waveCountMax * 0.4), '40%={}'.format(int(waveCountMax * 0.4)), fontsize=9, fontweight='bold', color="black", ha='left', va='center')
    plt.text(xWave, int(waveCountMax * 0.3), '30%={}'.format(int(waveCountMax * 0.3)), fontsize=9, fontweight='bold', color="black", ha='left', va='center')

    xmin = ((waveCountMaxIndex - 10) - xMin) / (xMax - xMin)
    xmax = ((waveCountMaxIndex + 10) - xMin) / (xMax - xMin)
    plt.axhline(waveCountMax, color="red", xmin=xmin, xmax=xmax, linewidth=1)
    per = int((int(waveCountMax)*100) / len(stop1OrgSort))
    plt.text(waveCountMaxIndex, int(waveCountMax), 'Max:{}    {}%'.format(int(waveCountMax), int(per)), fontsize=10, fontweight='bold', color="black", ha='left', va='center')
    plt.figtext(0.15, 0.7, dist, color='blue', fontsize=12, ha="left", va="center")
    plt.legend()#plot(label)显示出来
########################################################################################################################################################################################################


    curTimestamp = datetime.datetime.now().strftime("%Y-%m-%d-%H-%M-%S-%f")
    picDirName = resInfoDir + os.path.sep + curTimestamp + '----' + str(dist) + 'dm' + RES_INFO_IMAGE_EXTENSION
    # print(picDirName)

    # CreatImageCount += 1
    # strImageCount = '[%04u]' % CreatImageCount

    # strImageCount = strImageCount +  curTimestamp + '----'
    # print(strImageCount)

    writeText = curTimestamp + '----' + str(dist) + 'dm'
    Update_Result_File_Info(resInfoFile, writeText)


    plt.savefig(picDirName, dpi=500, bbox_inches="tight")
    # plt.close()
    plt.get_current_fig_manager().window.state('zoomed')# 最大化显示窗口
    plt.suptitle(OrgStaInfo)
    plt.show(block=True)
五、额外的辅助函数
# 更新结果文件信息
def Update_Result_File_Info(resInfoFile, writeText):
    with open(resInfoFile, 'a+', encoding='utf-8') as wruteHandler:
        wruteHandler.write(writeText + '\r')


# 计算距离
def Calculate_Dist(peakIndex, superDat):
    global SUPER_CALC_DIST_GAP_POINT

    sumVal = 0
    dist   = 0
    superOrgDat = np.array([int(i) for i in superDat])
    if peakIndex < SUPER_CALC_DIST_GAP_POINT:
        start = 0
    else:
        start = peakIndex - SUPER_CALC_DIST_GAP_POINT

    end = peakIndex + SUPER_CALC_DIST_GAP_POINT + 1
    for i in range(start, end):
        val     = superOrgDat[i]
        sumVal += val
        print('Max%d:(%04d %03d)    ' %(abs(peakIndex - i), i, val), end='')

    for i in range(start, end):
        if superOrgDat[i] > 0:
            dist += (superOrgDat[i] * i * 100) / sumVal

    dist   = int((int(dist) + 5) / 10)
    resStr = "Dist%sdm" % (str(dist))
    print(resStr)
    return dist


# print("Name: {}, Age: {}, Height: {:.1f}".format(name, age, height))
# print("Name: %s, Age: %d, Height: %.1f" % (name, age, height))
# def Superpos_BackPart_Handler(peakIndex, superDat):
def Superpos_FrontPart_Handler(peakIndex, superDat):
    global SUPER_CALC_DIST_GAP_POINT

    secDist     = 0
    secVal      = 0
    secValIndex = 0
    superOrgDat = np.array([int(i) for i in superDat])
    if peakIndex > (SUPER_PEAK_GAP_POINT << 1):
        end   = peakIndex - SUPER_PEAK_GAP_POINT + 1

        for i in range(0, end):
            val = superOrgDat[i]
            if secVal < val:
                secVal      = val
                secValIndex = i

        if secVal > 10:
            secDist = Calculate_Dist(secValIndex, superDat)
            print('dist2 ===> ', secDist)

        return (secValIndex, secDist)
六、将数据进行各种形式统计叠加
# 叠加统计分析Stop1~Stop2(距离1~距离2)范围点的叠加
def SuperAnalyse_Stop1Stop2_RangePoint(orgStop1, orgStop2, gapDist):
    global DIST1_DIST2_RANGE_SUPER_MAX_VAL_M

    superDat = np.zeros(DIST1_DIST2_RANGE_SUPER_MAX_VAL_M) #最大叠加距离
    if len(orgStop1) != len(orgStop2): #长度异常
        return superDat

    for i in range(len(orgStop1)):
        if int(orgStop1[i]) >= (DIST1_DIST2_RANGE_SUPER_MAX_VAL_M * 10): #超范围
            continue

        if int(orgStop2[i]) >= (DIST1_DIST2_RANGE_SUPER_MAX_VAL_M * 10): #超范围
            continue

        if orgStop1[i] >= orgStop2[i]: #异常情况
            continue

        #起始数据(距离1+距离2)转化为m
        start = int((orgStop1[i] + 5) / 10)
        end   = int((orgStop2[i] + 5) / 10)
        if (end - start) > int(gapDist) : #叠加限制
            end = start + int(gapDist)

        #边界限制
        if start < 0:
            start = 0
        if end >= DIST1_DIST2_RANGE_SUPER_MAX_VAL_M:
            end = (DIST1_DIST2_RANGE_SUPER_MAX_VAL_M - 1)

        #叠加区间(距离1~距离2)
        for j in range(start, (end + 1)):
            superDat[j] = superDat[j] + 1

    return superDat


# 叠加统计分析Stop2-Stop1(距离2-距离1=脉宽)脉宽的叠加
def SuperAnalyse_Stop2Stop1_DiffPoint(orgStop1, orgStop2, front, back):
    global DIST2_DIST1_DIFF_SUPER_MAX_VAL_DM

    plusDat = np.zeros(DIST2_DIST1_DIFF_SUPER_MAX_VAL_DM) #最大叠加距离
    if len(orgStop1) != len(orgStop2): #长度异常
        return plusDat

    for i in range(len(orgStop1)):
        if int(orgStop1[i]) >= (DIST2_DIST1_DIFF_SUPER_MAX_VAL_DM * 10): #超范围
            continue

        if int(orgStop2[i]) >= (DIST2_DIST1_DIFF_SUPER_MAX_VAL_DM * 10): #超范围
            continue

        if orgStop1[i] >= orgStop2[i]: #异常情况
            continue

        #脉宽数据(距离2-距离1)单位dm
        diff = int(orgStop2[i]) - int(orgStop2[i])

        #范围值
        start = diff - front
        end   = diff + back

        #边界限制
        if start < 0:
            start = 0
        if end >= DIST2_DIST1_DIFF_SUPER_MAX_VAL_DM:
            end = (DIST2_DIST1_DIFF_SUPER_MAX_VAL_DM - 1)

        #叠加区间
        for j in range(start, (end + 1)):
            plusDat[j] = plusDat[j] + 1

    return plusDat


# 叠加统计分析Stop1固定的叠加
def SuperAnalyse_Stop1FixPoint(orgStop1):
    global DIST1_FIX_SUPER_MAX_VAL_M

    stop1Count = np.zeros(DIST1_FIX_SUPER_MAX_VAL_M) #最大叠加距离
    for i in range(len(orgStop1)):
        if int(orgStop1[i]) < (DIST1_FIX_SUPER_MAX_VAL_M * 10): #限制距离
            curVal = int((orgStop1[i] + 5) / 10)

            #边界限制
            if curVal < 0:
                curVal = 0
            if curVal >= DIST1_FIX_SUPER_MAX_VAL_M:
                curVal = (DIST1_FIX_SUPER_MAX_VAL_M - 1)

            stop1Count[curVal] = stop1Count[curVal] + 1 #当前叠加(距离1)

    return stop1Count

# 叠加统计分析Stop1范围的叠加
def SuperAnalyse_Stop1RangePoint(orgStop1, front, back):
    global DIST1_RANGE_SUPER_MAX_VAL_M

    stop1Count = np.zeros(DIST1_RANGE_SUPER_MAX_VAL_M) #最大叠加值
    for i in range(len(orgStop1)):
        if int(orgStop1[i]) < (DIST1_RANGE_SUPER_MAX_VAL_M * 10): #限制距离
            curVal = int((orgStop1[i] + 5) / 10)
            start  = curVal - front
            end    = curVal + back

            #边界限制
            if start < 0:
                start = 0
            if end >= DIST1_RANGE_SUPER_MAX_VAL_M:
                end = (DIST1_RANGE_SUPER_MAX_VAL_M - 1)

            for i in range(start, (end + 1)):
                stop1Count[i] = stop1Count[i] + 1

    return stop1Count


# 叠加统计分析Stop2固定的叠加
def SuperAnalyse_Stop2FixPoint(orgStop2):
    global DIST1_FIX_SUPER_MAX_VAL_M

    stop2Count = np.zeros(DIST2_FIX_SUPER_MAX_VAL_M) #最大叠加距离
    for i in range(len(orgStop2)):
        if int(orgStop2[i]) < (DIST2_FIX_SUPER_MAX_VAL_M * 10): #限制距离
            curVal = int((orgStop2[i] + 5) / 10)

            #边界限制
            if curVal < 0:
                curVal = 0
            if curVal >= DIST2_FIX_SUPER_MAX_VAL_M:
                curVal = (DIST2_FIX_SUPER_MAX_VAL_M - 1)

            stop2Count[curVal] = stop2Count[curVal] + 1 #当前叠加(距离1)

    return stop2Count

# 叠加统计分析Stop2范围的叠加
def SuperAnalyse_Stop2RangePoint(orgStop2, front, back):
    global DIST2_RANGE_SUPER_MAX_VAL_M

    stop2Count = np.zeros(DIST2_RANGE_SUPER_MAX_VAL_M) #最大叠加值
    for i in range(len(orgStop2)):
        if int(orgStop2[i]) < (DIST2_RANGE_SUPER_MAX_VAL_M * 10): #限制距离
            curVal = int((orgStop2[i] + 5) / 10)
            start  = curVal - front
            end    = curVal + back

            #边界限制
            if start < 0:
                start = 0
            if end >= DIST2_RANGE_SUPER_MAX_VAL_M:
                end = (DIST2_RANGE_SUPER_MAX_VAL_M - 1)

            for i in range(start, (end + 1)):
                stop2Count[i] = stop2Count[i] + 1

    return stop2Count
七、原始数据形式
第一列:有效数据量
第二列:Stop1
第三列:Stop2
第四列:Stop2-Stop1
第五列:有效脉冲数
第六列:有效回波数
第七列:Stop1数量
第八列:Stop2数量
Near Mode......APDHV:972   TXHV:612   VBAT:4073   T:243
[000]62    , 195   , 133   , 000,00 , 01,01
[001]63    , 196   , 133   , 001,00 , 01,01
[002]63    , 196   , 133   , 002,00 , 01,01
[003]63    , 197   , 134   , 003,00 , 01,01
[004]62    , 196   , 134   , 004,00 , 01,01
[005]64    , 196   , 132   , 005,00 , 01,01
[006]64    , 195   , 131   , 006,00 , 01,01
[007]64    , 196   , 132   , 007,00 , 01,01
[008]63    , 196   , 133   , 008,00 , 01,01
[009]64    , 196   , 132   , 009,00 , 01,01
[010]64    , 197   , 133   , 010,00 , 01,01
[011]64    , 196   , 132   , 011,00 , 01,01
[012]64    , 196   , 132   , 012,00 , 01,01
[013]64    , 196   , 132   , 013,00 , 01,01
[014]64    , 196   , 132   , 014,00 , 01,01
[015]65    , 196   , 131   , 015,00 , 01,01
[016]64    , 196   , 132   , 016,00 , 01,01
[017]64    , 196   , 132   , 017,00 , 01,01
[018]64    , 195   , 131   , 018,00 , 01,01
[019]63    , 196   , 133   , 019,00 , 01,01
[020]64    , 196   , 132   , 020,00 , 01,01
[021]64    , 196   , 132   , 021,00 , 01,01
[022]64    , 196   , 132   , 022,00 , 01,01
[023]64    , 196   , 132   , 023,00 , 01,01
[024]64    , 196   , 132   , 024,00 , 01,01
[025]65    , 196   , 131   , 025,00 , 01,01
[026]65    , 196   , 131   , 026,00 , 01,01
[027]65    , 195   , 130   , 027,00 , 01,01
[028]66    , 196   , 130   , 028,00 , 01,01
[029]66    , 196   , 130   , 029,00 , 01,01
[030]66    , 195   , 129   , 030,00 , 01,01
[031]66    , 196   , 130   , 031,00 , 01,01
[032]66    , 195   , 129   , 032,00 , 01,01
[033]67    , 195   , 128   , 033,00 , 01,01
[034]66    , 195   , 129   , 034,00 , 01,01
[035]67    , 195   , 128   , 035,00 , 01,01
[036]67    , 195   , 128   , 036,00 , 01,01
[037]67    , 195   , 128   , 037,00 , 01,01
[038]67    , 195   , 128   , 038,00 , 01,01
[039]67    , 195   , 128   , 039,00 , 01,01
[040]66    , 196   , 130   , 040,00 , 01,01
[041]66    , 194   , 128   , 041,00 , 01,01
[042]65    , 195   , 130   , 042,00 , 01,01
[043]66    , 195   , 129   , 043,00 , 01,01
[044]66    , 194   , 128   , 044,00 , 01,01
[045]65    , 195   , 130   , 045,00 , 01,01
[046]65    , 195   , 130   , 046,00 , 01,01
[047]65    , 195   , 130   , 047,00 , 01,01
[048]65    , 194   , 129   , 048,00 , 01,01
[049]65    , 196   , 131   , 049,00 , 01,01
[000] OrgDat TxPlus:50 GrpCount:50 RxDatCount:50   RxPWM:75  VthPWM:470  APDHV:973   TXHV:613   VBAT:4071
MinOrgDist:30  MaxOrgDist:560
八、 测试结果
![[<span style='color:red;'>图像</span><span style='color:red;'>处理</span>] MFC载入<span style='color:red;'>图片</span><span style='color:red;'>并</span><span style='color:red;'>绘制</span>ROI矩形](https://img-blog.csdnimg.cn/direct/c7c34f185b1642e8a1cb3b56e1113893.png)