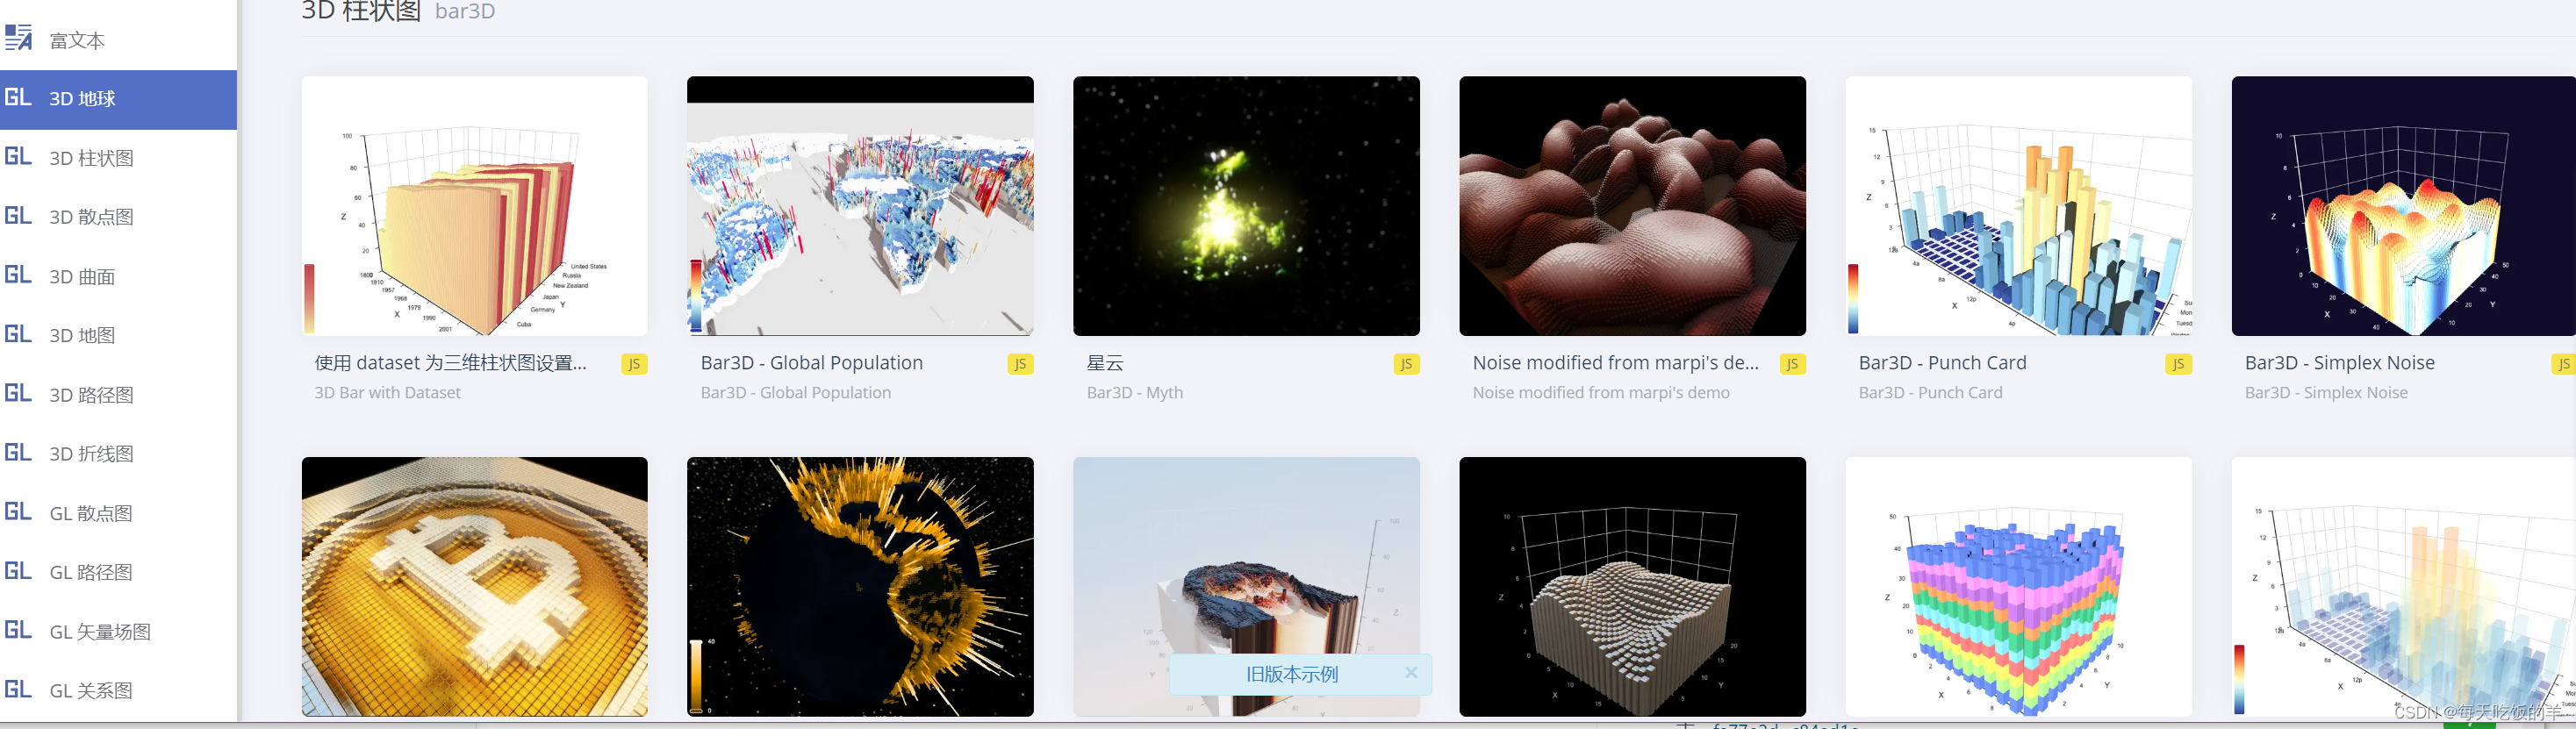
之前也有使用过echarts开发项目中涉及到的地图功能,当时使用geo来实现地图轮廓,看上去有种3d的感觉。最近闲来无事看了一份可视化大屏的UI设计图,感觉3d旋转地图挺好玩的,今天就来尝试实现下。
首先安装下echarts和echarts-gl依赖,在这里注意的点是,echarts-gl版本可以安装低版本,默认安装的依赖版本运行后一直报错。
$ npm install echarts@4.2.1 echarts-gl@1.1.0
安装好依赖,在页面引入
import echarts from 'echarts';
import 'echarts-gl';
import beijingJson from '../../src/api/beijing.json';
接下来我们看下完整的代码
<template>
	<div style="width: 100%; height:100%;">
		<div id="echarts" ref="myEcharts" style="width: 100%; height:100%;"></div>
	</div>
</template>
<script>
	import echarts from 'echarts';
	import 'echarts-gl';
	import beijingJson from '../../src/api/beijing.json';
	export default {

		data() {

			return {

			}
		},
		methods: {

			init() {

				let that = this;
				echarts.registerMap('beijing', beijingJson);
				that.option = {

					tooltip: {

						show: true,
						formatter: function(params) {

							let value = params.data.value;
							return params.seriesName + ':' + value[2];
						}
					},
					geo3D: {

						map: 'beijing',
						boxWidth: 70,
						boxHeight: 6,
						boxDepth: 70,
						realisticMaterial: {

							roughness:1,//粗糙度,0为完全光滑,1完全粗糙
							textureTiling: 32 //材质细节纹理的平铺
						},
						//光源的设置
						light: {

							main: {

								intensity: 1,
								shadow: true,
								alpha: 150,
								beta: 170
							},
							ambient: {

								intensity: 0
							}
						},
						//地面的背景颜色
						groundPlane: {

							show: true,
							color: 'transparent'
						},
						//特效设置
						postEffect: {

							enable: true
						},
						//标签样式
						label: {

							show: true,
							formatter: function(params) {

								var content = '',
									content = params.name;
								return content;
							},
							distance: 0,
							textStyle: {

								color: '#ffffff',
								fontWeight: 'normal',
								fontSize: 16,
								backgroundColor: 'rgba(255,255,255,0)'
							},
						},
						itemStyle: {

							color: '#73a4ff',
							borderColor: 'rgb(62,215,213)',
							borderWidth: 1
						},
						emphasis: {

							label: {

								show: true,
								distance: 10
							},
							itemStyle: {

								color: '#3b7efc',
							}
						},
						// 用于鼠标的旋转,缩放等视角控制。
						viewControl: {

							projection: "perspective", // 投影方式,默认为透视投影'perspective',也支持设置为正交投影'orthographic'。
							autoRotate: true,
							//更多配置可自行查询添加,
						}
					},
					series: []
				};

				let initEcharts = echarts.init(that.$refs.myEcharts);
				initEcharts.setOption(that.option);
			}

		},
		mounted() {

			this.$nextTick(() => {

				this.init();
			})
		}
	}
</script>
看完代码后对于之前做过地图的同学来说是不是和echarts没啥区别,只是多了一个geo3D的属性。geo3D是否显示三维地理坐标系组件,这也是实现3d地图的主要属性,针对geo3d中每个属性的功能大家可以在echarts文档进行查阅,这里我就不一一细说了。
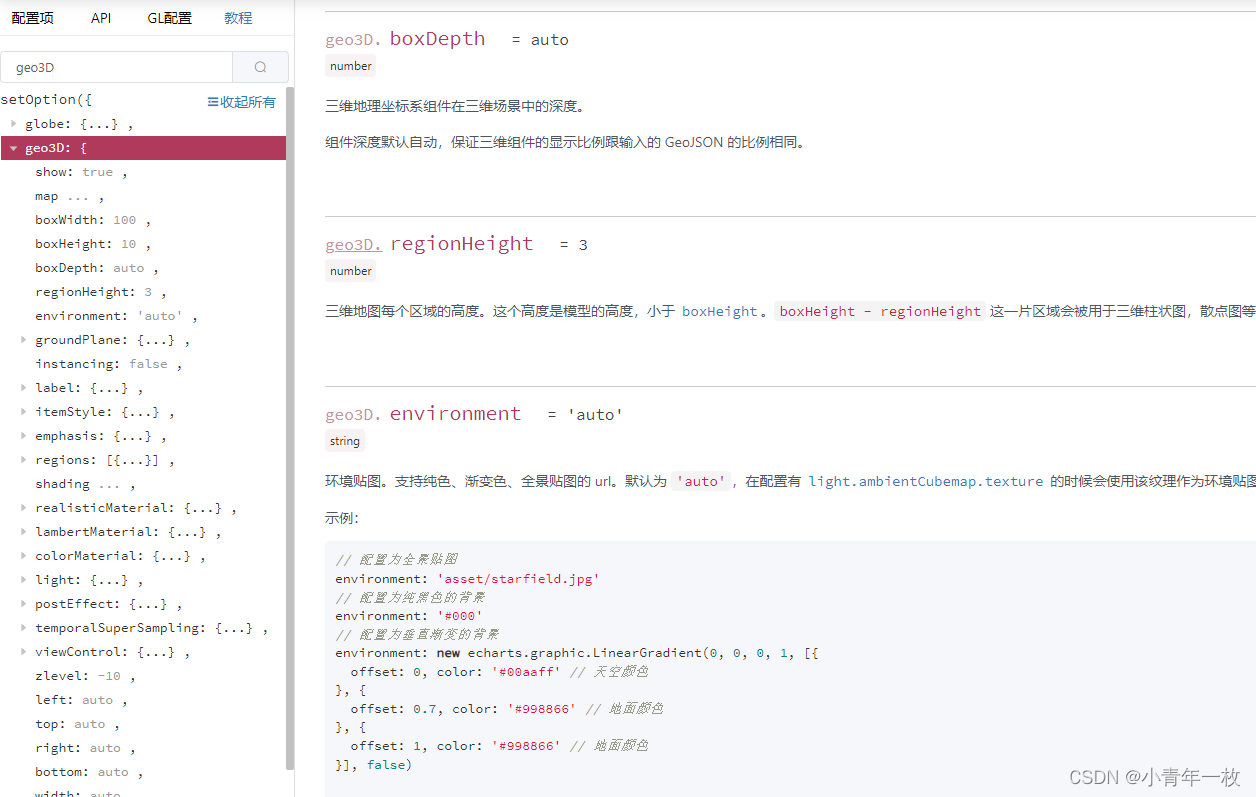
这里把文档地址给大家贴出来了,大家可以查看文档,这样实现起来更快捷。https://echarts.apache.org/zh/option-gl.html#geo3D
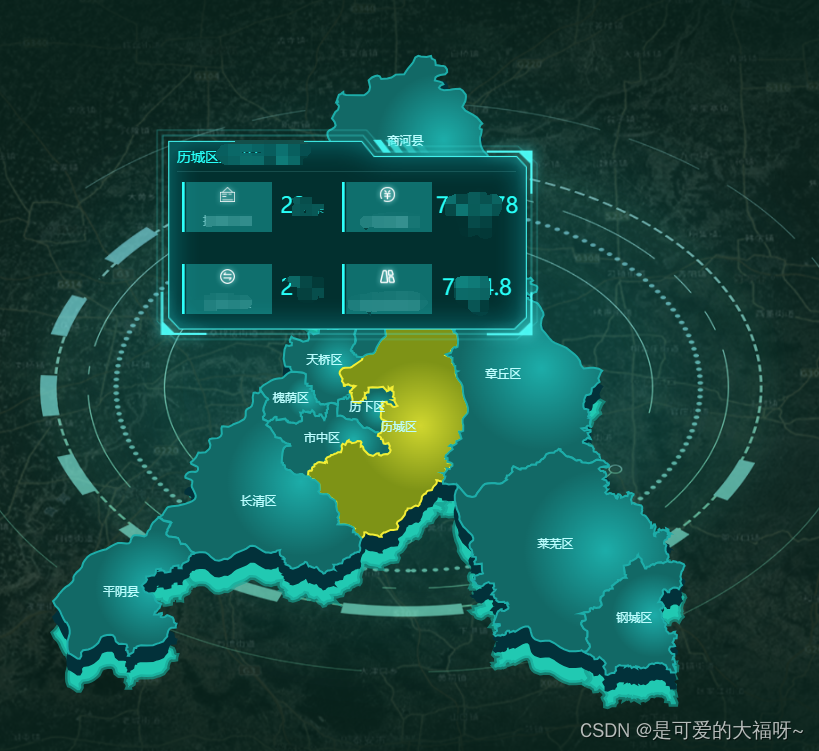
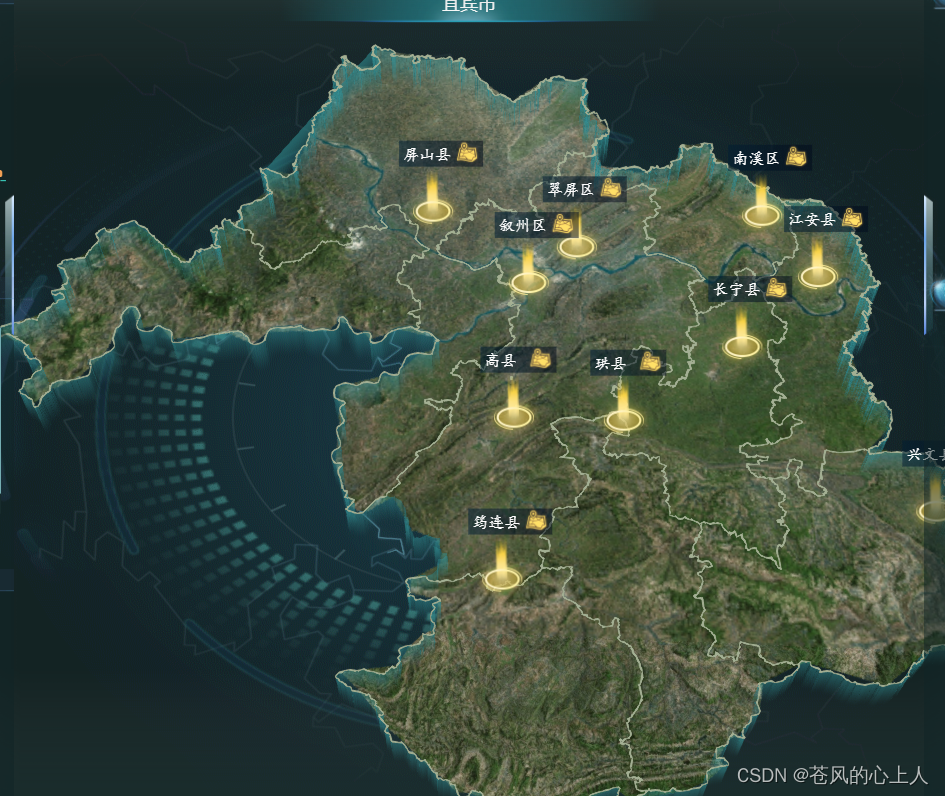
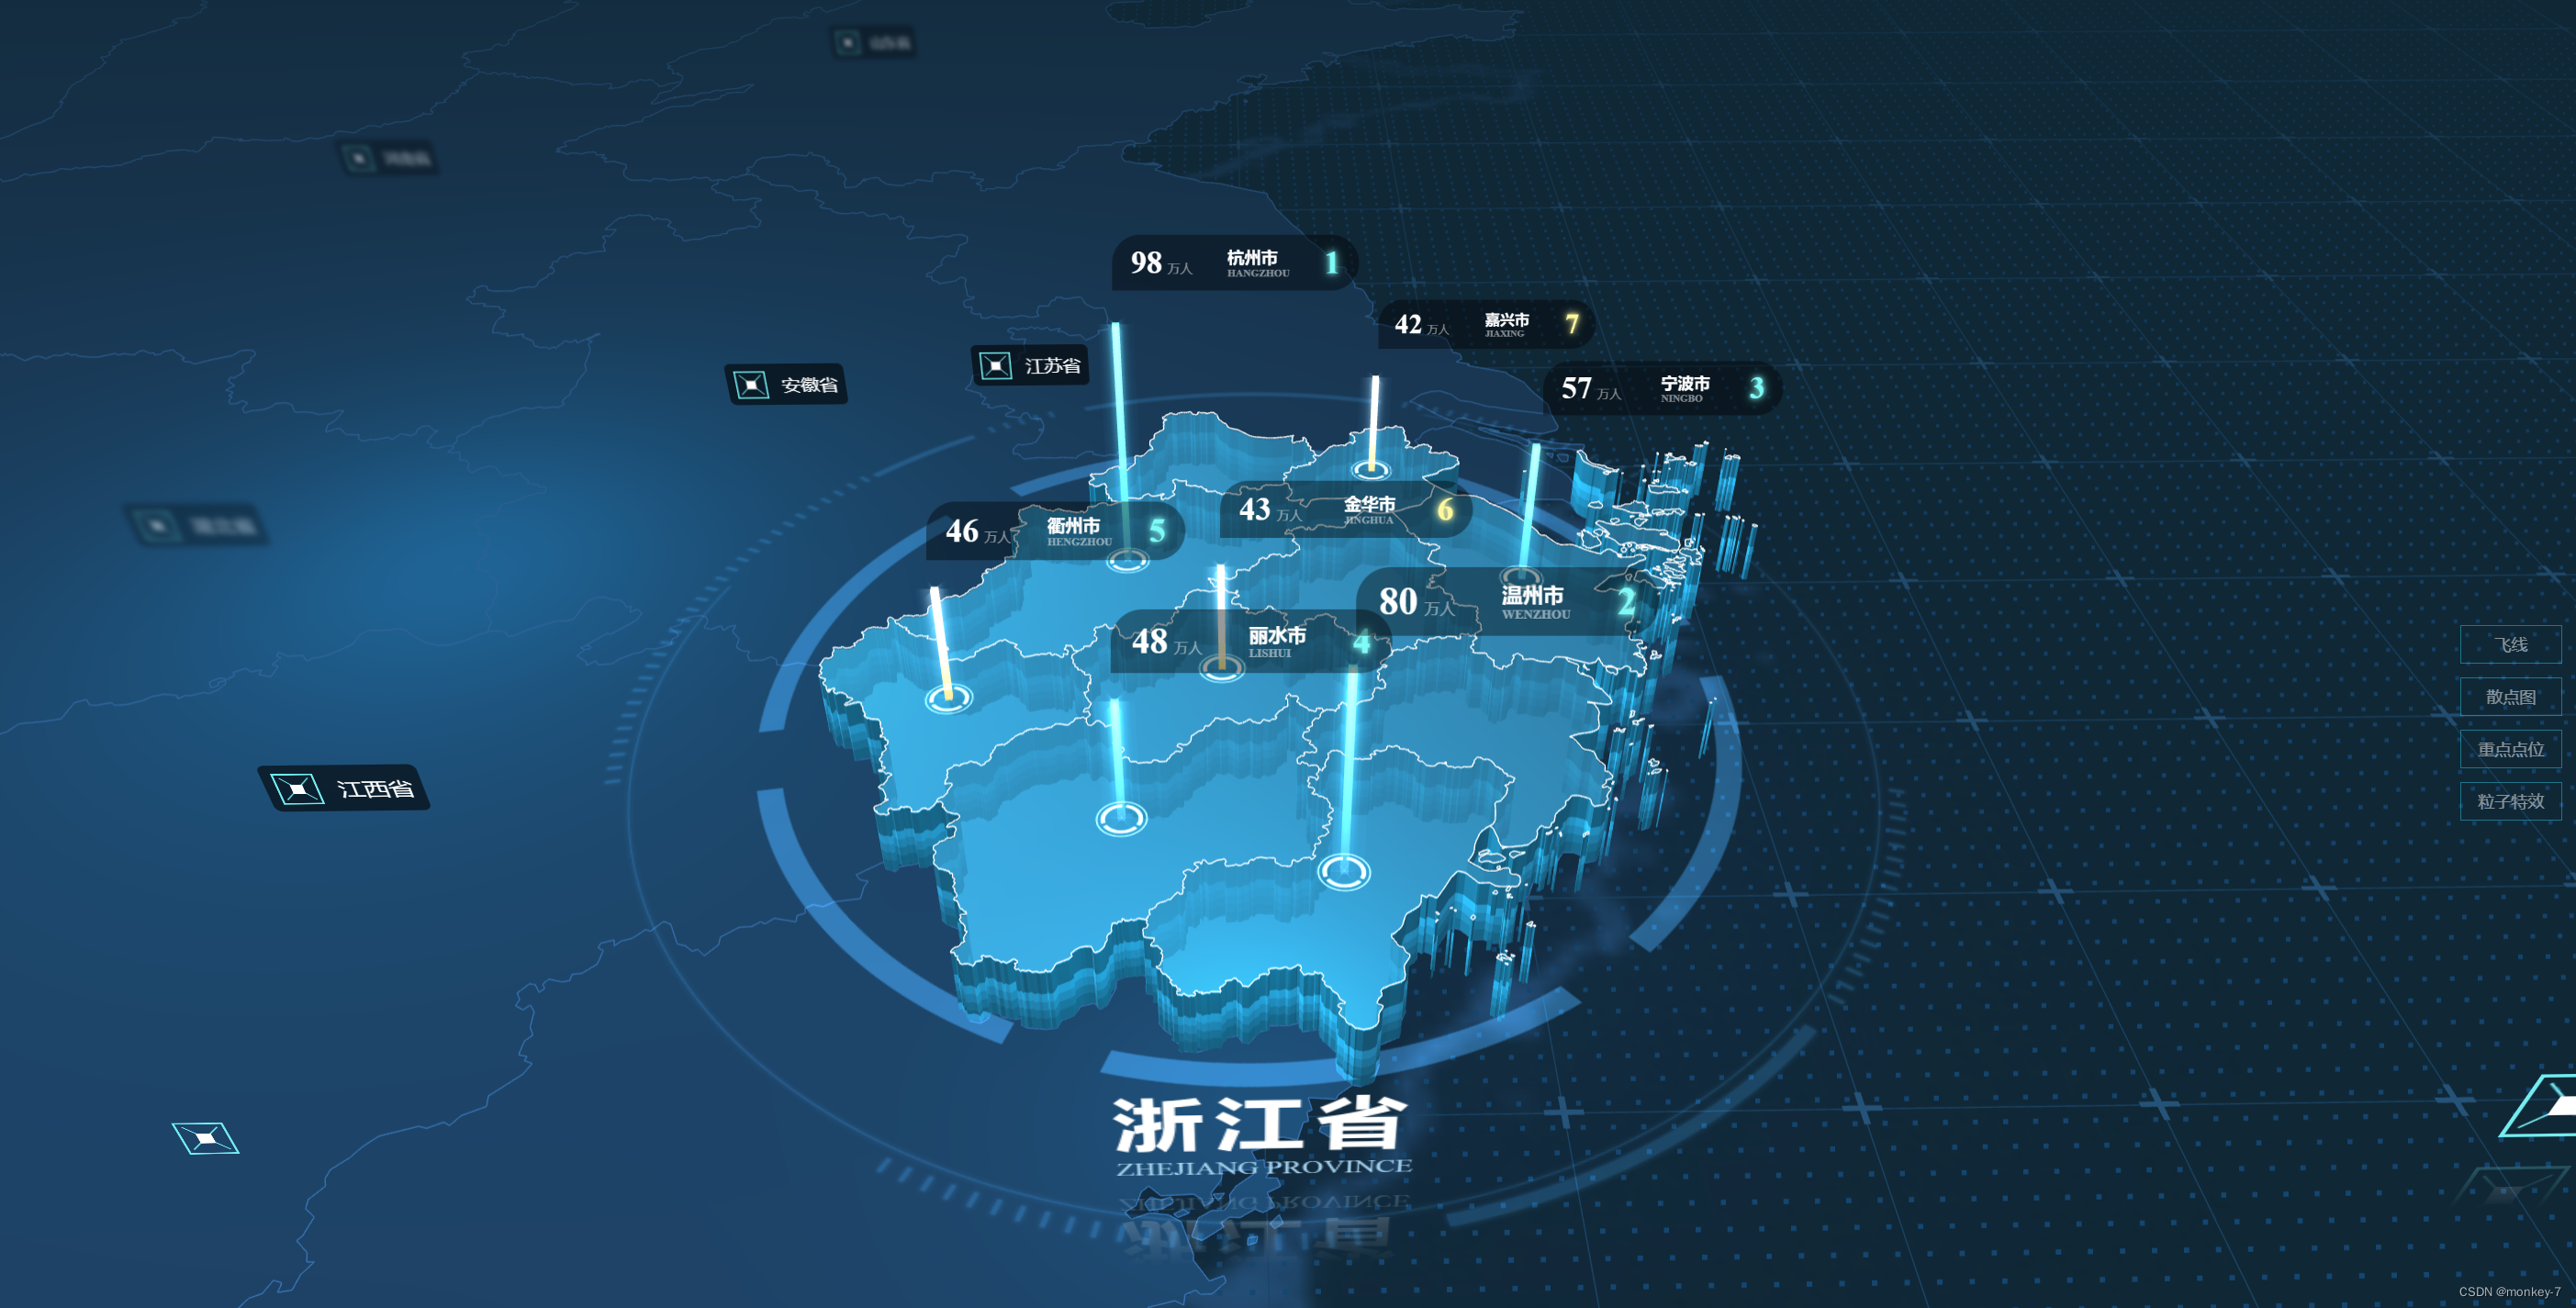
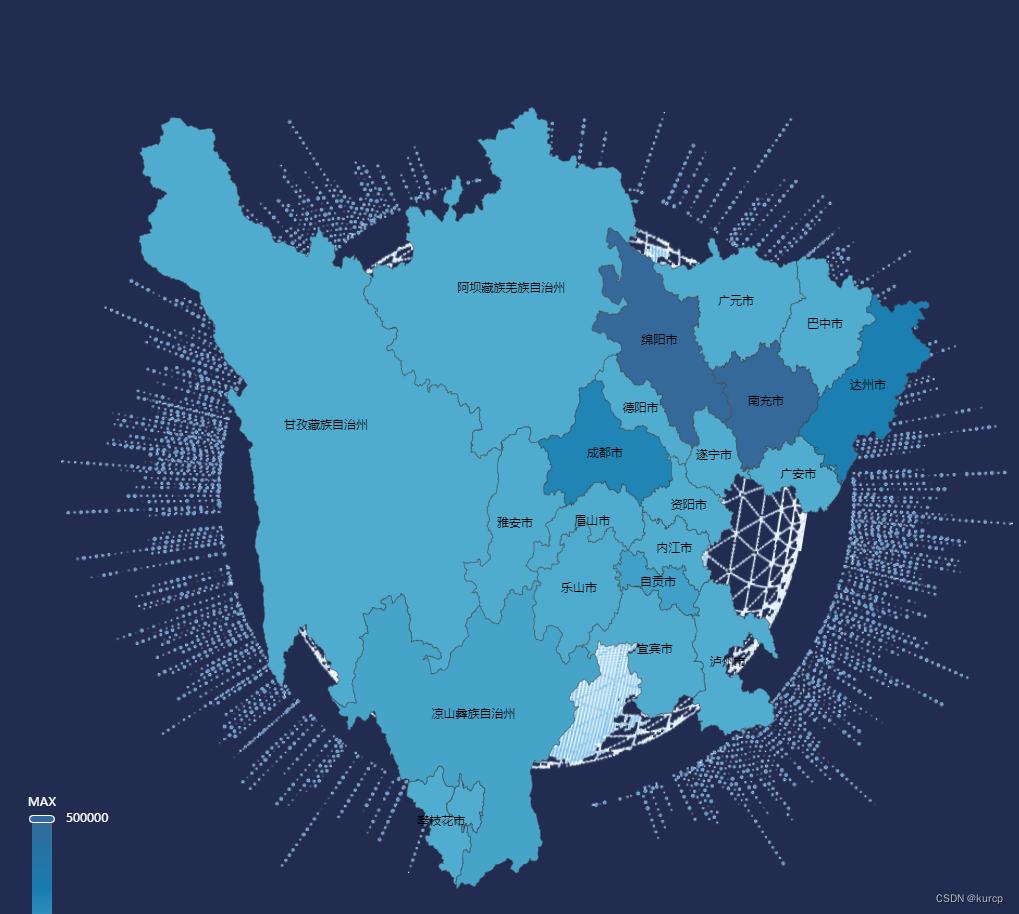
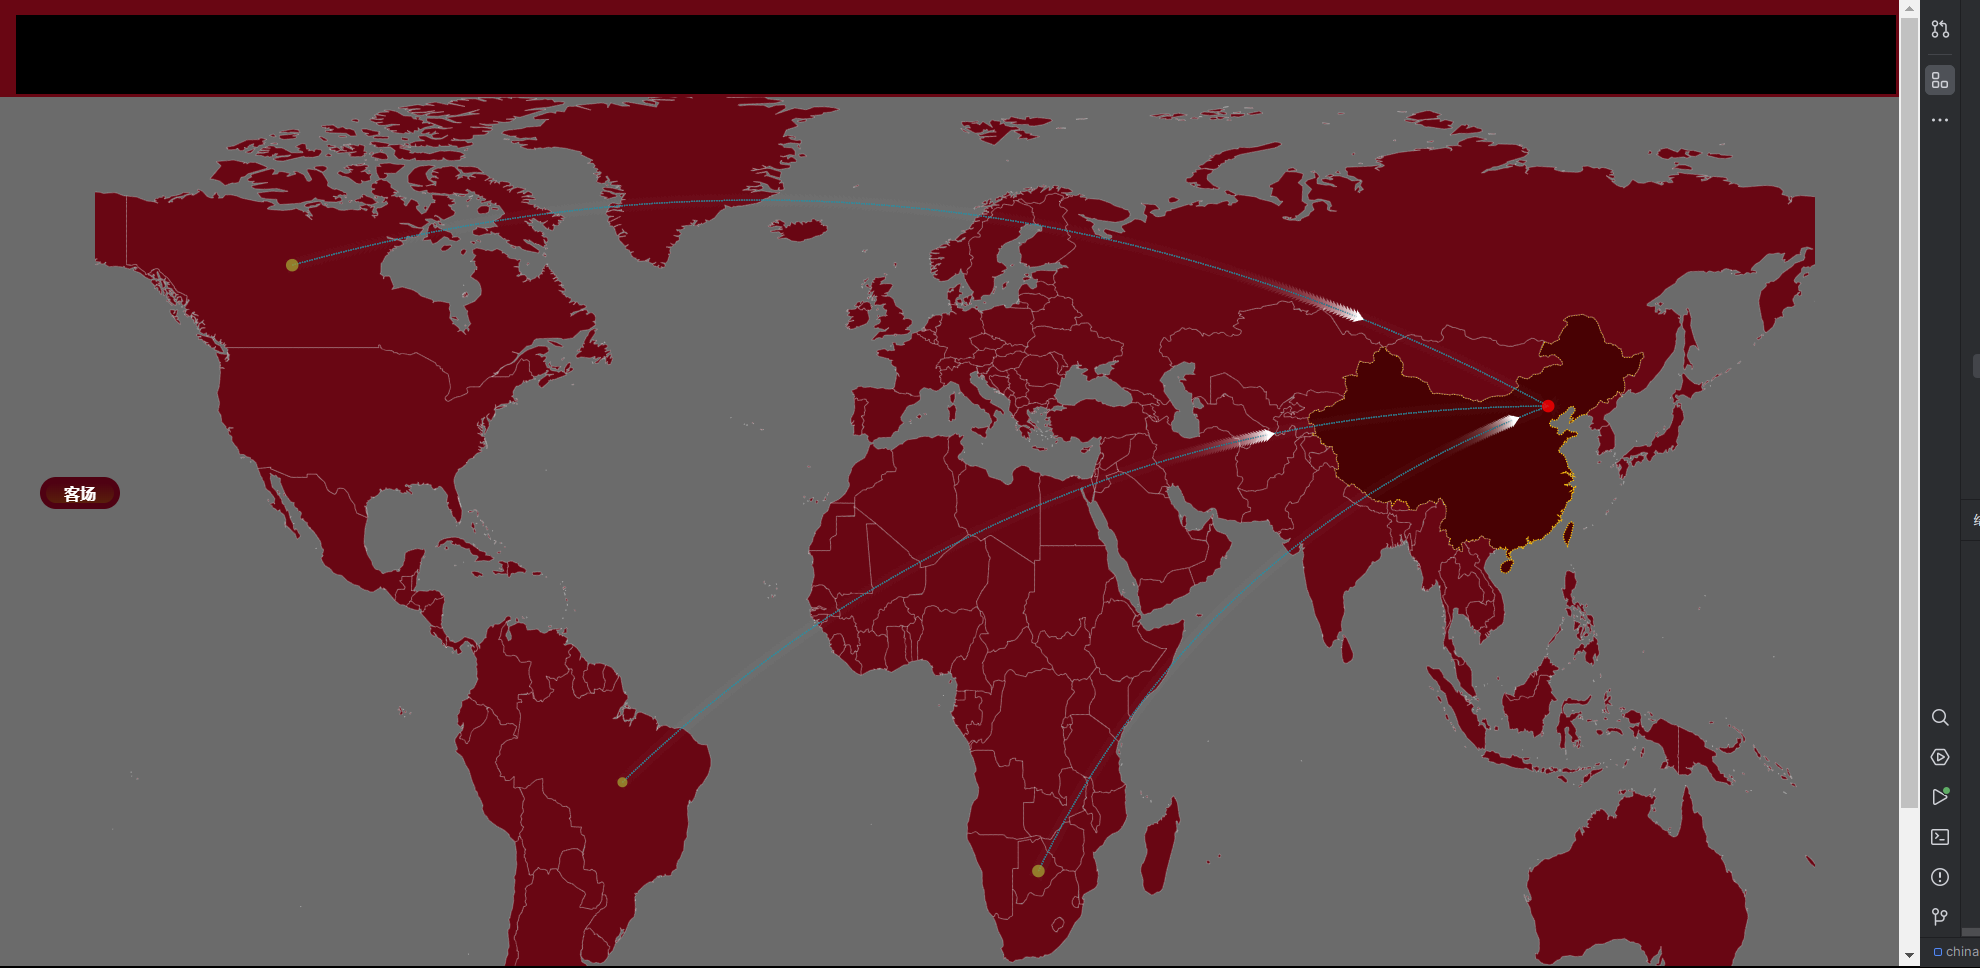
最终效果:

这里我截图展示的,需要看地图动效的,大家可以在本地运行看下地图自动旋转效果。


![[C++]使用纯opencv部署yolov8旋转框目标检测](https://img-blog.csdnimg.cn/direct/e509302a23f34c52aeb473fab2d4a092.jpeg)