<template>
<div class="container">
<div id="myChart4" class="echarts"></div>
</div>
</template>
<script>
import * as echarts from 'echarts';
import 'echarts-gl';
export default {
data() {
return {
optionData: [
{
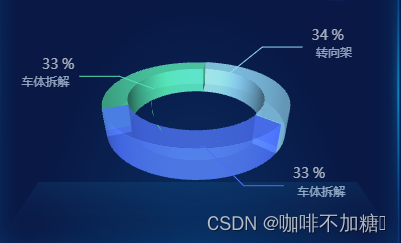
name: "转向架", value: 34 , itemStyle: {
color: "#91D9FE",opacity:0.65 } },
{
name: "车体拆解", value: 33 , itemStyle: {
color: "#54E1AE",opacity:0.65 } },
{
name: "车体拆解", value: 33, itemStyle: {
color: "#496FF4",opacity:0.65} },
],
}
},
watch: {
chartData: {
deep: true,
handler(val) {
this.setOption(val)
}
}
},
mounted() {
this.initChart();
},
beforeDestroy() {
},
methods: {
initChart() {
let myChart = echarts.init(document.getElementById('myChart4'));
this.option = this.getPie3D(this.optionData, 0.85);
myChart.setOption(this.option);
this.option.series.push({
label: {
show: true,
position: "outside",
color:'auto',
formatter: function (v) {
return `{a| ${
v.percent}} {b|%}\n {c|${
v.data.name}}`;
},
rich: {
a: {
color:'#fff',
fontSize:14
},
b:{
color:'#fff',
fontSize:14
},
c:{
fontSize:12,
padding:5,
color:'#D8EFFF',
}
},
},
labelLine:{
show: true,
length:'10%',
length2:'10%',
lineStyle:{
width:1
}
},
type: 'pie',
startAngle: -20,
clockwise: false,
radius: ["35%", "35%"],
center: ["50%", "42%"],
data: this.optionData,
itemStyle: {
opacity: 0
},
hoverAnimation:false
});
myChart.setOption(this.option);
this.bindListen(myChart);
},
getPie3D(pieData, internalDiameterRatio) {
let that = this;
let series = [];
let sumValue = 0;
let startValue = 0;
let endValue = 0;
let legendData = [];
let legendBfb = [];
let k = 1 - internalDiameterRatio;
pieData.sort((a, b) => {
return (b.value - a.value);
});
for (let i = 0; i < pieData.length; i++) {
sumValue += pieData[i].value;
let seriesItem = {
name: typeof pieData[i].name === 'undefined' ? `series${
i}` : pieData[i].name,
type: 'surface',
parametric: true,
wireframe: {
show: false
},
pieData: pieData[i],
pieStatus: {
selected: false,
hovered: false,
k: k
},
};
if (typeof pieData[i].itemStyle != 'undefined') {
let itemStyle = {
};
typeof pieData[i].itemStyle.color != 'undefined' ? itemStyle.color = pieData[i].itemStyle.color :
null;
typeof pieData[i].itemStyle.opacity != 'undefined' ? itemStyle.opacity = pieData[i].itemStyle
.opacity : null;
seriesItem.itemStyle = itemStyle;
}
series.push(seriesItem);
}
legendData = [];
legendBfb = [];
for (let i = 0; i < series.length; i++) {
endValue = startValue + series[i].pieData.value;
series[i].pieData.startRatio = startValue / sumValue;
series[i].pieData.endRatio = endValue / sumValue;
series[i].parametricEquation = this.getParametricEquation(series[i].pieData.startRatio, series[i]
.pieData.endRatio,
false, false, k, series[i].pieData.value);
startValue = endValue;
let bfb = that.fomatFloat(series[i].pieData.value / sumValue, 4);
legendData.push({
name: series[i].name,
value: bfb
});
legendBfb.push({
name: series[i].name,
value: bfb
});
}
let boxHeight = this.getHeight3D(series, 12);
let option = {
legend: {
show:false,
data:[],
itemHeight: 10,
itemWidth: 10,
top: 130,
itemGap: 8,
textStyle: {
color: '#A1E2FF',
},
show: true,
formatter: function(name) {
var target;
for (var i = 0, l = pieData.length; i < l; i++) {
if (pieData[i].name == name) {
target = pieData[i].value;
}
}
return `${
name}: ${
target} %`;
}
},
tooltip: {
show:false,
formatter: params => {
if (params.seriesName !== 'mouseoutSeries' && params.seriesName !== 'pie2d') {
let bfb = ((option.series[params.seriesIndex].pieData.endRatio - option.series[
params.seriesIndex].pieData.startRatio) *
100).toFixed(0);
return `${
params.seriesName}<br/>` +
`<span style="display:inline-block;margin-right:5px;border-radius:10px;width:10px;height:10px;background-color:${
params.color};"></span>` +
`${
bfb }%`;
}
}
},
xAxis3D: {
min: -1,
max: 1
},
yAxis3D: {
min: -1,
max: 1
},
zAxis3D: {
min: -1,
max: 1
},
grid3D: {
show: false,
boxHeight: boxHeight,
left: 0,
top: -10,
viewControl: {
alpha: 30,
distance: 180,
rotateSensitivity: 0,
zoomSensitivity: 0,
panSensitivity: 0,
autoRotate: false,
}
},
series: series
};
return option;
},
getHeight3D(series, height) {
series.sort((a, b) => {
return (b.pieData.value - a.pieData.value);
})
return height * 25 / series[0].pieData.value;
},
getParametricEquation(startRatio, endRatio, isSelected, isHovered, k, h) {
let midRatio = (startRatio + endRatio) / 2;
let startRadian = startRatio * Math.PI * 2;
let endRadian = endRatio * Math.PI * 2;
let midRadian = midRatio * Math.PI * 2;
if (startRatio === 0 && endRatio === 1) {
isSelected = false;
}
k = typeof k !== 'undefined' ? k : 1 / 3;
let offsetX = isSelected ? Math.cos(midRadian) * 0.1 : 0;
let offsetY = isSelected ? Math.sin(midRadian) * 0.1 : 0;
let hoverRate = isHovered ? 1.05 : 1;
return {
u: {
min: -Math.PI,
max: Math.PI * 3,
step: Math.PI / 32
},
v: {
min: 0,
max: Math.PI * 2,
step: Math.PI / 20
},
x: function(u, v) {
if (u < startRadian) {
return offsetX + Math.cos(startRadian) * (1 + Math.cos(v) * k) * hoverRate;
}
if (u > endRadian) {
return offsetX + Math.cos(endRadian) * (1 + Math.cos(v) * k) * hoverRate;
}
return offsetX + Math.cos(u) * (1 + Math.cos(v) * k) * hoverRate;
},
y: function(u, v) {
if (u < startRadian) {
return offsetY + Math.sin(startRadian) * (1 + Math.cos(v) * k) * hoverRate;
}
if (u > endRadian) {
return offsetY + Math.sin(endRadian) * (1 + Math.cos(v) * k) * hoverRate;
}
return offsetY + Math.sin(u) * (1 + Math.cos(v) * k) * hoverRate;
},
z: function(u, v) {
if (u < -Math.PI * 0.5) {
return Math.sin(u);
}
if (u > Math.PI * 2.5) {
return Math.sin(u) * h * .1;
}
return Math.sin(v) > 0 ? 1 * h * .1 : -1;
}
};
},
fomatFloat(num, n) {
var f = parseFloat(num);
if (isNaN(f)) {
return false;
}
f = Math.round(num * Math.pow(10, n)) / Math.pow(10, n);
var s = f.toString();
var rs = s.indexOf('.');
if (rs < 0) {
rs = s.length;
s += '.';
}
while (s.length <= rs + n) {
s += '0';
}
return s;
},
bindListen(myChart) {
let that = this;
let selectedIndex = '';
let hoveredIndex = '';
myChart.on('click', function(params) {
let isSelected = !that.option.series[params.seriesIndex].pieStatus.selected;
let isHovered = that.option.series[params.seriesIndex].pieStatus.hovered;
let k = that.option.series[params.seriesIndex].pieStatus.k;
let startRatio = that.option.series[params.seriesIndex].pieData.startRatio;
let endRatio = that.option.series[params.seriesIndex].pieData.endRatio;
if (selectedIndex !== '' && selectedIndex !== params.seriesIndex) {
that.option.series[selectedIndex].parametricEquation = that.getParametricEquation(that
.option.series[
selectedIndex].pieData
.startRatio, that.option.series[selectedIndex].pieData.endRatio, false, false, k,
that.option.series[
selectedIndex].pieData
.value);
that.option.series[selectedIndex].pieStatus.selected = false;
}
that.option.series[params.seriesIndex].parametricEquation = that.getParametricEquation(
startRatio, endRatio,
isSelected,
isHovered, k, that.option.series[params.seriesIndex].pieData.value);
that.option.series[params.seriesIndex].pieStatus.selected = isSelected;
isSelected ? selectedIndex = params.seriesIndex : null;
myChart.setOption(that.option);
});
myChart.on('mouseover', function(params) {
let isSelected;
let isHovered;
let startRatio;
let endRatio;
let k;
if (hoveredIndex === params.seriesIndex) {
return;
} else {
if (hoveredIndex !== '') {
isSelected = that.option.series[hoveredIndex].pieStatus.selected;
isHovered = false;
startRatio = that.option.series[hoveredIndex].pieData.startRatio;
endRatio = that.option.series[hoveredIndex].pieData.endRatio;
k = that.option.series[hoveredIndex].pieStatus.k;
that.option.series[hoveredIndex].parametricEquation = that.getParametricEquation(
startRatio, endRatio,
isSelected,
isHovered, k, that.option.series[hoveredIndex].pieData.value);
that.option.series[hoveredIndex].pieStatus.hovered = isHovered;
hoveredIndex = '';
}
if (params.seriesName !== 'mouseoutSeries' && params.seriesName !== 'pie2d') {
isSelected = that.option.series[params.seriesIndex].pieStatus.selected;
isHovered = true;
startRatio = that.option.series[params.seriesIndex].pieData.startRatio;
endRatio = that.option.series[params.seriesIndex].pieData.endRatio;
k = that.option.series[params.seriesIndex].pieStatus.k;
that.option.series[params.seriesIndex].parametricEquation = that.getParametricEquation(
startRatio, endRatio,
isSelected, isHovered, k, that.option.series[params.seriesIndex].pieData
.value + 5);
that.option.series[params.seriesIndex].pieStatus.hovered = isHovered;
hoveredIndex = params.seriesIndex;
}
myChart.setOption(that.option);
}
});
myChart.on('globalout', function() {
let isSelected;
let isHovered;
let startRatio;
let endRatio;
let k;
if (hoveredIndex !== '') {
isSelected = that.option.series[hoveredIndex].pieStatus.selected;
isHovered = false;
k = that.option.series[hoveredIndex].pieStatus.k;
startRatio = that.option.series[hoveredIndex].pieData.startRatio;
endRatio = that.option.series[hoveredIndex].pieData.endRatio;
that.option.series[hoveredIndex].parametricEquation = that.getParametricEquation(
startRatio, endRatio,
isSelected,
isHovered, k, that.option.series[hoveredIndex].pieData.value);
that.option.series[hoveredIndex].pieStatus.hovered = isHovered;
hoveredIndex = '';
}
myChart.setOption(that.option);
});
},
},
}
</script>
<style lang="scss" scoped>
.container{
width: 12rem;
height: 7.62rem;
margin: 0 auto;
position: relative;
}
.echarts{
width: 12rem;
height: 7.62rem;
position: absolute;
z-index: 2;
}
</style>