1、actuator简介
微服务的特点决定了功能模块的部署是分布式的,大部分功能模块都是运行在不同的机器上,彼此通过服务调用进行交互,前后台的业务流会经过很多个微服务的处理和传递,出现了异常如何快速定位是哪个环节出现了问题?
在这种框架下,微服务的监控显得尤为重要。Spring Boot Actuator 模块提供了生产级别的监控功能,比如健康检查,审计,指标收集,HTTP 跟踪等,帮助我们监控和管理Spring Boot 应用。
这个模块是一个采集应用内部信息暴露给外部的模块,上述的功能都可以通过HTTP 和 JMX 访问。因为暴露内部信息的特性,Actuator 也可以和一些外部的应用监控系统整合(Prometheus, Graphite, DataDog, Influx, Wavefront, New Relic等)。
这些监控系统提供了出色的仪表板,图形,分析和警报,可帮助你通过一个统一友好的界面,监视和管理你的应用程序。
Actuator使用Micrometer与这些外部应用程序监视系统集成。这样一来,只需很少的配置即可轻松集成外部的监控系统。
Micrometer 为 Java 平台上的性能数据收集提供了一个通用的 API,应用程序只需要使用 Micrometer 的通用 API 来收集性能指标即可。
Micrometer 会负责完成与不同监控系统的适配工作。这就使得切换监控系统变得很容易。
通过引入spring-boot-starter-actuator,可以使用Spring Boot为我们提供的准生产环境下的应用监控和管理功能。我们可以通过HTTP,JMX,SSH协议来进行操作,自动得到审计、健康及指标信息等,引入spring-boot-starter-actuator通过http方式访问监控端点
可进行shutdown(POST 提交,此端点默认关闭)
1.1SpringBoot Actuator的使用
在Spring boot应用中,要实现可监控的功能,依赖的是 spring-boot-starter-actuator 这个组件。它提供了很多监控和管理你的spring boot应用的HTTP或者JMX端点,并且你可以有选择地开启和关闭部分功能。当你的spring boot应用中引入下面的依赖之后,将自动的拥有审计、健康检查、Metrics监控功能。
<!-- web start-->
<dependency>
<groupId>org.springframework.boot</groupId>
<artifactId>spring-boot-starter-web</artifactId>
</dependency>
<!-- web end-->
<!-- actuator start-->
<dependency>
<groupId>org.springframework.boot</groupId>
<artifactId>spring-boot-starter-actuator</artifactId>
</dependency>
<!-- actuator end-->
具体的使用方法:引入上述的依赖jar
通过下面的配置启用所有的监控端点,默认情况下,这些端点是禁用的;
management:
endpoints:
web:
exposure:
include: "*"
# “*”号代表启用所有的监控端点,可以单独启用,例如,`health`,`info`,`metrics`等
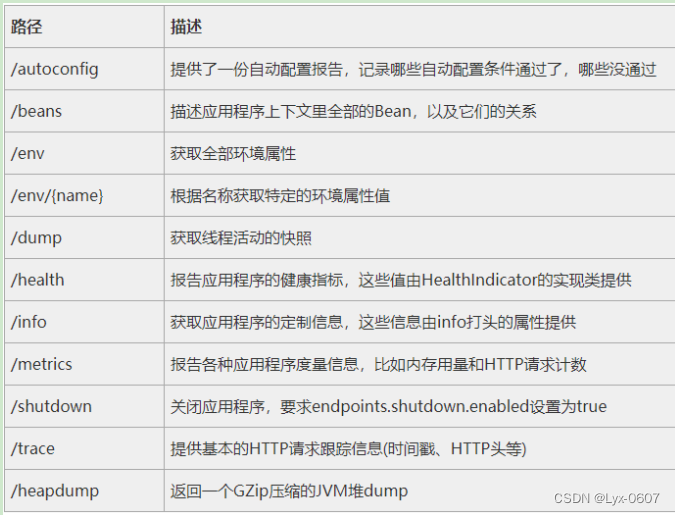
Actuator 的 REST 接口
Actuator 监控分成两类:原生端点和用户自定义端点;自定义端点主要是指扩展性,用户可以根据自己的实际应用,定义一些比较关心的指标,在运行期进行监控。原生端点是在应用程序里提供众多 Web 接口,通过它们了解应用程序运行时的内部状况。原生端点又可以分成三类:
应用配置类:可以查看应用在运行期的静态信息:例如自动配置信息、加载的 springbean 信息、yml 文件配置信息、环境信息、请求映射信息;
度量指标类:主要是运行期的动态信息,例如堆栈、请求连、一些健康指标、metrics 信息等;
操作控制类:主要是指 shutdown,用户可以发送一个请求将应用的监控功能关闭。
Actuator 提供了 13 个接口,具体如下表所示。
HTTP 方法 路径 描述
GET /auditevents 显示应用暴露的审计事件 (比如认证进入、订单失败)
GET /beans 描述应用程序上下文里全部的 Bean,以及它们的关系
GET /conditions 就是 1.0 的 /autoconfig ,提供一份自动配置生效的条件情况,记录哪些自动配置条件通过了,哪些没通过
GET /configprops 描述配置属性(包含默认值)如何注入Bean
GET /env 获取全部环境属性
GET /env/{name} 根据名称获取特定的环境属性值
GET /flyway 提供一份 Flyway 数据库迁移信息
GET /liquidbase 显示Liquibase 数据库迁移的纤细信息
GET /health 报告应用程序的健康指标,这些值由 HealthIndicator 的实现类提供
GET /heapdump dump 一份应用的 JVM 堆信息
GET /httptrace 显示HTTP足迹,最近100个HTTP request/repsponse
GET /info 获取应用程序的定制信息,这些信息由info打头的属性提供
GET /logfile 返回log file中的内容(如果 logging.file 或者 logging.path 被设置)
GET /loggers 显示和修改配置的loggers
GET /metrics 报告各种应用程序度量信息,比如内存用量和HTTP请求计数
GET /metrics/{name} 报告指定名称的应用程序度量值
GET /scheduledtasks 展示应用中的定时任务信息
GET /sessions 如果我们使用了 Spring Session 展示应用中的 HTTP sessions 信息
POST /shutdown 关闭应用程序,要求endpoints.shutdown.enabled设置为true
GET /mappings 描述全部的 URI路径,以及它们和控制器(包含Actuator端点)的映射关系
GET /threaddump 获取线程活动的快照
命令详解
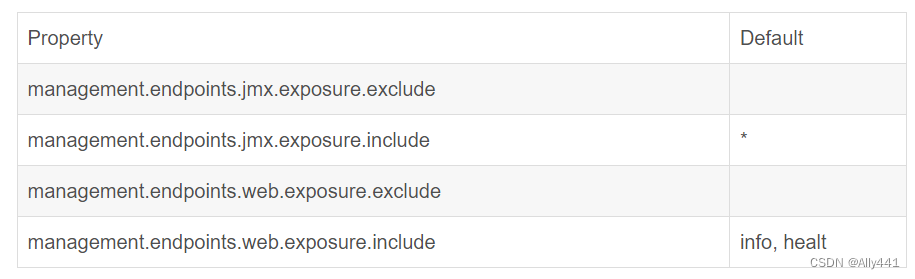
在 Spring Boot 2.x 中为了安全期间,Actuator 只开放了两个端点 /actuator/health 和 /actuator/info。可以在配置文件中设置打开。
可以打开所有的监控点
management.endpoints.web.exposure.include=*
1
也可以选择打开部分
management.endpoints.web.exposure.exclude=beans,trace
Actuator 默认所有的监控点路径都在/actuator/*,当然如果有需要这个路径也支持定制。
management.endpoints.web.base-path=/manage
1
设置完重启后,再次访问地址就会变成/manage/*
Actuator 几乎监控了应用涉及的方方面面,我们重点讲述一些经常在项目中常用的命令。
health
health 主要用来检查应用的运行状态,这是我们使用最高频的一个监控点。通常使用此接口提醒我们应用实例的运行状态,以及应用不”健康“的原因,比如数据库连接、磁盘空间不够等。
默认情况下 health 的状态是开放的,添加依赖后启动项目,访问:http://localhost:8080/actuator/health即可看到应用的状态。
{
"status" : "UP"
}
要想查看详细的应用健康信息需要配置management.endpoint.health.show-details 的值为always,配置之后我们再次访问http://localhost:8080/actuator/health,获取的信息如下:
{
"status": "UP",
"components": {
"diskSpace": {
"status": "UP",
"details": {
"total": 236510507008,
"free": 223361744896,
"threshold": 10485760
}
},
"ping": {
"status": "UP"
}
}
}
Spring boot的健康信息都是从ApplicationContext中的各种HealthIndicator Beans中收集到的,Spring boot框架中包含了大量的HealthIndicators的实现类,当然你也可以实现自己认为的健康状态。默认情况下,最终的 Spring Boot 应用的状态是由 HealthAggregator 汇总而成的,汇总的算法是:
1 设置状态码顺序:setStatusOrder(Status.DOWN, Status.OUT_OF_SERVICE, Status.UP, Status.UNKNOWN);。
2 过滤掉不能识别的状态码。
3 如果无任何状态码,整个 Spring Boot 应用的状态是 UNKNOWN。
4 将所有收集到的状态码按照 1 中的顺序排序。
5 返回有序状态码序列中的第一个状态码,作为整个 Spring Boot 应用的状态。
health 通过合并几个健康指数检查应用的健康情况。Spring boot框架自带的 HealthIndicators 目前包括:
CassandraHealthIndicator Checks that a Cassandra database is up.
DiskSpaceHealthIndicator Checks for low disk space.
DataSourceHealthIndicator Checks that a connection to DataSource can be obtained.
ElasticsearchHealthIndicator Checks that an Elasticsearch cluster is up.
InfluxDbHealthIndicator Checks that an InfluxDB server is up.
JmsHealthIndicator Checks that a JMS broker is up.
MailHealthIndicator Checks that a mail server is up.
MongoHealthIndicator Checks that a Mongo database is up.
Neo4jHealthIndicator Checks that a Neo4j server is up.
RabbitHealthIndicator Checks that a Neo4j server is up.
RedisHealthIndicator Checks that a Redis server is up.
SolrHealthIndicator Checks that a Solr server is up.
举个例子,如果你的应用使用 Redis,RedisHealthindicator 将被当作检查的一部分;如果使用 MongoDB,那么MongoHealthIndicator 将被当作检查的一部分。
可以在配置文件中关闭特定的健康检查指标,比如关闭 redis 的健康检查:
management.health.redise.enabled=false
默认,所有的这些健康指标被当作健康检查的一部分。自定义 HealthIndicator 健康检查
有时候需要提供自定义的健康状态检查信息,你可以通过实现HealthIndicator的接口来实现,并将该实现类注册为spring bean。你需要实现其中的health()方法,并返回自定义的健康状态响应信息,该响应信息应该包括一个状态码和要展示详细信息。例如,下面就是一个接口HealthIndicator的实现类:
@Component
public class MyHealthIndicator implements HealthIndicator {@Override
public Health health() {
int errorCode = check(); // perform some specific health check
if (errorCode != 0) {
return Health.down().withDetail("Error Code", errorCode).build();
}
return Health.up().build();
}}
另外,除了Spring boot定义的几个状态类型,我们也可以自定义状态类型,用来表示一个新的系统状态。在这种情况下,你还需要实现接口 HealthAggregator ,或者通过配置 management.health.status.order 来继续使用HealthAggregator的默认实现。
例如,在你自定义的健康检查HealthIndicator的实现类中,使用了自定义的状态类型FATAL,为了配置该状态类型的严重程度,你需要在application的配置文件中添加如下配置:
management.health.status.order=FATAL, DOWN, OUT_OF_SERVICE, UNKNOWN, UP
————————————————
在做健康检查时,响应中的HTTP状态码反应了整体的健康状态,(例如,UP 对应 200, 而 OUT_OF_SERVICE 和 DOWN 对应 503)。同样,你也需要为自定义的状态类型设置对应的HTTP状态码,例如,下面的配置可以将 FATAL 映射为 503(服务不可用):
management.health.status.http-mapping.FATAL=503
下面是内置健康状态类型对应的HTTP状态码列表:
Status Mapping
OUT_OF_SERVICE SERVICE_UNAVAILABLE (503)
DOWN SERVICE_UNAVAILABLE (503)
UP No mapping by default, so http status is 200
UNKNOWN No mapping by default, so http status is 200
————————————————
版权声明:本文为博主原创文章,遵循 CC 4.0 BY-SA 版权协议,转载请附上原文出处链接和本声明。
原文链接:https://blog.csdn.net/qq_45297578/article/details/116272620
【SpringBoot新手篇】SpringBoot集成actuator监控服务-CSDN博客
2、和普罗米修斯结合
2.1加入Maven坐标
<dependency>
    <groupId>org.springframework.boot</groupId>
    <artifactId>spring-boot-starter-actuator</artifactId>
</dependency>
<dependency>
    <groupId>io.micrometer</groupId>
    <artifactId>micrometer-registry-prometheus</artifactId>
</dependency>
2.2配置信息
management.endpoints.web.exposure.include=*
2.3访问这个路径
http://ip:port/demo-prometheus/actuator/prometheus得到如下信息即配置正确
# HELP tomcat_global_sent_bytes_total
# TYPE tomcat_global_sent_bytes_total counter
tomcat_global_sent_bytes_total{name="http-nio-10101",} 5925847.0
# HELP process_start_time_seconds The start time of the Java virtual machine
# TYPE process_start_time_seconds gauge
process_start_time_seconds 1.523875107155E9
# HELP tomcat_sessions_created_total
# TYPE tomcat_sessions_created_total counter
tomcat_sessions_created_total 0.0
# HELP tomcat_global_request_max_seconds
# TYPE tomcat_global_request_max_seconds gauge
tomcat_global_request_max_seconds{name="http-nio-10101",} 60.17
# HELP process_cpu_usage The "recent cpu usage" for the Java Virtual Machine process
# TYPE process_cpu_usage gauge
process_cpu_usage 0.012943162633652222
# HELP jvm_threads_daemon The current number of live daemon threads
# TYPE jvm_threads_daemon gauge
jvm_threads_daemon 64.0
# HELP jvm_memory_committed_bytes The amount of memory in bytes that is committed for  the Java virtual machine to use
# TYPE jvm_memory_committed_bytes gauge
jvm_memory_committed_bytes{area="nonheap",id="CodeHeap 'non-nmethods'",} 2555904.0
jvm_memory_committed_bytes{area="nonheap",id="Metaspace",} 8.9419776E7
jvm_memory_committed_bytes{area="nonheap",id="CodeHeap 'profiled nmethods'",} 2.5165824E7
jvm_memory_committed_bytes{area="nonheap",id="Compressed Class Space",} 1.1087872E7
jvm_memory_committed_bytes{area="heap",id="G1 Eden Space",} 6.54311424E8
jvm_memory_committed_bytes{area="heap",id="G1 Old Gen",} 3.97410304E8
jvm_memory_committed_bytes{area="heap",id="G1 Survivor Space",} 2.2020096E7
jvm_memory_committed_bytes{area="nonheap",id="CodeHeap 'non-profiled nmethods'",} 8650752.0
# HELP system_cpu_usage The "recent cpu usage" for the whole system
# TYPE system_cpu_usage gauge
system_cpu_usage 0.009003939223410242
# HELP tomcat_threads_config_max
# TYPE tomcat_threads_config_max gauge
tomcat_threads_config_max{name="http-nio-10101",} 200.0
# HELP tomcat_sessions_active_current
# TYPE tomcat_sessions_active_current gauge
tomcat_sessions_active_current 0.0
# HELP tomcat_cache_hit_total
# TYPE tomcat_cache_hit_total counter
tomcat_cache_hit_total 0.0
# HELP tomcat_sessions_rejected_total
# TYPE tomcat_sessions_rejected_total counter
tomcat_sessions_rejected_total 0.0
# HELP jvm_threads_live The current number of live threads including both daemon and non-daemon threads
# TYPE jvm_threads_live gauge
jvm_threads_live 68.0
# HELP jvm_classes_loaded The number of classes that are currently loaded in the Java virtual machine
# TYPE jvm_classes_loaded gauge
jvm_classes_loaded 14846.0
# HELP jvm_gc_pause_seconds Time spent in GC pause
# TYPE jvm_gc_pause_seconds summary
jvm_gc_pause_seconds_count{action="end of minor GC",cause="Metadata GC Threshold",} 1.0
jvm_gc_pause_seconds_sum{action="end of minor GC",cause="Metadata GC Threshold",} 0.047
jvm_gc_pause_seconds_max{action="end of minor GC",cause="Metadata GC Threshold",} 0.0
jvm_gc_pause_seconds_count{action="end of minor GC",cause="G1 Evacuation Pause",} 3.0
jvm_gc_pause_seconds_sum{action="end of minor GC",cause="G1 Evacuation Pause",} 0.105
jvm_gc_pause_seconds_max{action="end of minor GC",cause="G1 Evacuation Pause",} 0.0
# HELP jvm_gc_memory_allocated_bytes_total Incremented for an increase in the size of the young generation memory pool after one GC to before the next
# TYPE jvm_gc_memory_allocated_bytes_total counter
jvm_gc_memory_allocated_bytes_total 1.0030608E7
# HELP tomcat_servlet_request_seconds
# TYPE tomcat_servlet_request_seconds summary
tomcat_servlet_request_seconds_count{name="default",} 0.0
tomcat_servlet_request_seconds_sum{name="default",} 0.0
# HELP jvm_buffer_total_capacity_bytes An estimate of the total capacity of the buffers in this pool
# TYPE jvm_buffer_total_capacity_bytes gauge
jvm_buffer_total_capacity_bytes{id="mapped",} 0.0
jvm_buffer_total_capacity_bytes{id="direct",} 6.7427031E7
# HELP process_uptime_seconds The uptime of the Java virtual machine
# TYPE process_uptime_seconds gauge
process_uptime_seconds 244011.477
# HELP tomcat_sessions_expired_total
# TYPE tomcat_sessions_expired_total counter
tomcat_sessions_expired_total 0.0
# HELP tomcat_sessions_active_max
# TYPE tomcat_sessions_active_max gauge
tomcat_sessions_active_max 0.0
# HELP jvm_gc_memory_promoted_bytes_total Count of positive increases in the size of the old generation memory pool before GC to after GC
# TYPE jvm_gc_memory_promoted_bytes_total counter
jvm_gc_memory_promoted_bytes_total 0.0
# HELP tomcat_sessions_alive_max_seconds
# TYPE tomcat_sessions_alive_max_seconds gauge
tomcat_sessions_alive_max_seconds 0.0
# HELP tomcat_global_error_total
# TYPE tomcat_global_error_total counter
tomcat_global_error_total{name="http-nio-10101",} 16.0
# HELP tomcat_threads_busy
# TYPE tomcat_threads_busy gauge
tomcat_threads_busy{name="http-nio-10101",} 0.0
# HELP system_load_average_1m The sum of the number of runnable entities queued to available processors and the number of runnable entities running on the available processors averaged over a period of time
# TYPE system_load_average_1m gauge
system_load_average_1m 0.0
# HELP process_files_open The open file descriptor count
# TYPE process_files_open gauge
process_files_open 142.0
# HELP system_cpu_count The number of processors available to the Java virtual machine
# TYPE system_cpu_count gauge
system_cpu_count 4.0
# HELP jvm_gc_max_data_size_bytes Max size of old generation memory pool
# TYPE jvm_gc_max_data_size_bytes gauge
jvm_gc_max_data_size_bytes -1.0
# HELP tomcat_cache_access_total
# TYPE tomcat_cache_access_total counter
tomcat_cache_access_total 0.0
# HELP http_server_requests_seconds
# TYPE http_server_requests_seconds summary
http_server_requests_seconds_count{exception="None",method="GET",status="200",uri="/**",} 3.0
http_server_requests_seconds_sum{exception="None",method="GET",status="200",uri="/**",} 0.024679861
http_server_requests_seconds_max{exception="None",method="GET",status="200",uri="/**",} 0.0
http_server_requests_seconds_count{exception="None",method="GET",status="200",uri="/webjars/**",} 31.0
http_server_requests_seconds_sum{exception="None",method="GET",status="200",uri="/webjars/**",} 2.672684295
http_server_requests_seconds_max{exception="None",method="GET",status="200",uri="/webjars/**",} 0.0
http_server_requests_seconds_count{exception="None",method="GET",status="200",uri="/swagger-resources/configuration/ui",} 3.0
http_server_requests_seconds_sum{exception="None",method="GET",status="200",uri="/swagger-resources/configuration/ui",} 0.075265631
http_server_requests_seconds_max{exception="None",method="GET",status="200",uri="/swagger-resources/configuration/ui",} 0.0
http_server_requests_seconds_count{exception="None",method="GET",status="200",uri="/swagger-resources/configuration/security",} 3.0
http_server_requests_seconds_sum{exception="None",method="GET",status="200",uri="/swagger-resources/configuration/security",} 0.013461829
http_server_requests_seconds_max{exception="None",method="GET",status="200",uri="/swagger-resources/configuration/security",} 0.0
http_server_requests_seconds_count{exception="None",method="GET",status="200",uri="/swagger-resources",} 3.0
http_server_requests_seconds_sum{exception="None",method="GET",status="200",uri="/swagger-resources",} 0.013547926
http_server_requests_seconds_max{exception="None",method="GET",status="200",uri="/swagger-resources",} 0.0
http_server_requests_seconds_count{exception="None",method="GET",status="200",uri="root",} 10.0
http_server_requests_seconds_sum{exception="None",method="GET",status="200",uri="root",} 0.178656116
http_server_requests_seconds_max{exception="None",method="GET",status="200",uri="root",} 0.0
http_server_requests_seconds_count{exception="None",method="GET",status="404",uri="NOT_FOUND",} 7.0
http_server_requests_seconds_sum{exception="None",method="GET",status="404",uri="NOT_FOUND",} 0.013102879
http_server_requests_seconds_max{exception="None",method="GET",status="404",uri="NOT_FOUND",} 0.0
http_server_requests_seconds_count{exception="None",method="GET",status="304",uri="REDIRECTION",} 10.0
http_server_requests_seconds_sum{exception="None",method="GET",status="304",uri="REDIRECTION",} 0.020565319
http_server_requests_seconds_max{exception="None",method="GET",status="304",uri="REDIRECTION",} 0.0
http_server_requests_seconds_count{exception="None",method="GET",status="200",uri="/v1/serial/number",} 88.0
http_server_requests_seconds_sum{exception="None",method="GET",status="200",uri="/v1/serial/number",} 0.987564415
http_server_requests_seconds_max{exception="None",method="GET",status="200",uri="/v1/serial/number",} 0.0
http_server_requests_seconds_count{exception="QueryTimeoutException",method="GET",status="200",uri="/v1/serial/number",} 6.0
http_server_requests_seconds_sum{exception="QueryTimeoutException",method="GET",status="200",uri="/v1/serial/number",} 360.059517815
http_server_requests_seconds_max{exception="QueryTimeoutException",method="GET",status="200",uri="/v1/serial/number",} 0.0
# HELP jvm_buffer_memory_used_bytes An estimate of the memory that the Java virtual machine is using for this buffer pool
# TYPE jvm_buffer_memory_used_bytes gauge
jvm_buffer_memory_used_bytes{id="mapped",} 0.0
jvm_buffer_memory_used_bytes{id="direct",} 6.7427032E7
# HELP jvm_classes_unloaded_total The total number of classes unloaded since the Java virtual machine has started execution
# TYPE jvm_classes_unloaded_total counter
jvm_classes_unloaded_total 0.0
# HELP tomcat_servlet_request_max_seconds
# TYPE tomcat_servlet_request_max_seconds gauge
tomcat_servlet_request_max_seconds{name="default",} 0.0
# HELP jvm_memory_used_bytes The amount of used memory
# TYPE jvm_memory_used_bytes gauge
jvm_memory_used_bytes{area="nonheap",id="CodeHeap 'non-nmethods'",} 1414400.0
jvm_memory_used_bytes{area="nonheap",id="Metaspace",} 8.373908E7
jvm_memory_used_bytes{area="nonheap",id="CodeHeap 'profiled nmethods'",} 2.4729472E7
jvm_memory_used_bytes{area="nonheap",id="Compressed Class Space",} 1.0082712E7
jvm_memory_used_bytes{area="heap",id="G1 Eden Space",} 5.74619648E8
jvm_memory_used_bytes{area="heap",id="G1 Old Gen",} 3.557784E7
jvm_memory_used_bytes{area="heap",id="G1 Survivor Space",} 2.2020096E7
jvm_memory_used_bytes{area="nonheap",id="CodeHeap 'non-profiled nmethods'",} 8617856.0
# HELP tomcat_servlet_error_total
# TYPE tomcat_servlet_error_total counter
tomcat_servlet_error_total{name="default",} 0.0
# HELP jvm_memory_max_bytes The maximum amount of memory in bytes that can be used for memory management
# TYPE jvm_memory_max_bytes gauge
jvm_memory_max_bytes{area="nonheap",id="CodeHeap 'non-nmethods'",} 5832704.0
jvm_memory_max_bytes{area="nonheap",id="Metaspace",} -1.0
jvm_memory_max_bytes{area="nonheap",id="CodeHeap 'profiled nmethods'",} 1.22912768E8
jvm_memory_max_bytes{area="nonheap",id="Compressed Class Space",} 1.073741824E9
jvm_memory_max_bytes{area="heap",id="G1 Eden Space",} -1.0
jvm_memory_max_bytes{area="heap",id="G1 Old Gen",} 1.073741824E9
jvm_memory_max_bytes{area="heap",id="G1 Survivor Space",} -1.0
jvm_memory_max_bytes{area="nonheap",id="CodeHeap 'non-profiled nmethods'",} 1.22912768E8
# HELP tomcat_global_received_bytes_total
# TYPE tomcat_global_received_bytes_total counter
tomcat_global_received_bytes_total{name="http-nio-10101",} 0.0
# HELP tomcat_global_request_seconds
# TYPE tomcat_global_request_seconds summary
tomcat_global_request_seconds_count{name="http-nio-10101",} 168.0
tomcat_global_request_seconds_sum{name="http-nio-10101",} 368.401
# HELP tomcat_threads_current
# TYPE tomcat_threads_current gauge
tomcat_threads_current{name="http-nio-10101",} 10.0
# HELP jvm_gc_live_data_size_bytes Size of old generation memory pool after a full GC
# TYPE jvm_gc_live_data_size_bytes gauge
jvm_gc_live_data_size_bytes 0.0
# HELP jvm_buffer_count An estimate of the number of buffers in the pool
# TYPE jvm_buffer_count gauge
jvm_buffer_count{id="mapped",} 0.0
jvm_buffer_count{id="direct",} 108.0
# HELP process_files_max The maximum file descriptor count
# TYPE process_files_max gauge
process_files_max 8192.0
# HELP jvm_threads_peak The peak live thread count since the Java virtual machine started or peak was reset
# TYPE jvm_threads_peak gauge
jvm_threads_peak 68.0
3、权限校验
如果開啟了 Actuator 默認不打開的 endpoints,建議一定要加上 Spring security 之類的做 endpoint 保護,避免重要資訊外洩。因为端点的信息和产生的交互都是非常敏感的,必须防止未经授权的外部访问。
这里我们使用 Spring Security 保护,首先添加相关依赖:
<dependency>
   <groupId>org.springframework.boot</groupId>
   <artifactId>spring-boot-starter-security</artifactId>
</dependency>
添加之后,我们需要定义安全校验规则,来覆盖Spring Security 的默认配置。
这里我给出了两个版本的模板配置:
![]()
import org.springframework.boot.actuate.autoconfigure.security.servlet.EndpointRequest;
import org.springframework.boot.actuate.context.ShutdownEndpoint;
import org.springframework.boot.autoconfigure.security.servlet.PathRequest;
import org.springframework.context.annotation.Configuration;
import org.springframework.security.config.annotation.web.builders.HttpSecurity;
import org.springframework.security.config.annotation.web.configuration.WebSecurityConfigurerAdapter;


@Configuration
public class ActuatorSecurityConfig extends WebSecurityConfigurerAdapter {

    /*
     * version1:
     * 1. 限制 '/shutdown'端点的访问,只允许ACTUATOR访问
     * 2. 允许外部访问其他的端点
     * 3. 允许外部访问静态资源
     * 4. 允许外部访问 '/'
     * 5. 其他的访问需要被校验
     * version2:
     * 1. 限制所有端点的访问,只允许ACTUATOR访问
     * 2. 允许外部访问静态资源
     * 3. 允许外部访问 '/'
     * 4. 其他的访问需要被校验
     */

    @Override
    protected void configure(HttpSecurity http) throws Exception {
        // version1
//        http
//                .authorizeRequests()
//                    .requestMatchers(EndpointRequest.to(ShutdownEndpoint.class))
//                        .hasRole("ADMIN")
//                .requestMatchers(EndpointRequest.toAnyEndpoint())
//                    .permitAll()
//                .requestMatchers(PathRequest.toStaticResources().atCommonLocations())
//                    .permitAll()
//                .antMatchers("/")
//                    .permitAll()
//                .antMatchers("/**")
//                    .authenticated()
//                .and()
//                .httpBasic();

        // version2
        http
                .authorizeRequests()
                .requestMatchers(EndpointRequest.toAnyEndpoint())
                    .hasRole("ADMIN")
                .requestMatchers(PathRequest.toStaticResources().atCommonLocations())
                    .permitAll()
                .antMatchers("/")
                    .permitAll()
                .antMatchers("/**")
                    .authenticated()
                .and()
                .httpBasic();
    }
}
![]()
application.properties的相关配置如下:
# Spring Security Default user name and password
spring.security.user.name=actuator
spring.security.user.password=actuator
spring.security.user.roles=ADMIN
我们使用浏览器访问 http://localhost:8080/actuator/health 端点接口,会先弹出个登录框,只有登录后才能访问。

4、监控检查
现在已知的是sofa框架可以完成这样的功能,但是怎样用还待再深入了解:如何为SpringBoot应用设置健康检查_Serverless 应用引擎(SAE)-阿里云帮助中心 (aliyun.com)
SpringBoot+actuator重写/actuator/health端点-CSDN博客
原理:聊聊springboot的liveness及readiness_management.health.readinessstate.enabled-CSDN博客
SpringBoot使用自定义actuator健康检查完成服务预热、微服务依赖检查_actuator/health-CSDN博客
参考:
【SpringBoot新手篇】SpringBoot集成actuator监控服务-CSDN博客
SpringBoot2.0 Actuator 监控参数说明 - 简书 (jianshu.com)