SpringBoot自带监控功能Actuator,可以帮助实现对程序内部运行情况监控,比如监控状况、Bean加载情况、环境变量、日志信息、线程信息等
pom文件中添加
<!-- actuator start-->
<dependency>
  <groupId>org.springframework.boot</groupId>
  <artifactId>spring-boot-starter-actuator</artifactId>
  <version>${springboot.version}</version>
</dependency>
<!-- actuator end-->
yaml文件
监控端口必须单独配置,否则请求不到
server:
port: 8091
#必须配置,否则端点默认禁用
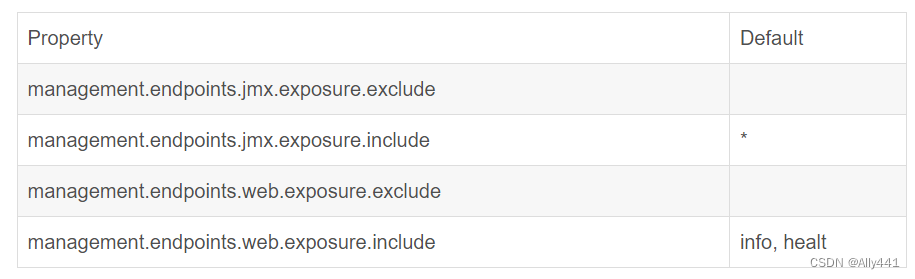
management:
endpoints:
web:
# 路径配置
# base-path: /manage 修改默认的actuator/*
exposure:
include: "*"
# “*”号代表启用所有的监控端点,可以单独启用,例如,health,info,metrics等
# exclude: beans #关闭部分监控点
server:
port: 8091
endpoint:
health:
show-details: always
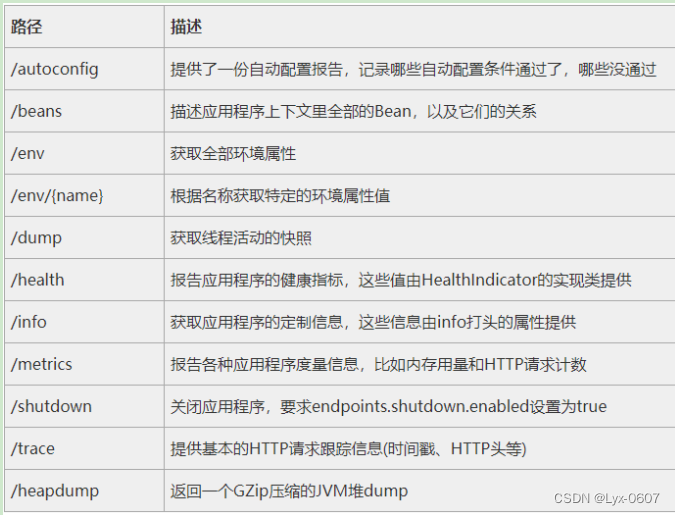
启动项目,请求接口:http:/localhost:8092/actuator 返回的是可以查看的所有接口
health接口
如果项目中同步引用了oracle和redis,请求接口/health 时会带出状态,但信息不是很详细
{

  "status":"UP",
  "components":{

    "db":{

      "status":"UP",
      "details":{

        "database":"Oracle",
        "validationQuery":"isValid()"
      }
    },
    "diskSpace":{

      "status":"UP",
      "details":{

        "total":427390136320,
        "free":412959125504,
        "threshold":10485760,
        "exists":true
      }
    },
    "ping":{

      "status":"UP"
    },
    "redis":{

      "status":"UP",
      "details":{

        "version":"5.0.5"
      }
    }
  }
}
如果想关闭特定的检查指标
management:
  health:
    redise:
      enabled: false
info接口
就是在配置文件中以info开头的配置信息比如
info:
  app:
    name:
      spring-boot-actuator
    version: 1.0.0
    test: test
调用接口展示如下
{

  "app": {

    "name": "spring-boot-actuator",
    "version": "1.0.0",
    "test":"test"
  }
}
beans
展示了 bean 的别名、类型、是否单例、类的地址、依赖等信息。
conditions
可以在应用运行时查看代码了某个配置在什么条件下生效,或者某个自动配置为什么没有生效。
heapdump
访问actuator/heapdump 会自动生成一个jvm的堆文件heapdump 可以用jdk自带的jvm监控工具visualVM打开查看
shutdown
接口关闭springboot服务,需要配置文件开启
management:
  endpoint:
    shutdown:
      enabled: true
只支持post接口
curl -X POST "http://localhost:8080/actuator/shutdown"
{
    "message": "stop"
}
mappings
展示全部的uri路径,和控制器的关系
在项目统计的时候还是蛮有用的
{

    "contexts":{

        "application":{

            "mappings":{

                "dispatcherServlets":{

                    "dispatcherServlet":[
                        {

                            "handler":"example.controller.TestController#get(String)",
                            "predicate":"{GET /test/get}",
                            "details":{

                                "handlerMethod":{

                                    "className":"example.controller.TestController",
                                    "name":"get",
                                    "descriptor":"(Ljava/lang/String;)Ljava/lang/Object;"
                                },
                                "requestMappingConditions":{

                                    "consumes":[

                                    ],
                                    "headers":[

                                    ],
                                    "methods":[
                                        "GET"
                                    ],
                                    "params":[

                                    ],
                                    "patterns":[
                                        "/test/get"
                                    ],
                                    "produces":[

                                    ]
                                }
                            }
                        },


                        {

                            "handler":"ResourceHttpRequestHandler [\"classpath:/META-INF/resources/webjars/\"]",
                            "predicate":"/webjars/**",
                            "details":null
                        },
                        {

                            "handler":"ResourceHttpRequestHandler [\"classpath:/META-INF/resources/\", \"classpath:/resources/\", \"classpath:/static/\", \"classpath:/public/\", \"/\"]",
                            "predicate":"/**",
                            "details":null
                        }
                    ]
                },
                "servletFilters":[
                    {

                        "servletNameMappings":[

                        ],
                        "urlPatternMappings":[
                            "/*"
                        ],
                        "name":"webMvcMetricsFilter",
                        "className":"org.springframework.boot.actuate.metrics.web.servlet.WebMvcMetricsFilter"
                    }

                ],
                "servlets":[
                    {

                        "mappings":[

                        ],
                        "name":"default",
                        "className":"org.apache.catalina.servlets.DefaultServlet"
                    }
                ]
            },
            "parentId":null
        }
    }
}
threaddump接口
会产生当前线程活动的快照,主要展示线程名称、线程id、线程状态等
示例如下
{

    "threads":[
        {

            "threadName":"boundedElastic-evictor-1",
            "threadId":109,
            "blockedTime":-1,
            "blockedCount":0,
            "waitedTime":-1,
            "waitedCount":24,
            "lockName":"java.util.concurrent.locks.AbstractQueuedSynchronizer$ConditionObject@20ab793d",
            "lockOwnerId":-1,
            "lockOwnerName":null,
            "inNative":false,
            "suspended":false,
            "threadState":"TIMED_WAITING",
            "stackTrace":[
                {

                    "methodName":"take",
                    "fileName":"ScheduledThreadPoolExecutor.java",
                    "lineNumber":809,
                    "className":"java.util.concurrent.ScheduledThreadPoolExecutor$DelayedWorkQueue",
                    "nativeMethod":false
                }
            ]
        }
    ]
}
loggers接口
可以查看当前应用的日志级别等信息
metrics接口
http://localhost:8092/actuator/metrics后返回的指标
再任意访问一个参数可以获得对应的指标
http://localhost:8092/actuator/metrics/jvm.buffer.memory.used
{

    "name":"jvm.buffer.memory.used",
    "description":"An estimate of the memory that the Java virtual machine is using for this buffer pool",
    "baseUnit":"bytes",
    "measurements":[
        {

            "statistic":"VALUE",
            "value":65537
        }
    ],
    "availableTags":[
        {

            "tag":"id",
            "values":[
                "direct",
                "mapped"
            ]
        }
    ]
}
序号 参数 参数说明 是否监控 监控手段 重要度
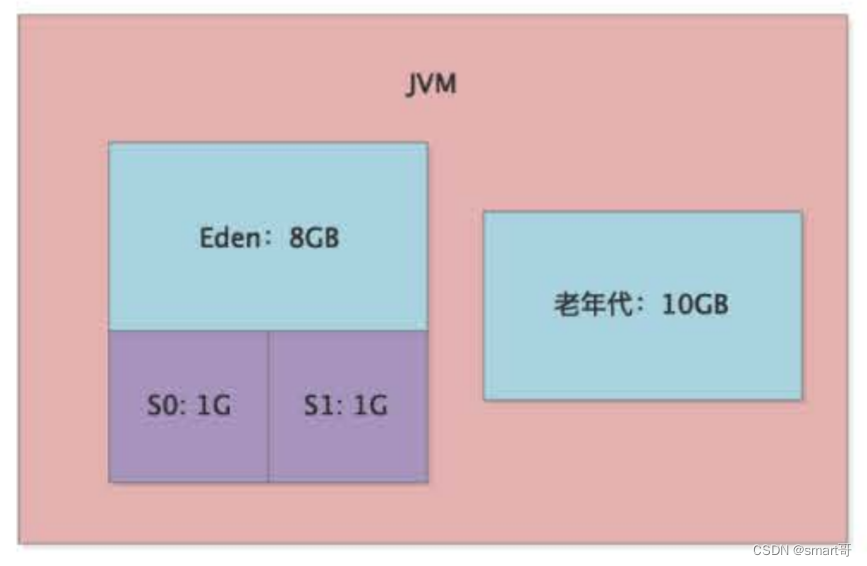
JVM
1 jvm.memory.max JVM 最大内存
2 jvm.memory.committed JVM 可用内存 是 展示并监控堆内存和 Metaspace 重要
3 jvm.memory.used JVM 已用内存 是 展示并监控堆内存和 Metaspace 重要
4 jvm.buffer.memory.used JVM 缓冲区已用内存
5 jvm.buffer.count 当前缓冲区数
6 jvm.threads.daemon JVM 守护线程数 是 显示在监控页面
7 jvm.threads.live JVM 当前活跃线程数 是 显示在监控页面;监控达到阈值时报警 重要
8 jvm.threads.peak JVM 峰值线程数 是 显示在监控页面
9 jvm.classes.loaded 加载 classes 数
10 jvm.classes.unloaded 未加载的 classes 数
11 jvm.gc.memory.allocated GC 时,年轻代分配的内存空间
12 jvm.gc.memory.promoted GC 时,老年代分配的内存空间
13 jvm.gc.max.data.size GC 时,老年代的最大内存空间
14 jvm.gc.live.data.size FullGC 时,老年代的内存空间
15 jvm.gc.pause GC 耗时 是 显示在监控页面
TOMCAT
16 tomcat.sessions.created tomcat 已创建 session 数
17 tomcat.sessions.expired tomcat 已过期 session 数
18 tomcat.sessions.active.current tomcat 活跃 session 数
19 tomcat.sessions.active.max tomcat 最多活跃 session 数 是 显示在监控页面,超过阈值可报警或者进行动态扩容 重要
20 tomcat.sessions.alive.max.second tomcat 最多活跃 session 数持续时间
21 tomcat.sessions.rejected 超过 session 最大配置后,拒绝的 session 个数 是 显示在监控页面,方便分析问题
22 tomcat.global.error 错误总数 是 显示在监控页面,方便分析问题
23 tomcat.global.sent 发送的字节数
24 tomcat.global.request.max request 最长时间
25 tomcat.global.request 全局 request 次数和时间
26 tomcat.global.received 全局 received 次数和时间
27 tomcat.servlet.request servlet 的请求次数和时间
28 tomcat.servlet.error servlet 发生错误总数
29 tomcat.servlet.request.max servlet 请求最长时间
30 tomcat.threads.busy tomcat 繁忙线程 是 显示在监控页面,据此检查是否有线程夯住
31 tomcat.threads.current tomcat 当前线程数(包括守护线程) 是 显示在监控页面 重要
32 tomcat.threads.config.max tomcat 配置的线程最大数 是 显示在监控页面 重要
33 tomcat.cache.access tomcat 读取缓存次数
34 tomcat.cache.hit tomcat 缓存命中次数
CPU
35 system.cpu.count CPU 数量
36 system.load.average.1m load average 是 超过阈值报警 重要
37 system.cpu.usage 系统 CPU 使用率
38 process.cpu.usage 当前进程 CPU 使用率 是 超过阈值报警
39 http.server.requests http 请求调用情况 是 显示 10 个请求量最大,耗时最长的 URL;统计非 200 的请求量 重要
40 process.uptime 应用已运行时间 是 显示在监控页面
41 process.files.max 允许最大句柄数 是 配合当前打开句柄数使用
42 process.start.time 应用启动时间点 是 显示在监控页面
43 process.files.open 当前打开句柄数 是 监控文件句柄使用率,超过阈值后报警 重要
监控页面
<dependency>
  <groupId>cn.pomit</groupId>
  <artifactId>spring-boot-monitor</artifactId>
  <version>0.0.1</version>
</dependency>
启动后访问
http://localhost:8091/monitor
只有一个应用点进去
参考文章:
https://www.pomit.cn/SpringBootMonitor/#/
https://blog.csdn.net/yunfeather/article/details/122581536


![[EMV]一文读懂GAC](https://img-blog.csdnimg.cn/direct/ca86cf0277e8408ca94ca867e49aa5da.png)