二维曲线、散点图
绘图命令:plot(x,y,’line specifiers’,’PropertyName’,PropertyValue)
例子:绘图表示年收入与年份的关系

‘--r*’:--设置线型;r:设置颜色为红色;*节点型号
‘linewidth’:设置线宽;‘markersize’:节点大小


 常用命令:hold on(off):在一张图上持续绘图
或者也可使用命令:line()
图的标注
xlabel(‘text’):x轴标签
ylabel(‘text’):y轴标签
title(‘text’):标题
text(x,y,‘text’):图内文字
gtext(‘text’):指定位置的文字
legend(‘str1’,‘str2’,…,pos):图例区分
其中,pos可取值:
-1:图例外置于右侧
0:图例内置于最佳位置
1:右上 2:左上 3:左下 4:右下

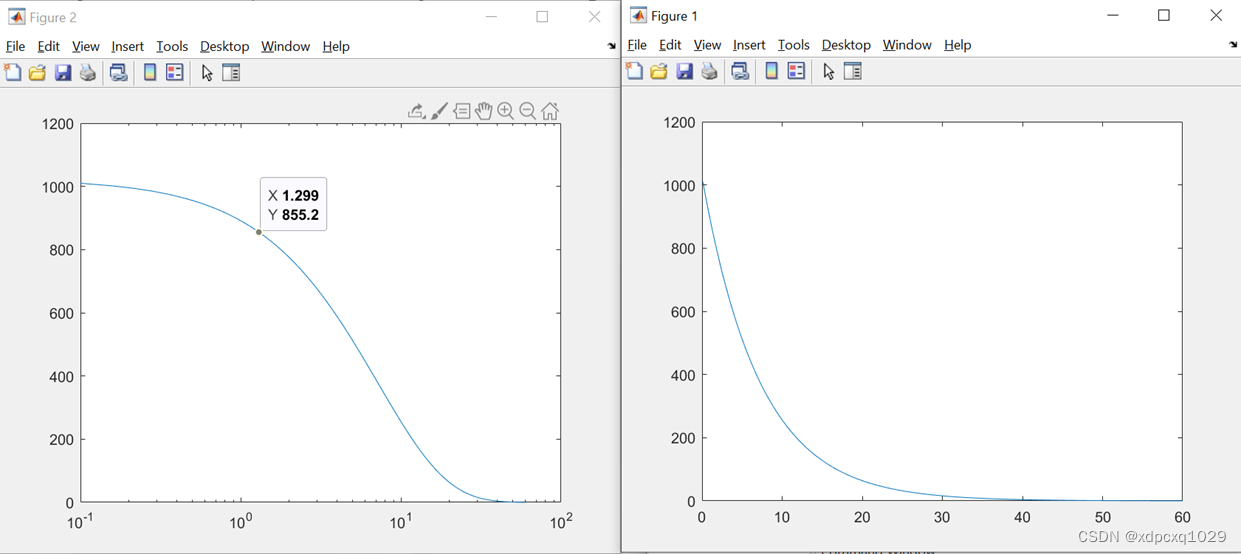
对数坐标轴
function epx_plt1
    years=1994:2000;
    income=[8 12 20 22 18 24 27];
    plot(years,income,'--r*','linewidth',2,'markersize',12)
end
x=-2:0.01:4;
y=3*x.^3-26*x+6;
y2=9*x.^2-25;
y3=17*x;

plot(x,y,'-b');
hold on;
plot(x,y2,'--g');
plot(x,y3,'-.r');
hold off;
x=10:0.1:22;
y=95450./x.^2;
x2=10:2:22;
y2=[950 640 460 340 250 180 140];
plot(x,y,'-','linewidth',1)
xlabel('Distance(cm)')
ylabel('Intensity(lux)')
title('','fontsize',14);
axis([8 24 0 1200]);
text(14,700,'Comparison between theory and experiment.','edgecolor','r','linewidth',2);
hold on
plot(x2,y2,'ro--','linewidth',1,'markersize',10);
legend('Theory','Experiment');
hold off;
figure
x=linspace(0.1,60,1000);
y=2.^(-0.2*x+10);
plot(x,y);

figure
semilogx(x,y);