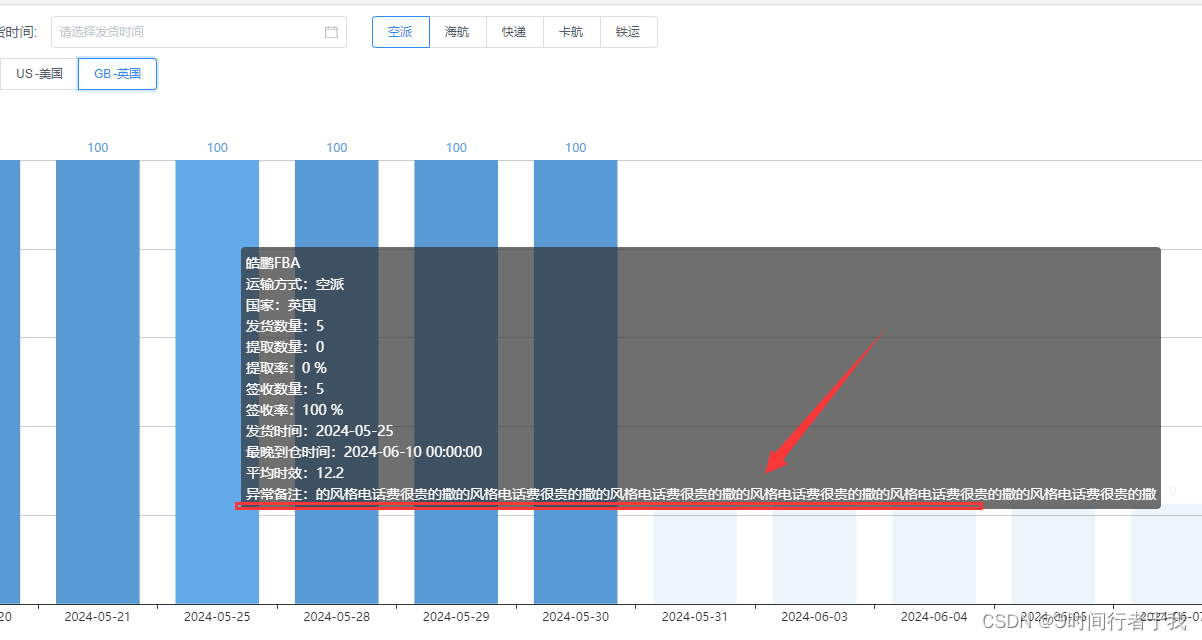
如下代码无法使得图表展示tooltip
<template>
<view style="overflow: hidden; background-color: #fff;box-sizing: border-box; border-radius: 5px; box-shadow: 4px 2px 6px #ccc;padding: 10px; position:relative;">
<view style="font-weight: bold; font-size: 40rpx; color: #4c4c4c;">能耗信息</view>
<view class="charts-box">
<bn-title-bar height="15px" font-size="30rpx">
近30天设备用电趋势
</bn-title-bar>
<qiun-data-charts type="column" :opts="opts" :chartData="chartData" :canvas2d='true' tooltipFormat="tooltipForUnit"/>
</view>
</view>
</template>
<script>
export default {
data() {
return {
chartData: {
},
//您可以通过修改 config-ucharts.js 文件中下标为 ['column'] 的节点来配置全局默认参数,如都是默认参数,此处可以不传 opts 。实际应用过程中 opts 只需传入与全局默认参数中不一致的【某一个属性】即可实现同类型的图表显示不同的样式,达到页面简洁的需求。
opts: {
update: true,
color: ["#52c88d", "#52c88d"],
padding: [15, 5, 12, 5],
enableScroll: false,
dataLabel: false,
canvas2d: true,
legend: {
},
xAxis: {
disableGrid: true,
fontSize: 10,
labelCount: 10,
rotateLabel: false,
},
yAxis: {
gridType: "dash",
dashLength: 2,
disabled: false,
showTitle: true,
data: [{
title: "kWh",
}]
},
extra: {
column: {
type: "group",
width: 15,
activeBgColor: "#000000",
activeBgOpacity: 0.08,
linearType: "custom",
seriesGap: 5,
linearOpacity: 0.5,
barBorderCircle: true,
customColor: [
"#39fae4",
"#52c88d"
]
}
}
}
};
},
onReady() {
this.getServerData();
},
methods: {
getServerData() {
//模拟从服务器获取数据时的延时
setTimeout(() => {
//模拟服务器返回数据,如果数据格式和标准格式不同,需自行按下面的格式拼接
let res = {
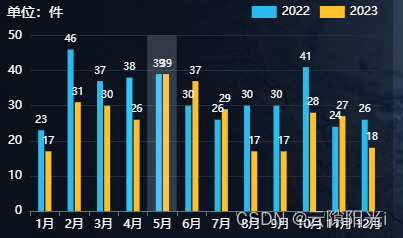
categories: ["2018", "2019", "2020", "2021", "2022", "2023"],
series: [{
name: "目标值",
data: [35, 36, 31, 33, 13, 34]
},
{
name: "完成量",
data: [18, 27, 21, 24, 6, 28]
}
]
};
this.chartData = JSON.parse(JSON.stringify(res));
}, 500);
},
}
};
</script>
<style scoped>
/* 请根据实际需求修改父元素尺寸,组件自动识别宽高 */
.charts-box {
width: 100%;
height: 300px;
}
</style>
解决方式
去除父级的position: relative


![P9842 [ICPC2021 Nanjing R] Klee in Solitary Confinement 题解(SPJ!!!)](https://img-blog.csdnimg.cn/img_convert/03f6fa9d01148787fa34f51d0d1191aa.png)