ubuntu系统
查看Elasticsearch版本
docker search Elasticsearch
拉取镜像(7.1版本)
docker pull docker.elastic.co/elasticsearch/elasticsearch:7.1.0
新建docker-compose.yml 文件
version: '2.2'
services:
  cerebro:
    image: lmenezes/cerebro:0.8.3
    container_name: cerebro
    ports:
      - "9000:9000"
    command:
      - -Dhosts.0.host=http://elasticsearch:9200
  kibana:
    image: docker.elastic.co/kibana/kibana:7.1.0
    container_name: kibana7
    environment:
      - I18N_LOCALE=zh-CN
      - XPACK_GRAPH_ENABLED=true
      - TIMELION_ENABLED=true
      - XPACK_MONITORING_COLLECTION_ENABLED="true"
    ports:
      - "5601:5601"
  elasticsearch:
    image: docker.elastic.co/elasticsearch/elasticsearch:7.1.0
    container_name: es7_01
    environment:
      - cluster.name=xttblog
      - node.name=es7_01
      - bootstrap.memory_lock=true
      - "ES_JAVA_OPTS=-Xms512m -Xmx512m"
      - discovery.seed_hosts=es7_01
      - cluster.initial_master_nodes=es7_01,es7_02
    ulimits:
      memlock:
        soft: -1
        hard: -1
    volumes:
      - es7data1:/usr/share/elasticsearch/data
    ports:
      - 9200:9200
  elasticsearch2:
    image: docker.elastic.co/elasticsearch/elasticsearch:7.1.0
    container_name: es7_02
    environment:
      - cluster.name=xttblog
      - node.name=es7_02
      - bootstrap.memory_lock=true
      - "ES_JAVA_OPTS=-Xms512m -Xmx512m"
      - discovery.seed_hosts=es7_01
      - cluster.initial_master_nodes=es7_01,es7_02
    ulimits:
      memlock:
        soft: -1
        hard: -1
    volumes:
      - es7data2:/usr/share/elasticsearch/data
volumes:
  es7data1:
    driver: local
  es7data2:
    driver: local
运行docker中的compose文件(在上面yml文件的目录运行)
- docker-compose up -d : 在后台运行, 不打印日志
加大系统运行内存
- 如果报错, “max virtual memory areas vm.max_map_count [65530] is too low, increase to at least”那说明你设置的 max_map_count 小了
- 编辑 /etc/sysctl.conf
- 追加以下内容:vm.max_map_count=262144保存后
- 重新启动:sysctl -p
调整elasticsearch的jvm内存(额外操作,可以不加)
- [root@localhost /]# find / -name jvm.options
## JVM configuration

################################################################
## IMPORTANT: JVM heap size
################################################################
##
## You should always set the min and max JVM heap
## size to the same value. For example, to set
## the heap to 4 GB, set:
##
## -Xms4g
## -Xmx4g
##
## See https://www.elastic.co/guide/en/elasticsearch/reference/current/heap-size.html
## for more information
##
################################################################

# Xms represents the initial size of total heap space
# Xmx represents the maximum size of total heap space

-Xms1g      #改成512m
-Xmx1g      #改成512m

################################################################
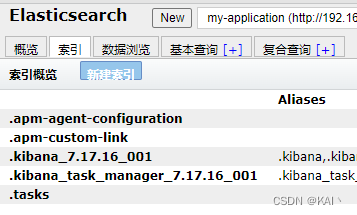
在浏览器去登录ES与kibana与cerebro
- 5601登录kibana

- 9200登录ES

- 9000登录cerebro

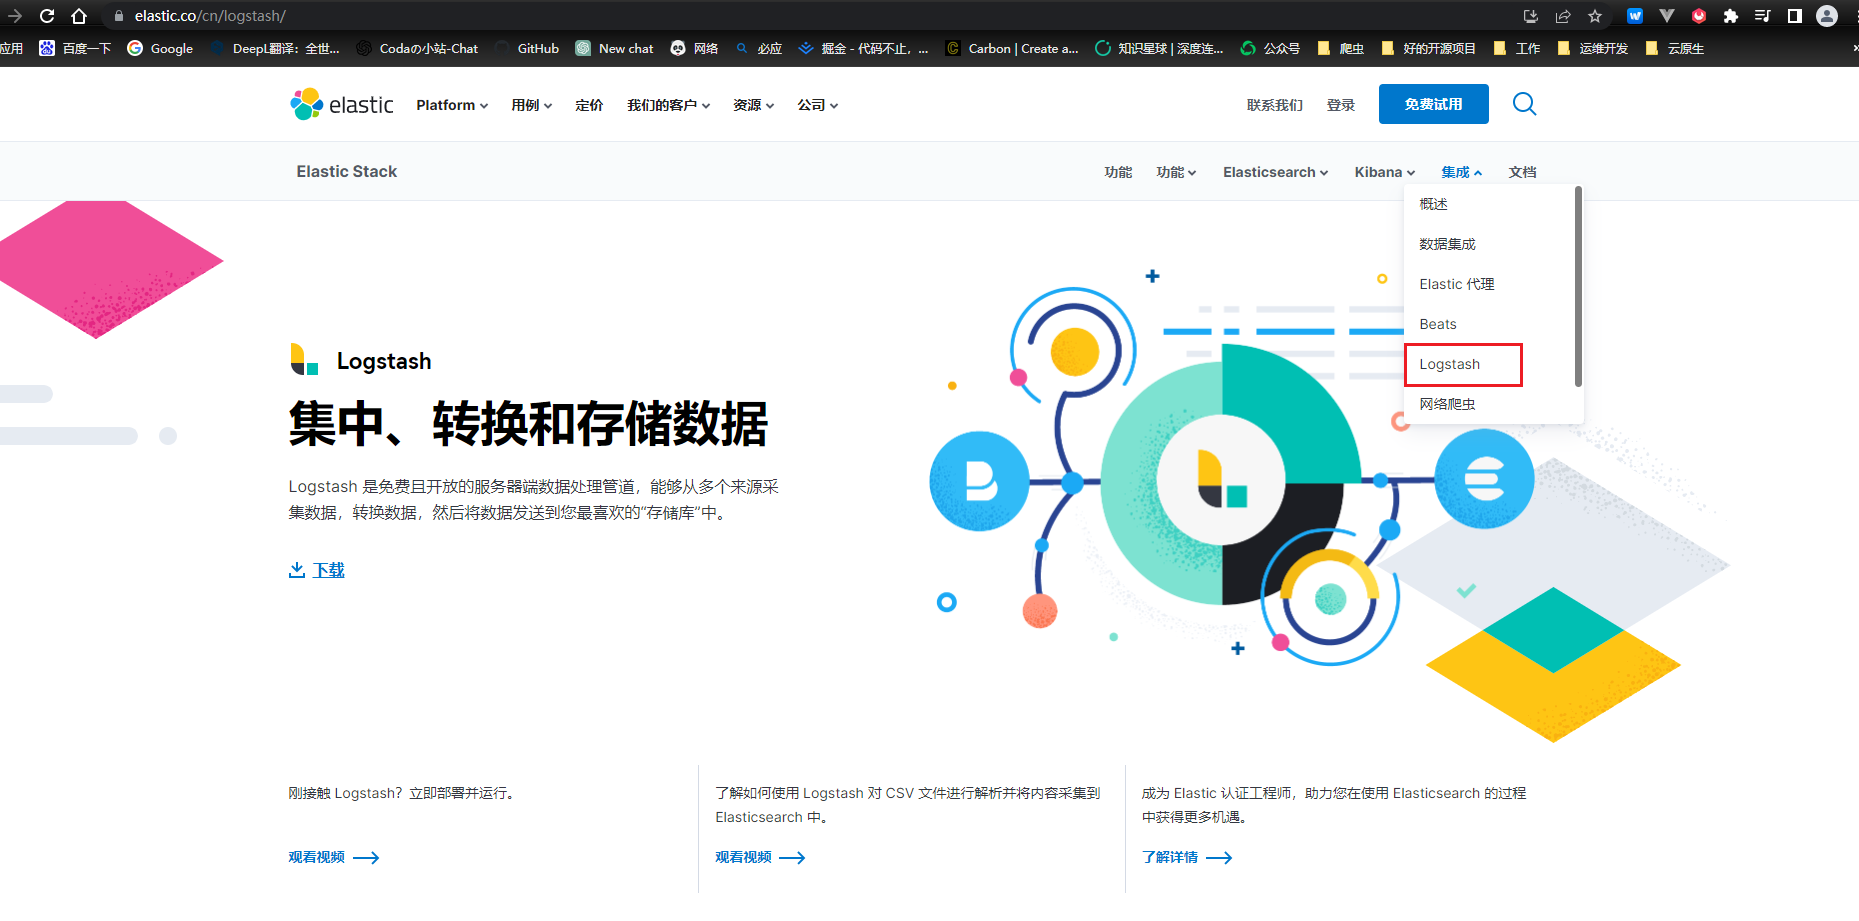
Linux安装logstash
进入到elasticsearch官网下载和elasticsearch同版本的logstash
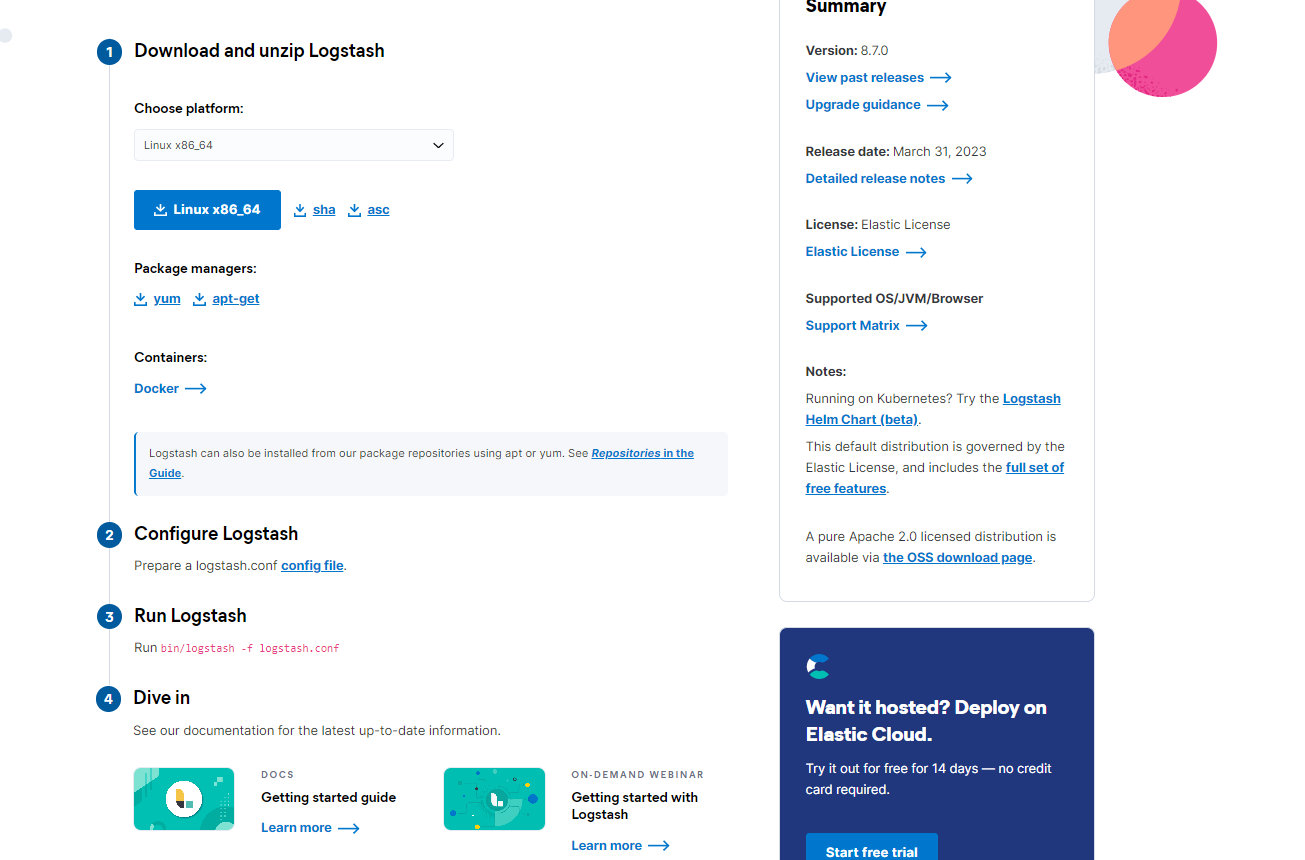
将logstash上传到服务器安装
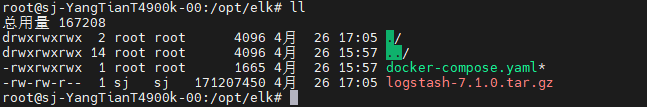
解压logstash:
tar -zxvf logstash-7.1.0.tar.gz
顺便安装一个jdk1.8(安装好的可以跳过)
apt-get install openjdk-8-jdk
配置logstash的配置文件
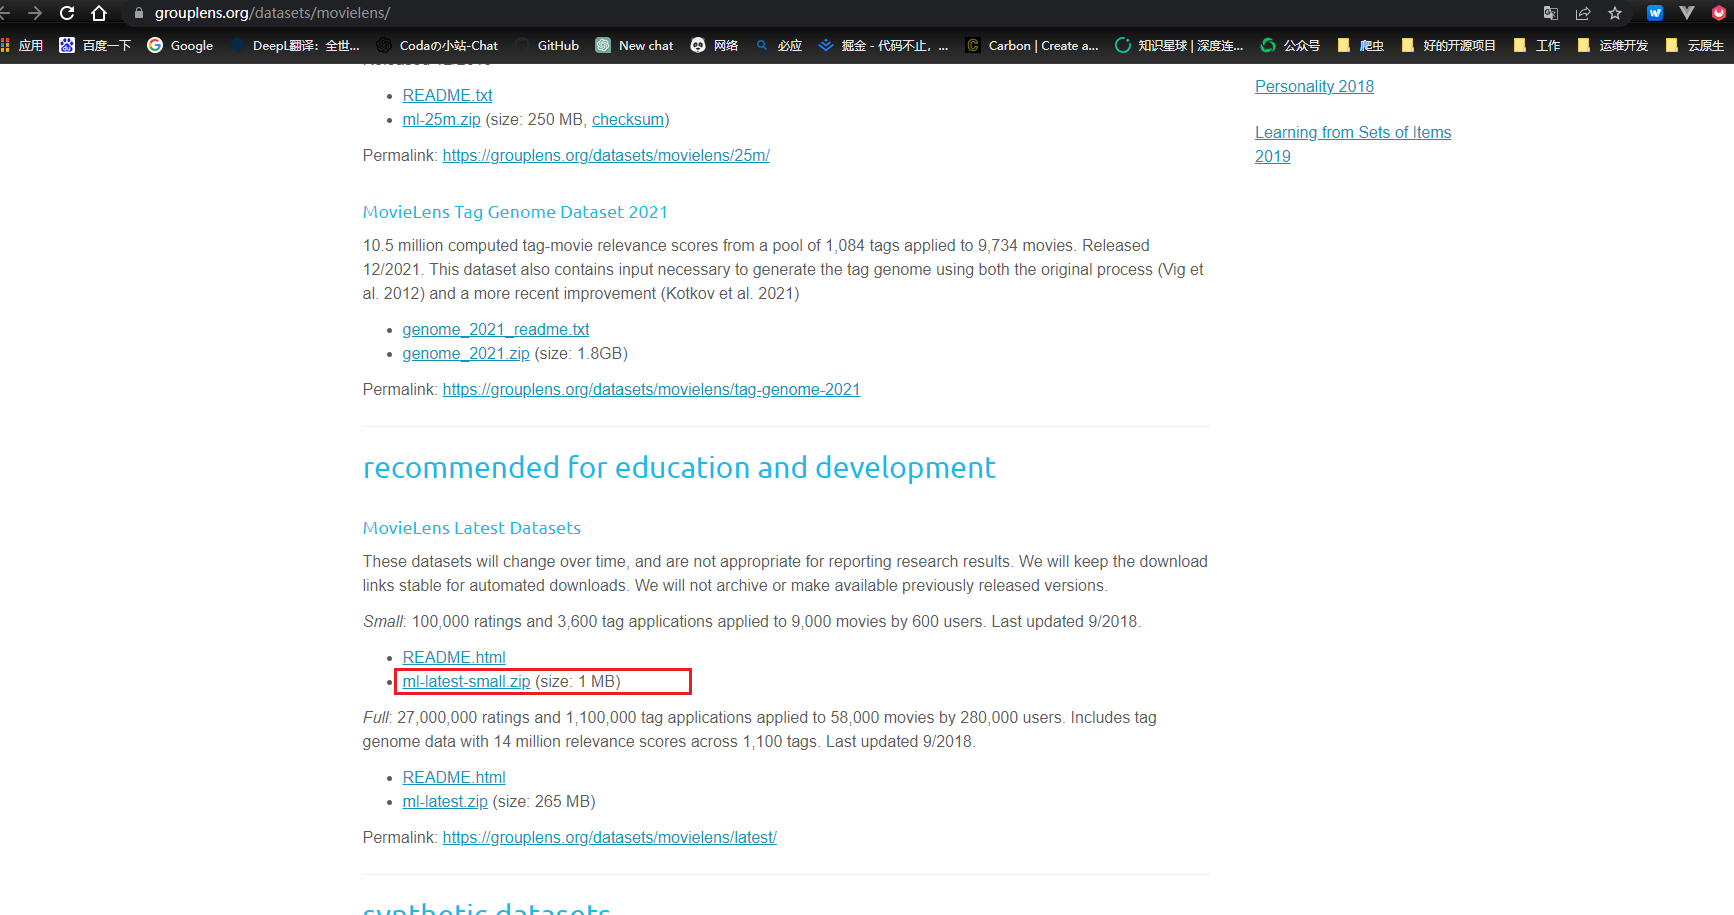
下载测试数据集
- 测试数据集, 就是在我们启动logstash的时候往ES中导入数据, 供我们测试
- 网站:https://grouplens.org/datasets/movielens/
导入数据到elasticsearch
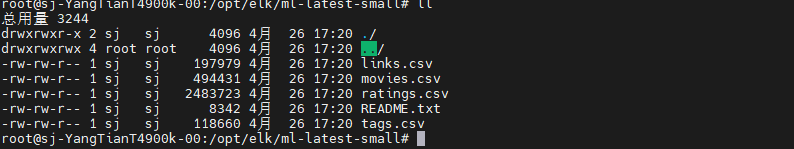
- 传入需要测试的数据集到
/opt/elk文件夹下:
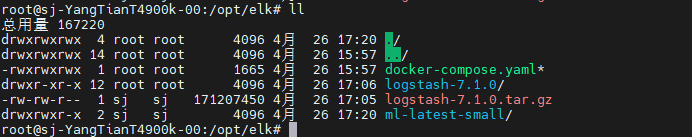
- 数据集文件里面的movies.csv就是我们需要导入的数据
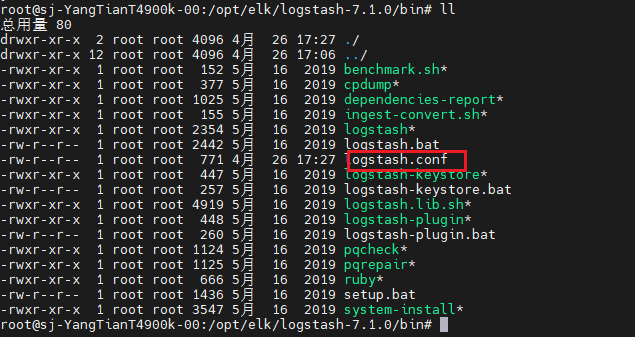
建立配置文件
在logstash的bin目录下新建配置文件
input {
  file {
    path => "/opt/elk/ml-latest-small/movies.csv"
    start_position => "beginning"
    sincedb_path => "/dev/null"
  }
}
filter {
  csv {
    separator => ","
    columns => ["id","content","genre"]
  }

  mutate {
    split => { "genre" => "|"}
    remove_field => ["path", "host", "@timestamp","message"]
  }

  mutate {
    split => ["content", "("]
    add_field => {"title" => "%{[content][0]}"}
    add_field => {"year" => "%{[content][1]}"}
  }

  mutate {
    convert => {
      "year" => "integer"
    }
    strip => ["title"]
    remove_field => ["path", "host", "@timestamp","message","content"]
  }
}

output {
  elasticsearch {
    hosts => ["http://192.168.8.109:9200"]
    index => "movies"
    document_id => "%{id}"
  }
  stdout {}
}
启动logstash
在logstash 的bin目录下启动
cd /opt/elk/logstash-7.1.0/bin && ./logstash -f logstash.conf
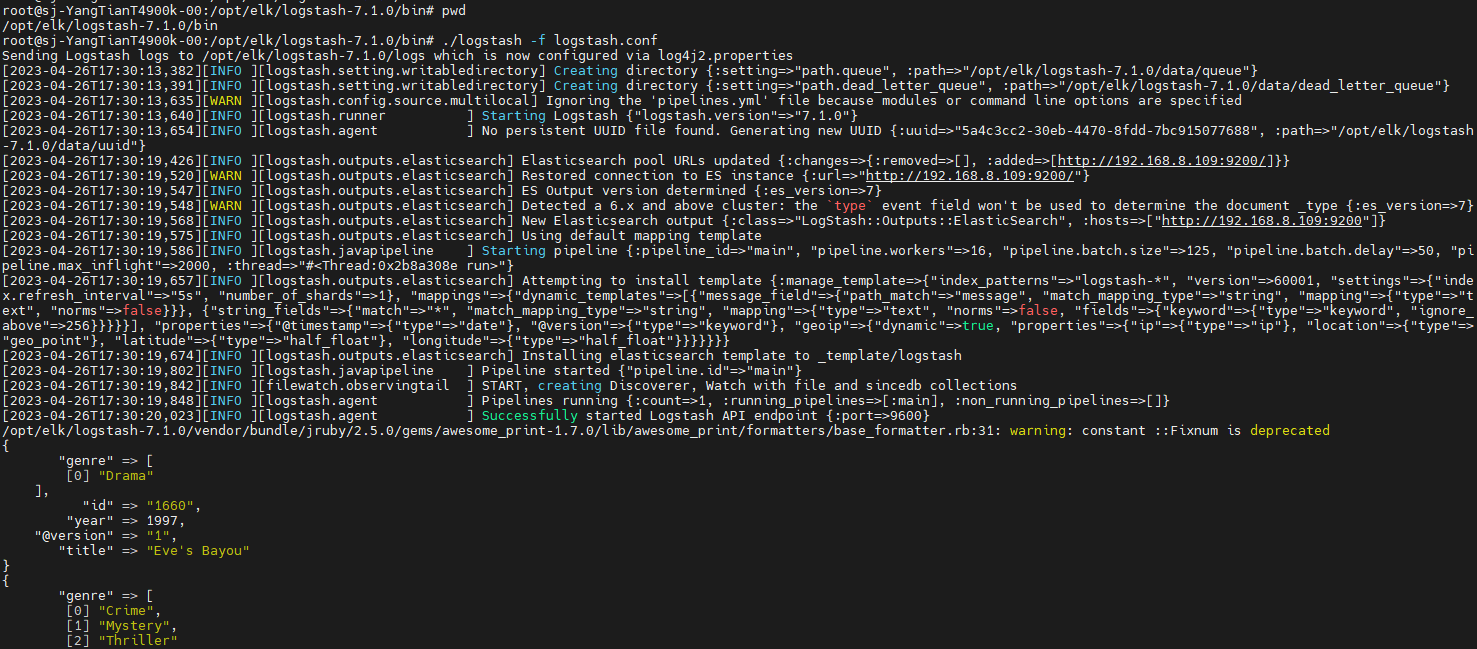
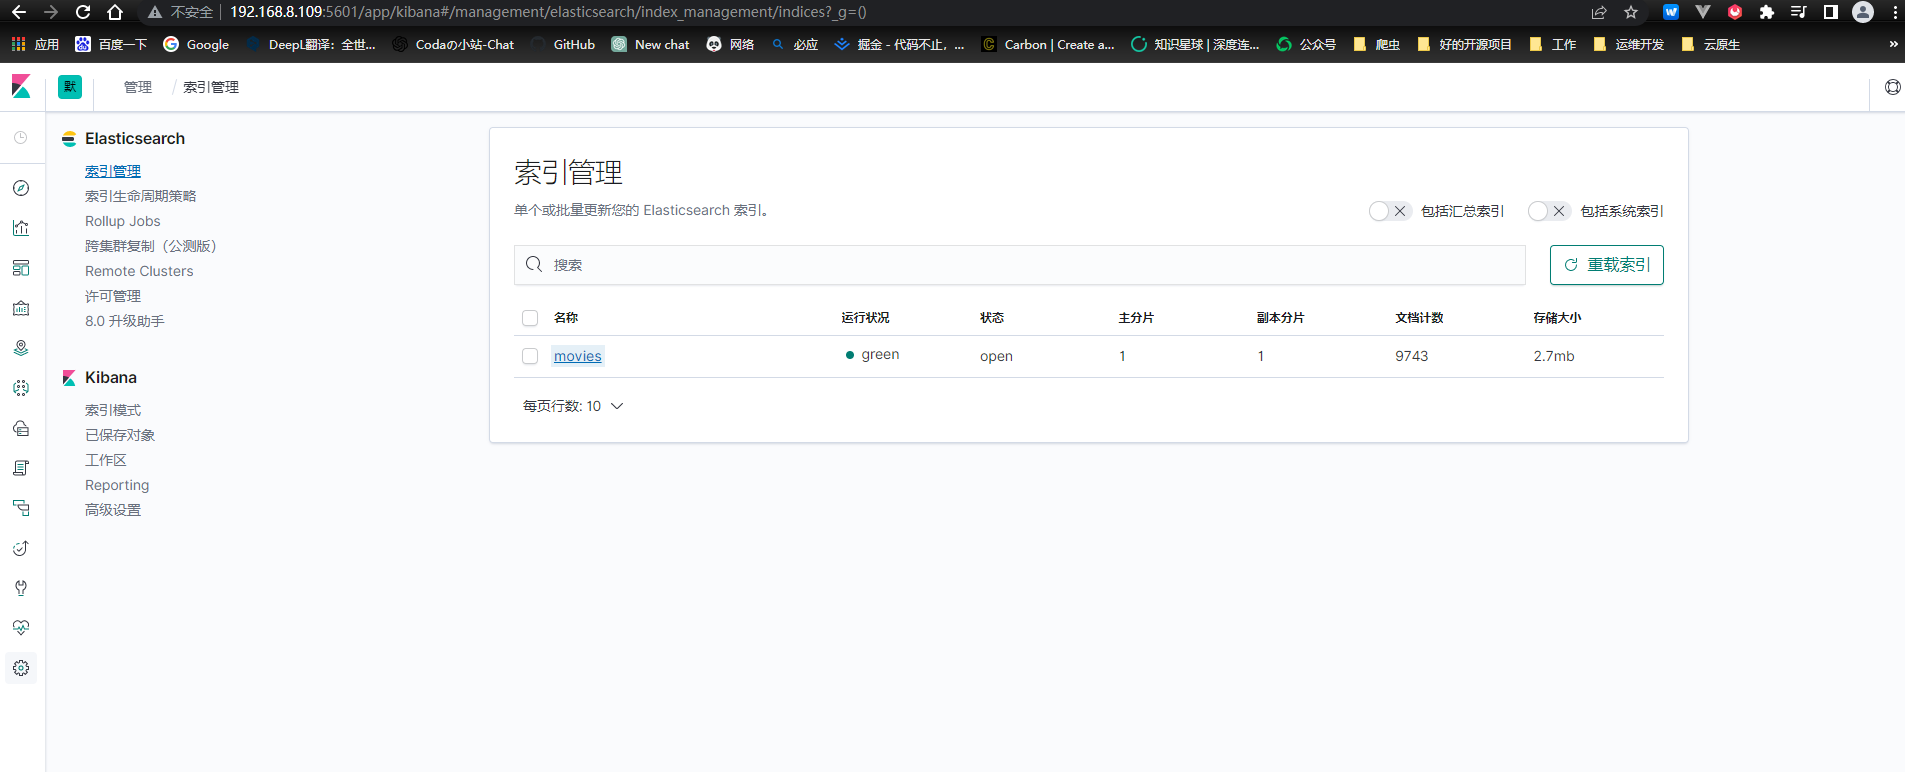
通过日志,我们可以看到数据被导入到elasticsearch中,我们同样可以在kibana中看到数据已经被导入elasticsearch。
微信公众号:海哥python