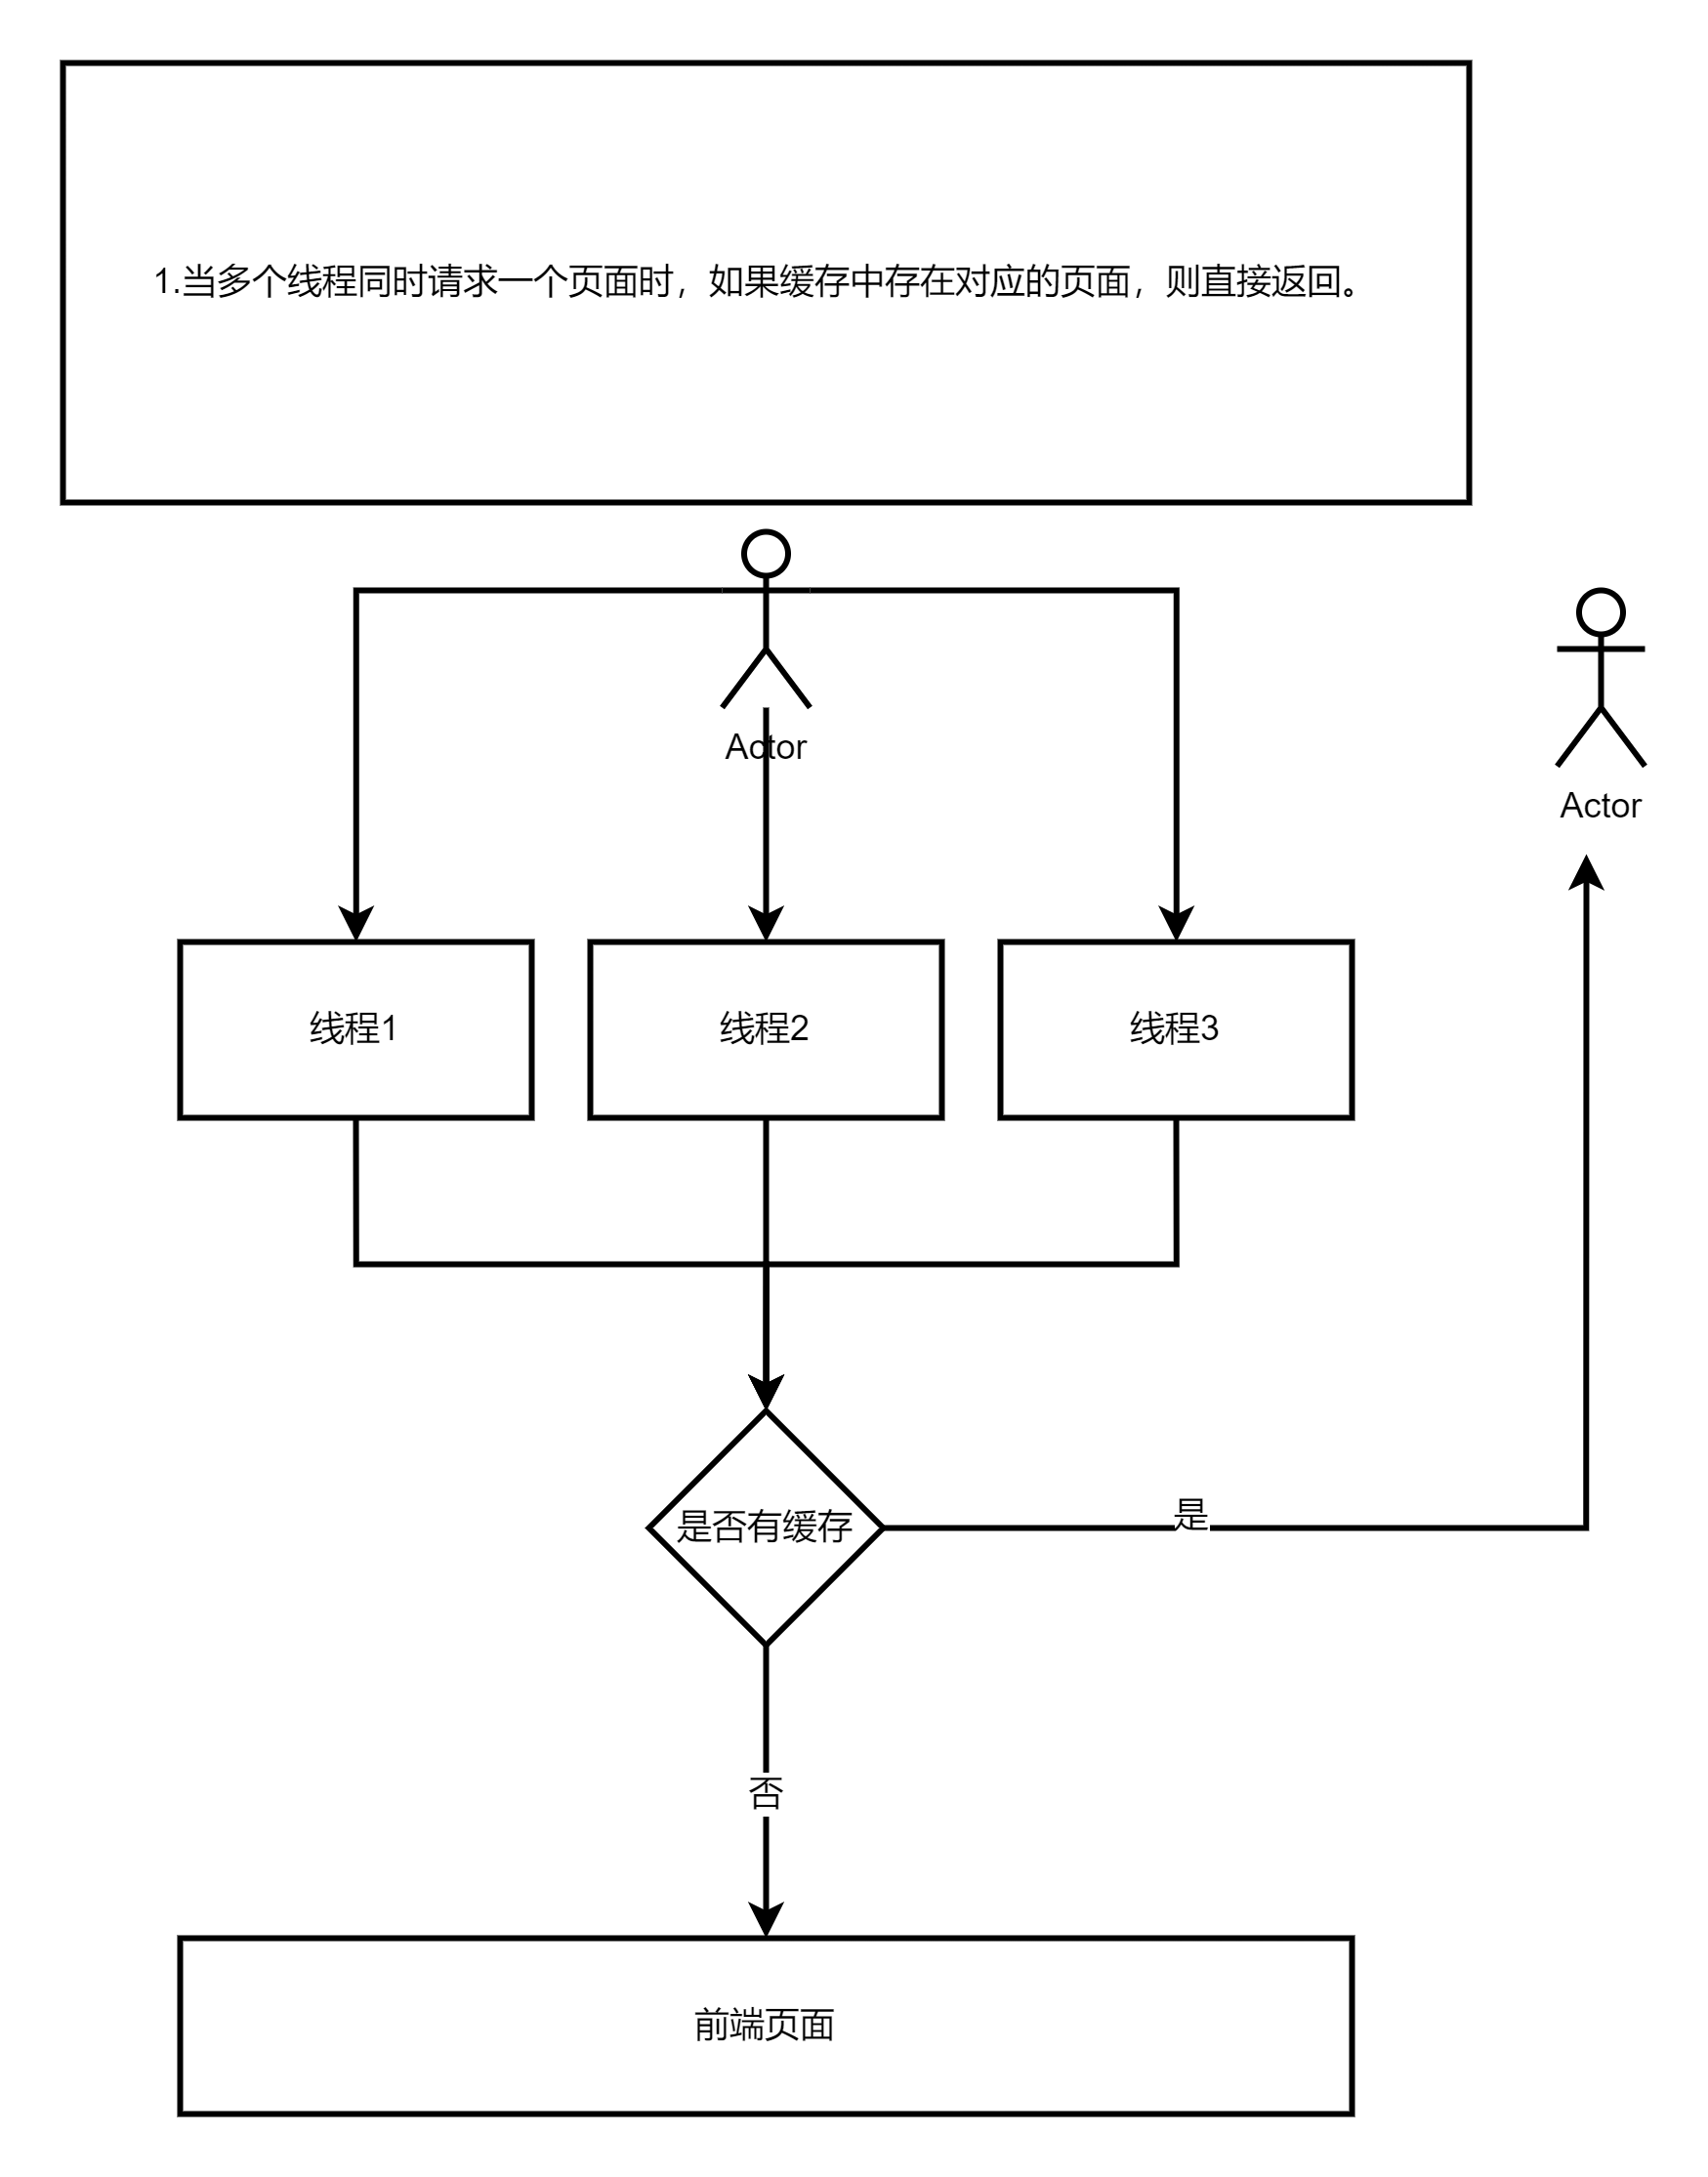
采用Mxgraph在Vue中开发流程图
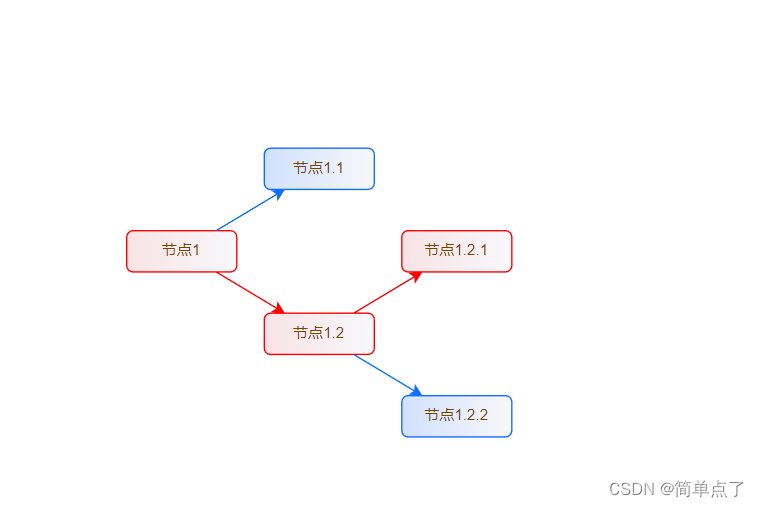
适用于可视化的展示树状图,以及当前选择的节点路径
1.参考代码
<template>
  <div ref="graph_container" style="width: 100%; height: 600px;" className="graph_container"></div>
</template>

<script>
import {mxGraph, mxConstants, mxRectangle, mxGeometry, mxPoint, mxConnectionConstraint} from 'mxgraph-js';

export default {
  name: 'HelloWorld',
  mounted() {
    const treeData = [
      {
        label: '节点1',
        value: '1',
        isDelete: true,
        children: [
          {
            label: '节点1.1',
            value: '1.1',
            children: [],
          },
          {
            label: '节点1.2',
            value: '1.2',
            isDelete: true,
            children: [
              {
                label: '节点1.2.1',
                value: '1.2.1',
                isDelete: true,
                children: [],
              },
              {
                label: '节点1.2.2',
                value: '1.2.2',
                children: [],
              },
            ],
          },
        ],
      },
    ];

    // Create canvas
    const container = this.$refs.graph_container;
    const graph = new mxGraph(container);
    const parent = graph.getDefaultParent();
    graph.setCellsEditable(false);
    // Start updating the canvas
    graph.getModel().beginUpdate();
    try {
      // Draw the tree
      const drawTree = function (node, parentVertex, xOffset, yOffset) {
        let fillColor1, fillColor2, strokeColor;
        if (node.isDelete) {
          fillColor1 = '#F8F8FB'; // Red color for true
          fillColor2 = '#F8E3E5'; // Red color for true
          strokeColor = '#ff0000'; // Red color for true
        } else {
          fillColor1 = '#F8F8FB'; // Blue color for false
          fillColor2 = '#D1E1FC'; // Red color for true
          strokeColor = '#0D6EFF'; // Red color for true
        }

        const vertex = graph.insertVertex(
          parent,
          null,
          node.label,
          xOffset,
          yOffset,
          80,
          30,
          `fillColor=${fillColor1};gradientColor=${fillColor2};gradientDirection=west;strokeColor=${strokeColor};strokeWidth=1;rounded=1;`
        );

        if (parentVertex) {
          const edge = graph.insertEdge(parent, null, '', parentVertex, vertex, `strokeColor=${strokeColor}`);
          // Set edge style to be straight
          graph.setCellStyle(mxConstants.STYLE_EDGE + '=straight', [edge]);
          // Disable edge editing
          edge.setConnectable(false);
          // Set edge geometry to make sure it connects to the center of the vertex
          const geo = new mxGeometry();
          geo.relative = true;
          geo.sourcePoint = new mxPoint(0.5, 1);
          geo.targetPoint = new mxPoint(0.5, 0);
          graph.getModel().setGeometry(edge, geo);

          // Set connection constraints to prevent edges from being disconnected
          const sourceConstraint = new mxConnectionConstraint(new mxPoint(0.5, 1), false);
          const targetConstraint = new mxConnectionConstraint(new mxPoint(0.5, 0), false);
          graph.getConnectionConstraint(edge, parentVertex, true, sourceConstraint);
          graph.getConnectionConstraint(edge, vertex, false, targetConstraint);

          // Set edge color to match the vertex stroke color
          graph.setCellStyles(mxConstants.STYLE_STROKECOLOR, strokeColor, [edge]);
        }
        if (node.children && node.children.length > 0) {
          const childXOffset = xOffset + 100;
          const childYOffsetTop = yOffset - 60;
          const childYOffsetBottom = yOffset + 60;
          for (let i = 0; i < node.children.length; i++) {
            const childYOffset = i % 2 === 0 ? childYOffsetTop : childYOffsetBottom;
            drawTree(node.children[i], vertex, childXOffset, childYOffset);
          }
        }
        return vertex;
      };

      // Use data to draw the tree with the root node in the center
      const rootXOffset = 200;
      const rootYOffset = 200;
      const rootVertex = drawTree(treeData[0], null, rootXOffset, rootYOffset);

      // Auto-adjust the tree height and width
      const bounds = graph.getGraphBounds();
      const height = bounds.y + bounds.height + 20;
      const width = bounds.x + bounds.width + 20;
      graph.view.setGraphBounds(new mxRectangle(0, 0, width, height));
    } finally {
      // End canvas update
      graph.getModel().endUpdate();
    }
  },
};
</script>

<style>
</style>
2.效果图