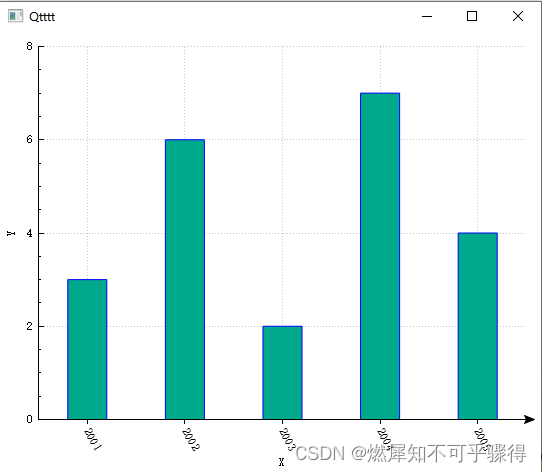
柱状图绘制
// 创建QCustomPlot对象
	QCustomPlot customPlot;

	// 创建柱状图数据
	QVector<double> xData = {
    1, 2, 3, 4, 5 };
	QVector<double> yData = {
    3, 6, 2, 7, 4 };

	// 创建柱状图数据容器
	QCPBars *bars = new QCPBars(customPlot.xAxis, customPlot.yAxis);
	bars->setData(xData, yData);
	//为柱状图设置一个文字类型的key轴,ticks决定了轴的范围,而labels决定了轴的刻度文字的显示
	QVector<double> ticks;
	QVector<QString> labels;
	ticks << 1 << 2 << 3 << 4 << 5 ;
	labels << "2001" << "2002" << "2003" << "2004" << "2005" ;
	QSharedPointer<QCPAxisTickerText> textTicker(new QCPAxisTickerText);
	textTicker->addTicks(ticks, labels);
	customPlot.xAxis->setTicker(textTicker); // 设置为文字轴
	customPlot.xAxis->setTickLabelRotation(60);     // 轴刻度文字旋转60度
	customPlot.xAxis->setSubTicks(false);           // 不显示子刻度
	customPlot.xAxis->setTickLength(0, 4);          // 轴内外刻度的长度分别是0,4,也就是轴内的刻度线不显示
	customPlot.xAxis->setRange(0, 6);               // 设置范围
	customPlot.xAxis->setUpperEnding(QCPLineEnding::esSpikeArrow);
	bars->setWidth(0.4);
	// 设置柱状图样式
	bars->setBrush(QColor(0, 168, 140));  // 设置柱状图颜色
	// 设置坐标轴范围和标签
	customPlot.xAxis->setLabel("X");
	customPlot.yAxis->setLabel("Y");
	customPlot.xAxis->setRange(0.5, 5.5);  // X轴范围从0.5到5.5
	customPlot.yAxis->setRange(0, 8);  // Y轴范围从0到8
	// 显示图表窗口
	customPlot.show();
如图所示
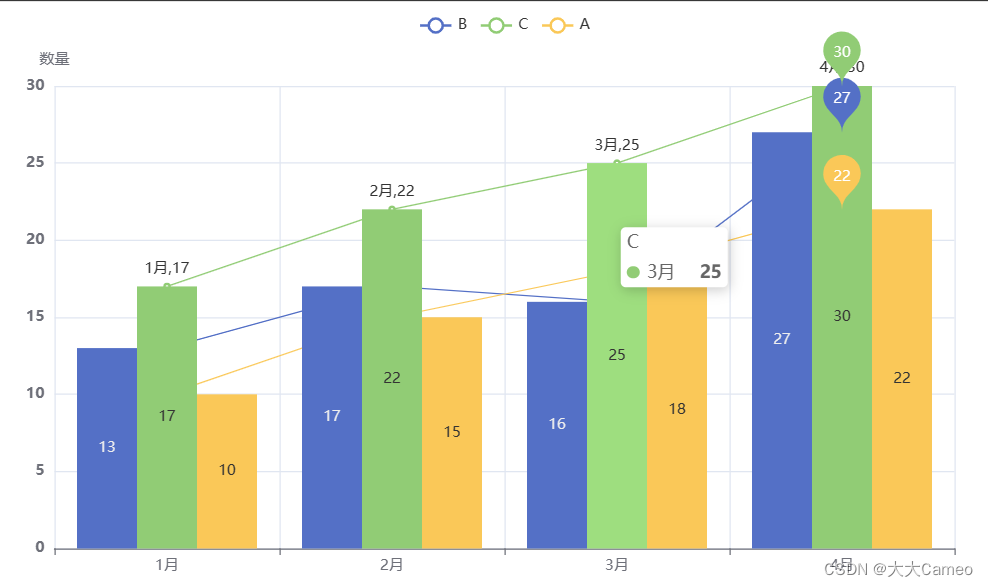
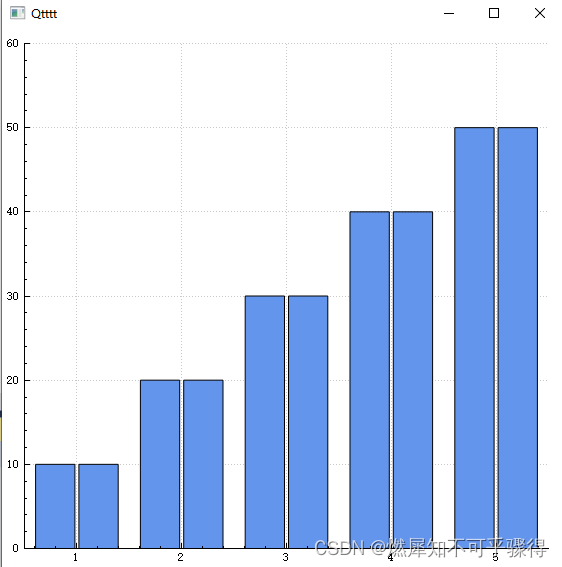
多组柱状图
// 创建QCustomPlot对象件
	QCustomPlot* customPlot = new QCustomPlot();
	customPlot->resize(400, 400);
	// 创建柱状图数据
	QVector<double> xData = {
    1, 2, 3, 4, 5 };
	QVector<double> yData = {
    10, 20, 30, 40, 50 };

	// 创建柱状图
	QCPBars* bars1= new QCPBars(customPlot->xAxis, customPlot->yAxis);
	QCPBars* bars2 = new QCPBars(customPlot->xAxis, customPlot->yAxis);

	QCPBarsGroup* group = new QCPBarsGroup(customPlot);
	bars1->setWidth(bars1->width() / 2);
	bars2->setWidth(bars2->width() / 2);

	group->append(bars1);
	group->append(bars2);

	bars1->setData(xData, yData);
	bars2->setData(xData, yData);

	// 设置柱状图样式
	QPen pen;
	pen.setWidthF(1);
	bars1->setPen(pen);
	bars1->setBrush(QColor(100, 149, 237));
	bars2->setPen(pen);
	bars2->setBrush(QColor(100, 149, 237));

	// 设置坐标轴范围
	customPlot->xAxis->setRange(0.5, 5.5);
	customPlot->yAxis->setRange(0, 60);

	// 显示图表
	customPlot->replot();
	customPlot->show();
如图所示:
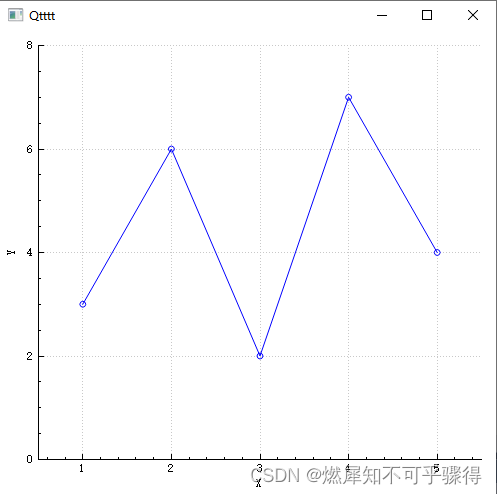
折线图绘制
	// 创建QCustomPlot对象
	QCustomPlot customPlot;

	// 创建折线图数据
	QVector<double> xData = {
    1, 2, 3, 4, 5 };
	QVector<double> yData = {
    3, 6, 2, 7, 4 };

	// 创建折线图数据容器
	customPlot.addGraph();
	customPlot.graph(0)->setData(xData, yData);

	// 设置折线图样式
	customPlot.graph(0)->setLineStyle(QCPGraph::lsLine);       // 设置线条风格为实线
	customPlot.graph(0)->setScatterStyle(QCPScatterStyle::ssCircle);  // 设置散点风格为圆形

	// 设置坐标轴范围和标签
	customPlot.xAxis->setLabel("X");
	customPlot.yAxis->setLabel("Y");
	customPlot.xAxis->setRange(0.5, 5.5);  // X轴范围从0.5到5.5
	customPlot.yAxis->setRange(0, 8);  // Y轴范围从0到8

	// 显示图表窗口
	customPlot.show();