留档,以防忘记
bar3D.tsx
import React, { useEffect, useRef, useState } from 'react';
import * as echarts from 'echarts';
import 'echarts/lib/chart/bar';
import 'echarts/lib/chart/pictorialBar';
import 'echarts/lib/component/grid';
import 'echarts/lib/component/tooltip';
import 'echarts/lib/component/title';
import 'echarts/lib/component/legend';


interface IProps {
    name: string;
    tooltipUnit?: string;
    xdata: Array<string>;
    ydata: Array<number>;
    xLabelRotate?: number;
    barWidth?: number;
    barColor?: {
        left: {
            top: string;
            bottom: string;
        },
        right: {
            top: string;
            bottom: string;
        }
    }
    barCovers?: {
        left: string;
        right: string;
    }
    labelShow?: boolean
    labelColor?: string
    labelFont?: number
    offsetTop?: number | string
}


/**
 *
 * 3D柱状图,支持柱子上下渐变
 *
 * @param name string 图表名称
 * @param tooltipUnit string tooips 中显示的单位
 * @param xdata string[] x轴数据
 * @param ydata number[] y轴数据
 * @param xLabelRotate  number x轴标签旋转角度
 * @param barWidth number 柱状图宽度
 * @param barColor object 柱状图颜色
 * @param barCovers object 柱状图顶部和底部盖子颜色
 * @param labelShow boolean 是否显示柱状图上方文字
 * @param labelColor string 柱状图上方文字颜色
 * @param labelFont number 柱状图上方文字大小
 * @param offsetTop number | string 柱状图上方文字偏移量
 *
 * @returns
 */

const Bar3D = ({
    name = '安全监管',
    tooltipUnit = '%',
    xdata = ['bar1', 'bar2', 'bar3', 'bar4', 'bar5'],
    ydata = [18, 9, 15, 4],
    xLabelRotate = 0,
    barWidth = 25,
    barColor = {
        left: {
            top: '#37F1FD', // 柱子左侧顶部颜色
            bottom: '#12276F' // 柱子左侧底部颜色
        },
        right: {
            top: '#179DD1', // 柱子右侧底部颜色
            bottom: '#08154D'// 柱子右侧底部颜色
        }
    },
    barCovers = {
        left: '#34DFF1', // 柱子顶部和底部左侧盖子颜色
        right: '#1B5590'// 柱子顶部和底部右侧盖子颜色
    },
    labelShow = true,
    labelColor = '#fff',
    labelFont = 10,
    offsetTop = '-5'

}: IProps) => {

    const echartDomRef = useRef<any>();

    useEffect(() => {
        setEchart();
    }, []);

    const setEchart = () => {
        const myChart = echarts.init(echartDomRef.current);


        const topArr: any = []; // 顶部棱盖
        const bottomArr: any = []; // 底部棱盖
        const leftArr: any = []; // 左侧柱子
        const rightArr: any = []; // 右侧柱子


        ydata.map((item: number, index: number) => {
            topArr.push({
                value: item,
                symbol: 'diamond',
                symbolOffset: [0, '-50%'],
                symbolPosition: 'end', // 图形边缘与柱子结束的地方内切
                symbolSize: [barWidth, barWidth * 0.4], // 根据柱子大小来做调整
                itemStyle: {
                    normal: {
                        color: {
                            x: 1,
                            y: 0,
                            x2: 0,
                            y2: 0,
                            type: 'linear',
                            global: false,
                            colorStops: [
                                { offset: 0, color: barCovers.left },
                                { offset: 1, color: barCovers.right }
                            ]
                        }
                    }
                }
            });

            bottomArr.push({
                value: item,
                symbol: 'triangle',
                symbolOffset: [0, barWidth * 0.25],
                symbolSize: [-barWidth, barWidth * 0.25],
                symbolRotate: 180,
                itemStyle: {
                    color: {
                        x: 0,
                        y: 0,
                        x2: 1,
                        y2: 0,
                        type: 'linear',
                        global: false,
                        colorStops: [
                            { offset: 0, color: barColor.left.bottom },
                            { offset: 0.5, color: barColor.left.bottom },
                            { offset: 0.5, color: barColor.right.bottom },
                            { offset: 1, color: barColor.right.bottom }
                        ]
                    }
                }
            });

            leftArr.push({
                value: item,
                itemStyle: {
                    color: {
                        x: 0,
                        y: 0,
                        x2: 0,
                        y2: 1,
                        type: 'linear',
                        global: false,
                        colorStops: [
                            { offset: 0, color: barColor.left.top },
                            { offset: 1, color: barColor.left.bottom }
                        ]
                    }
                }
            });

            rightArr.push({
                value: item,
                itemStyle: {
                    color: {
                        x: 0,
                        y: 0,
                        x2: 0,
                        y2: 1,
                        type: 'linear',
                        global: false,
                        colorStops: [
                            { offset: 0, color: barColor.right.top },
                            { offset: 1, color: barColor.right.bottom }
                        ]
                    }
                }
            });
        });

        const option = {
            grid: {
                left: 15,
                right: 15,
                bottom: 10,
                top: 30,
                containLabel: true
            },
            tooltip: {
                trigger: 'axis',
                confine: true,
                formatter: function (param: any) {
                    let str = '';
                    param.map((el: any, index: number) => {
                        if (el.componentSubType === 'bar') {
                            str = el.seriesName + '<br>' + el.marker + el.name + ':' + el.data.value + '' + tooltipUnit;
                        }
                    });
                    return str;
                }
            },
            xAxis: [
                {
                    type: 'category',
                    data: xdata,
                    axisTick: {
                        show: false
                    },
                    axisLine: {
                        show: false
                    },
                    splitLine: {
                        show: false
                    },
                    axisLabel: {
                        show: true,
                        color: '#76A5D1',
                        fontSize: 10,
                        fontWeight: 300,
                        rotate: xLabelRotate
                    }
                }
            ],
            yAxis: [
                {
                    type: 'value',
                    axisTick: {
                        show: false
                    },
                    axisLine: {
                        show: false
                    },
                    splitLine: {
                        show: true,
                        lineStyle: {
                            color: '#082745'
                        }
                    },
                    axisLabel: {
                        show: true,
                        color: '#76A5D1',
                        fontSize: 10,
                        fontWeight: 300
                    }
                }
            ],
            series: [
                {
                    type: 'pictorialBar',
                    name: '顶部棱盖',
                    z: 10,
                    data: topArr
                },
                {
                    type: 'bar',
                    name: name,
                    barGap: '-50%',
                    // symbol: 'image://' + params.picture, // 图片自己切或者让UI设计切喔
                    symbolOffset: [0, 0],
                    barWidth: barWidth / 2,
                    z: 2,
                    label: {
                        show: labelShow,
                        color: labelColor,
                        fontSize: labelFont,
                        position: 'top',
                        offset: [barWidth / 4, Number(offsetTop)]
                    },
                    data: leftArr,
                },
                {
                    type: 'bar',
                    name: name,
                    barGap: '-5%',
                    // symbol: 'image://' + params.picture, // 图片自己切或者让UI设计切喔
                    symbolOffset: [0, 0],
                    barWidth: barWidth / 2,
                    z: 3,
                    data: rightArr
                },
                {
                    type: 'pictorialBar',
                    name: '底部棱盖',
                    barGap: '-100%',
                    z: 6,
                    data: bottomArr
                }
            ]
        };

        myChart.setOption(option);
    };
    return <div className='w-full h-full' ref={echartDomRef}></div>;
};

export default Bar3D;
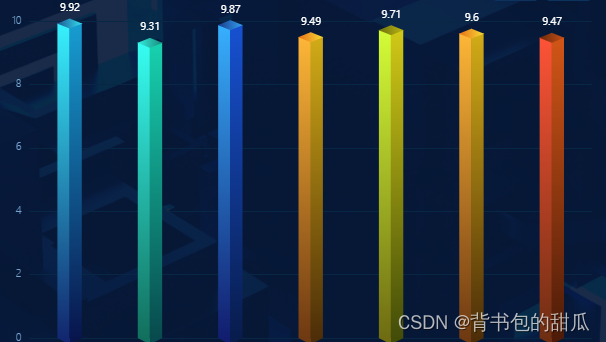
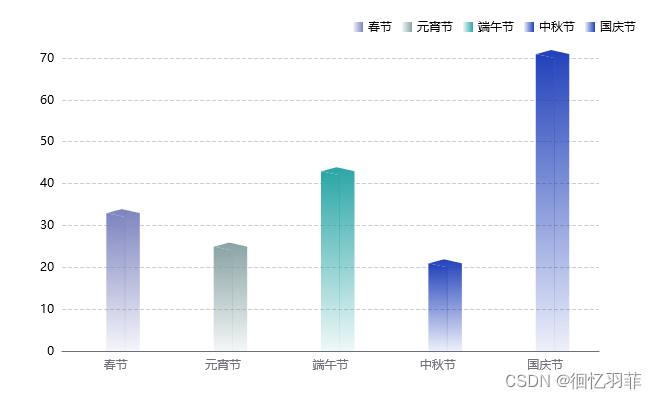
使用
<Bar3D name='近半年系统攻击统计' xdata={['自然安全', '事故安全', '公共卫生', '社会安全', '其他']} ydata={[100, 200, 300, 400, 900]} barWidth={15} />效果


![[图解]企业应用架构模式2024新译本讲解21-数据映射器3](https://img-blog.csdnimg.cn/direct/c25d74519d5a4690871c47a099d90e2d.png)